Blume, KK.
a, Macedo, JC.
c, Meneguzzi, A.
b, Silva, LB.
a, Quevedo, DM.
aand Rodrigues, MAS.
a*
aPrograma de Pós-graduação em Qualidade Ambiental, Universidade Feevale,RS 239, 2755, Vila Nova, Novo Hamburgo, RS, Brazil
bPrograma de Pós-graduação em Minas, Metalurgia e Materiais, Universidade Federal do Rio Grande do Sul – UFRGS, Av. Bento Gonçalves, 9500, Setor 4, prédio 74, CEP 91501-970, Porto Alegre, RS, Brazil
cCompanhia Municipal de Saneamento – NH, Av. Coronel Travassos, 287, CEP 93415-000, Rondônia, Novo Hamburgo, RS, Brazil
*e-mail: marcor@feevale.br
Received February 21, 2010 – Accepted April 29, 2010 – Distributed December 31, 2010 (With 11 figures)
Abstract
The Sinos River basin is located Northeast of the state of Rio Grande do Sul (29° 20’ to 30° 10’ S and 50° 15’ to 51° 20’ W), Southern Brazil, covering two geomorphologic provinces: the Southern plateau and central depression. It is part of the Guaíba basin and has an area of approximately 800 km2, encompassing 32 municipalities. The objective of
this study was to monitor water quality in the Sinos River, the largest river in this basin. Water samples were collected at four selected sites in the Sinos River, and the following parameters were analysed: pH, dissolved oxygen, biochemical oxygen demand (BOD5), turbidity, fecal coliforms, total dissolved solids, temperature, nitrate, nitrite, phosphorous, chromium, lead, aluminum, zinc, iron, and copper. The results were analysed based on Resolution No. 357/2005 of the Brazilian National Environmental Council (CONAMA) regarding regulatory limits for residues in water. A second analysis was performed based on a water quality index (WQI) used by the Sinos River Basin Management Committee (COMITESINOS). Poor water quality in the Sinos River presents a worrying scenario for the region, since this river is the main source of water supply for the urban core. Health conditions found in the Sinos River, mainly in its lower reaches, are worrying and a strong indicator of human activities on the basin.
Keywords: Sinos River, water resources, water quality.
Avaliação da qualidade da água do Rio dos Sinos
Resumo
A Bacia Hidrográfica do Rio dos Sinos localizada a nordeste do Estado do Rio Grande do Sul, entre as coordenadas geográficas de 29° 20’ a 30°10’ de latitude Sul e de 50° 15’ a 51° 20’ de longitude Oeste. As províncias geomorfológicas abrangidas são o planalto meridional e a depressão. Compondo a Região Hidrográfica do Guaíba, ocupa, aproximadamente, uma área de 800 km2, abrangendo 32 municípios. O objetivo deste trabalho foi monitorar a qualidade da água do rio
dos Sinos, principal rio da bacia hidrográfica do rio dos Sinos. Foram realizadas coletas em quatro pontos selecionados do rio, sendo realizadas análises de pH, oxigênio dissolvido, demanda bioquímica de oxigênio (DBO5), turbidez, coliformes fecais, sólidos dissolvidos totais, temperatura, nitrato, nitrito, fosfato, cromo, chumbo, alumínio, zinco, ferro e cobre. Os resultados do trabalho foram analisados com base na resolução CONAMA nº 357 de 2005 em relação a suas restrições de uso. Outra análise foi feita empregando o Índice de Qualidade das Águas (IQA), índice usado pelo comitê de gerenciamento desta bacia (COMITESINOS). A baixa qualidade da água do rio dos Sinos observada deslumbra um cenário preocupante para a região que usa este rio como a principal fonte de abastecimento público. As condições sanitárias encontradas no rio dos Sinos, principalmente no trecho inferior, são preocupantes sendo forte indicativo das atividades antrópicas na bacia.
The Sinos River is the main course in the basin, and its total length is about 190 km (Pereira and Mansur, 2006). The main environmental impacts are related to the continued overuse of water, the release of pollutants into the soil, air and water, the application of pesticides and fertilizers, the discharge of animal waste into waters, and the reduction and/or extinction of native flora and fauna (Macedo, 2009).
The monitoring of water bodies provides important information for river basin management, making current diagnoses and predicting future environmental outcomes in order to promote sustainable development for the region (Ioris et al., 2008). This study aimed to evaluate the quality of superficial waters in the Sinos River.
2. Material and Methods
2.1. Study area
The Sinos River basin is located Northeast of the state of Rio Grande do Sul (29° 20’ to 30° 10’ S and 50° 15’ to 51° 20’ W), Southern Brazil, covering two geomorphologic provinces: the Southern plateau and central depression. It is part of the Guaíba basin and has an area of approximately 800 km2, including 32 municipalities (FEPAM, 2009).
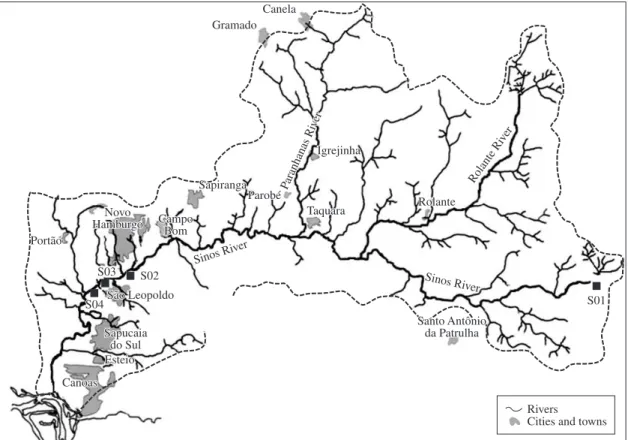
Figure 1 shows the Sinos River basin and the selected sites for water sample collection.
1. Introduction
The quality of life of a population is directly related to water availability and quality. In recent decades, population growth and the consequent increase in industrial activities have contributed to worsen environmental problems, mainly those related to the preservation of ground and surface water (Lopes Tiburtius, 2004). The current availability of water on the planet is far from the global image of abundance and unrestricted access once associated with the earth’s water supplies (Tundisi, 2003).
The current contamination of water resources is a consequence of anthropogenic inputs and has increasingly become a major problem in densely urbanised areas (Demiraka et al., 2006). Other human activities, such as forest cutting and burning and the use of inappropriate management techniques and procedures, have led to soil erosion, and the uncontrolled expansion of cities and highway construction have also contributed to an increase in residue levels in rivers (Margalef, 1991). These residues may bring about changes in the composition of water, which could produce harmful effects on the organisms inhabiting these areas and also on the human body (Villela et al., 2007; Lemos, 2009). The disordered occupation of the Sinos River basin, with the use of aggressive technologies in the water and soil, has led to the increasing contamination of water resources and degradation of its unique flora and fauna (COMITESINOS, 2010).
discussed in detail previously (Lemos, 2003). In the state of Rio Grande do Sul, the Sinos River Basin Management Committee (COMITESINOS) has used this index as a pattern in water quality analysis in the basin.
2.3. Data analysis
Descriptive statistics were used to describe the data collected, comparing measures of central tendency and dispersion, using statistical inference, and considering a significance level of 5%. Statistical inference was performed using parametric ANOVA. The post hoc Tukey test was used for comparison of means (Macedo, 2009).
3. Results and Discussion
In general, the values of all limnological parameters analysed increased from site 1 (source) toward the sites near the mouth of the river (S03 and S04).
Figure 2 shows the concentration of BOD5 in all water samples. BOD5 concentration increased downstream (from S01 toward S04), and such result corresponds to the Currently, the Sinos River basin is a source of water
supply for about 1,300,000 inhabitants, with a population density of around 300 people per square kilometre. The most densely populated urban areas include the cities of Novo Hamburgo (255,945 inhabitants), Canoas (326,458 inhabitants) and São Leopoldo (207,721 inhabitants), which are located in the lower reaches of the river. The region has very diversified production: footwear and leather, metal-mechanics, food, petrochemistry, timber and furniture, tourism and hospitality. The lower reaches of the basin are under strong anthropogenic pressure since the state’s largest industrial park is located in this region. A detailed description of various aspects of the Sinos River basin is provided in the work by Matzenauer (2003) and Chaves (2004).
2.2. Sampling sites
The sampling sites (S01, S02, S03, and S04) were chosen based on institutional studies developed in the area of this river basin (Macedo, 2009). The analysed sites are considered critical to the Sinos River. Superficial water samples were collected about 10 cm below the surface. All samples were kept on ice until laboratory analysis. This study was performed during different sampling periods: spring, summer, autumn, and winter (October 2007 to October 2008). Table 1 describes the selected sampling sites, with their respective coordinates and location along the basin.
All water samples were collected at each site, early in the morning. The following parameters were analysed: pH, temperature, conductivity, dissolved oxygen, biochemical oxygen demand (BOD5), chemical oxygen demand (COD), total nitrogen, ammoniacal nitrogen, total phosphorus, nitrate, nitrite, aluminum, lead, chromium, copper, nickel, iron, zinc, total dissolved solids, turbidity, and fecal coliforms. The metal concentrations were determined by spectrometry atomic absorption (Varian spectra AA100). The analyses were carried out according to the Standard Methods for the Examination of Water and Wastewater (Franson, 1992). The calculation of the water quality index (WQI) used in this study and the parameters involved were
Table 1. Coordinates, location and main contamination source in the selected sampling sites along the Sinos River.
Site Coordinates Location Main contamination source
S01 (control)
29° 43’ 26’’ S and 50° 16’ 46 W’’
Caraã
Close to the river source Upper reach
Minimal anthropogenic impact
S02 29° 41’ 05” S and 50° 50’ 52” W
Santa Cristina After Paranhana River outfall
Middle reach
Agricultural activities
S03 29º 44’ 35” S and 51º 07’ 45” W
Novo Hamburgo Close to Gauchinho and Luiz Rau
Creeks outfalls Lower reach
Metallurgical and tannery industry Urban areas
Urban effluents
S04 29° 47’ 53” S and 51° 11’24” W
Sapucaia
Close to Portão Creek outfall Lower reach
Metallurgical industry Urban effluents from the metropolitan
area
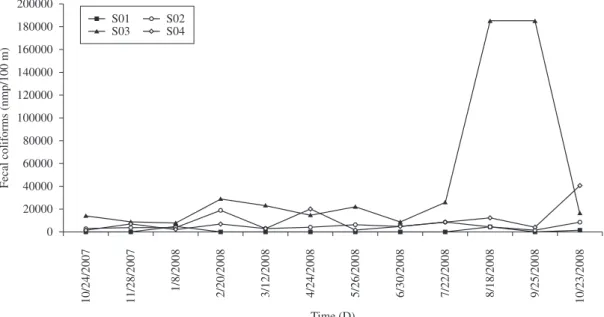
The highest contamination levels (1.9E + 05) were observed on days 9/25/2008 and 8/18/2008. On 9/25/2008, heavy rainfall occurred; therefore, this high contamination value might be associated, in addition to sewage release, with overland runoff containing fecal material deposited into the drainage basin. When comparing mean values for fecal coliform content, there were significant differences between sampling sites. S03 showed mean fecal coliform values higher than those observed at S01 and S02. The results revealed poor water quality in the Sinos River regarding the presence of fecal coliforms, since these values were above the maximum value (4000 NMP/100mL) recommended by CONAMA Resolution No. 357/2005.
Figure 4 shows the behaviour of COD at the sampling sites investigated. On 8/18/2008, a high concentration of COD was observed at S01 and S02 (32 and 35 mg/L, respectively). However, the highest value (49 mg/L) was found at S03 on 5/26/2008.
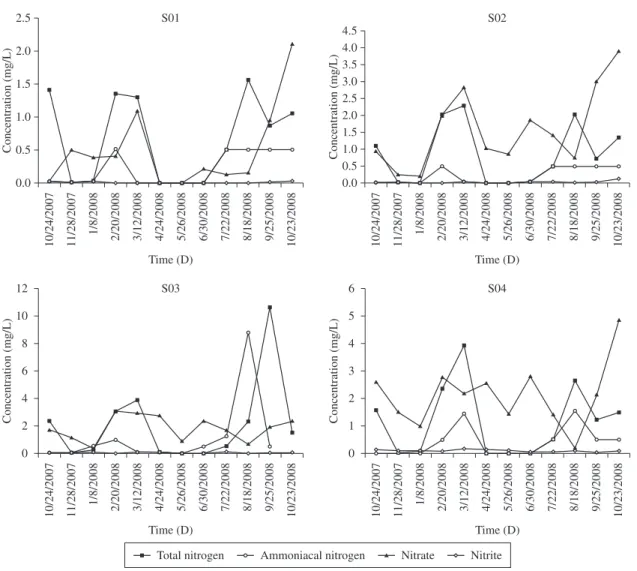
Regarding health aspects and organic pollution, water samples from the Sinos River were analysed for different nitrogen forms (total organic nitrogen, ammoniacal nitrogen, nitrite, and nitrate). Figure 5 shows the results for the nitrogen compounds investigated.
higher population density found at sampling sites 3 and 4 (approximately 500,000 inhabitants). Comparisons with water samples collected at site 2 varied for each collection date: on 2/20/08 - highest concentration; on 11/28/07 - greater than S03; and on 8/18/08 - greater than S04. However, water samples from site 3 showed the highest BOD5 concentration (20 mg/L on 5/26/2008), indicating a critical contamination point due to the release of untreated sewage. The values obtained at this sampling site (S03) exceeded the maximum value of 10 mg/L for a class III river set out by Resolution No. 357/2005 of the Brazilian National Environmental Council (CONAMA).
Figure 3 shows the results for fecal coliform analysis. The presence of fecal coliforms in water indicates contamination either by fecal material of warm-blooded animals or sewage. Fecal coliform content was found at all sampling sites analysed.
It is worth noting the high concentration of fecal coliforms at sampling site 3, which indicates high contamination levels. This fact can be explained by increased urbanization and lack of infrastructure observed in this region. At this site (S03), sewage is discharged without treatment. The results of statistical tests applied to the data obtained for fecal coliform monitoring are shown in Table 2.
Table 2. Results of statistical tests applied to the data obtained for fecal coliform monitoring.
Site n Mean (nmp/100 mL) Maximum Minimum Deviation Significant differences*
S01 12 1.0 × 10³ 4.8 × 10³ 3.0 × 101 513 <S03
S02 12 5. × 103 1.9 × 10⁴ 9.7 × 10² 1340 <S03
S03 12 4.5 × 10⁴ 1.9 × 10⁵ 7.8 × 10³ 1897 >S01 and >S02
S04 12 9.4 × 10³ 4.1 × 10⁴ 1.0 × 10³ 3295 no
* Significant differences for greater (>) or less (<) in the mean results at the site analysed.
Nitrite values at the monitored sites were lower than those recommended by CONAMA Resolution No. 357/2005, which is 1 mg/L for a class III river. This value is also outlined in the Decree No. 518/2004 of the Brazilian Ministry of Health. The highest nitrate concentration observed was 4.85 mg/L at S04 on 10/23/2008, which is below the threshold level of 10 mg/L for a class III river established by CONAMA Resolution No. 357/2005. Water samples from S03 showed the highest values for ammoniacal nitrogen and total nitrogen (8.8 mg/L on 08/18/2008, and 10.7 mg/L on 9/25/2008, respectively). The pH value of water samples collected at S03 on the latter date was 7.2, and ammoniacal nitrogen concentration did not exceed the maximum level of 13.3 mg/L for a class III river recommended by CONAMA Resolution No. 357/2005. It is noteworthy that, according to Decree No. 518/2004 of the Brazilian Ministry of Health, the maximum value recommended is 1.5 mg/L.
Figure 4. Profile of chemical oxygen demand (COD) at the sampling sites investigated in the Sinos River-RS (S01, S02, S03 and S04).
untreated sewage release and fertiliser use in agricultural activities in the basin.
Figure 8 shows the variation in total dissolved solids (TDS). This variable is related to terrestrial ecosystems, especially the type of land used, agricultural activities and weather conditions. Samples collected on 8/18/08 showed a significant increase in TDS concentration at all sampling sites, which may be due to the heavy rainfall that occurred the day before the collection and dragged solid materials into the basin (Macedo, 2009).
Figure 9 shows the results for the conductivity parameter. Conductivity values at S03 were much higher than those found at the other sampling sites on 5/26/2008 and 9/25/2008. On 8/18/08, however, at S03 conductivity values were lower than those observed at the collections described above. This variation was due to rainfall during the collections, since conductivity is inversely proportional to rainfall.
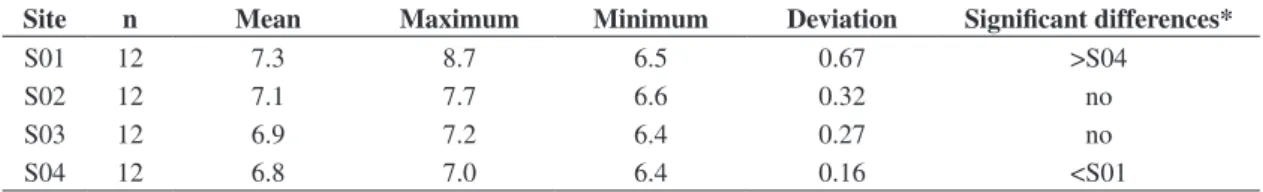
Table 3 describes the results of statistical tests and descriptive analysis applied to the data obtained for pH monitoring.
Figure 6 shows the temporal variation of dissolved oxygen (DO) concentrations in the sampling sites analysed. DO concentration decreased downstream, and its high concentration at S01 can be explained by the presence of steep slopes and waterfalls, typical flow of rapids, and rocky bed in the source of the river. These conditions cause great water turbulence, increasing air-water oxygen exchange. Although there was a reduction in DO concentration at S02, the levels always remained above 5.0 mg/L. At this site, human activities, such as agriculture, livestock and the release of raw sewage, are likely to cause a fall in the concentration of this parameter. DO levels decreased significantly at S03, a site located in the lower reaches of the Sinos River, where the slopes are quite gentle. DO values were below 2.0 mg/L at S03 only in the water samples collected on 5/26/08. The period before this collection date was characterised by excessive and abnormal flow, reaching a maximum flow of 1358 m³/s, which is really above the second highest flow recorded in the year (335 m³/s) and even higher than the yearly average flow of 98 m³/s (Macedo, 2009). According to the U.S. Environmental Protection Agency (EPA), low DO values can lead to fish disappearance from a body of water, since these organisms are extremely sensitive to the decrease of DO in their environment. CONAMA Resolution No. 357/2005 states that DO values should be higher than 4 mg/L. Therefore, our results indicate a potential oxygen deficit at S03 and S04, which can be attributed to the discharge of high loads of untreated (urban and industrial) sewage. These results also highlight the importance of implementing urgent measures to reduce this impact.
Figure 7 shows the variation in total phosphorus concentration throughout the monitoring period. Total phosphorus at S03 on 9/25/2008 was 1.1 mg/L, which is higher than the value of 0.15 mg/L recommended by CONAMA Resolution No. 357/2005. This fact is associated with untreated sewage and metallurgical effluent discharged at this site. The high concentration of total phosphorus found in the river indicates poor water quality, resulting from
Figure 6. Temporal variation in dissolved oxygen (mg/L) of water samples from the Sinos River-RS.
Figure 7. Spatial variation in total phosphorus of water samples from the Sinos River-RS.
rankings for CONAMA Resolution No. 357/2005 and class IV river, with 17% of fecal coliforms and 17% of total phosphorus. At S02, coliform content reached 67% and total phosphorus reached 25%, parameters to which the reduced water quality observed at this site could be attributed. Water samples from S03 showed 100% of fecal coliforms, 84% of phosphate and 16% of DO, exhibiting the worst profile among all sites analyzed. S04 had the highest frequency of occurrence in class IV river, total ANOVA revealed the existence of differences in mean
pH results between the sampling sites analysed, and post hoc tests indicated that the average difference occurred between S01 and S04. The variation in mean pH between S01 and S04 was of 0.5 units (7.3-6.8). These results can be attributed to several environmental factors, such as the release of industrial effluents and domestic sewage along the river course. Maximum values showed a slightly wider variation of 1.7 units from S01 (8.7) to S04 (7.0). Nevertheless, in all water samples from all sampling sites, maximum pH values (8.7-7.0) observed along the Sinos River are in accordance with the values set out by CONAMA Resolution No. 357/2005, between 6.0 and 9.5 for water intended for human and animal consumption.
Figure 10 shows increased turbidity values in water samples collected on days 8/18/2008 and 10/23/08 at S01. These dates correspond to those rainy days that showed a much higher river flow than that found on other sampling dates. Turbidity values for all sampling sites were below 100 UNT, the threshold value recommended by CONAMA Resolution No. 357/2005.
Chloride concentrations at all investigated sites showed values below 250 mg/L, in accordance with the maximum values recommended by CONAMA Resolution No. 357/2005 and the Brazilian Ministry of Health for water intended for human consumption (Figure 11).
S01 was chosen as a reference point for Sinos River natural water quality due to its close proximity to the source. Therefore, the observed sampling results established
Table 3. Results of statistical tests applied to the data obtained for pH monitoring.
Site n Mean Maximum Minimum Deviation Significant differences*
S01 12 7.3 8.7 6.5 0.67 >S04
S02 12 7.1 7.7 6.6 0.32 no
S03 12 6.9 7.2 6.4 0.27 no
S04 12 6.8 7.0 6.4 0.16 <S01
* Significant differences for greater (>) or less (<) in the mean results at the site analysed.
Figure 9. Variation in electrical conductivity of water
samples from the Sinos River-RS. Figure 10. from the Sinos River-RS.Variation in turbidity (NTU) of water samples
quality in the Sinos River basin (COMITESINOS, 2010). Table 5 describes statistical tests and descriptive analysis applied to the results of WQI monitoring. According to Table 5, sampling site 1 showed water quality between good and average, whereas the other sites scored between average and poor.
Comparing mean WQI scores from the four sites assessed, significant differences were observed between sites: the highest mean WQI score was observed at S01; average WQI score was higher at S02 than at S03 and S04, whereas WQI scores at S03 and S04 were not statistically different.
These results suggest that the environmental impact observed in the Sinos River is caused by untreated sewage from the tannery, metallurgical and timber industry in the region, posing a severe environmental hazard in this area. It is well known that water pollution represents a relevant environmental hazard, resulting in serious public health issues as well as aquatic ecosystem problems. Sinos River water is contaminated with pollutants related to two major environmental impacts: domestic sewage and untreated urban discharges. These results are consistent with the study by Amaral (2006), Jacociunas (2010), Lemos (2009) and Pereira (2007).
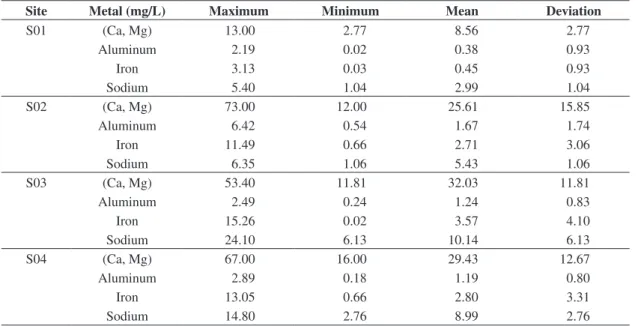
phosphorus reached 84% and total coliform content reached 68%. Maximum values for lead, chromium, copper, nickel, and zinc, at all sampling sites, were 0.01 mg/L, which did not exceed the limits set out by CONAMA Resolution No. 357/2005 for a class III river and Decree No. 518/2004 of the Brazilian Ministry of Health. Table 4 describes the results of statistical tests concerning hardness (Ca, Mg), aluminum, iron, and sodium. The maximum average value for iron was 3.57 mg/L at S03; according to CONAMA Resolution No. 357/2005 the maximum value recommended is 5 mg/L. Decree No. 518/2004 of the Brazilian Ministry of Health recommends a maximum aluminum level of 0.30 mg/L for drinking water, and the maximum average value found for aluminum was 32.03 mg/L at S03. This value is also above the limits (0.2 mg/L) recommended by CONAMA Resolution No. 357/2005. Such a high mean value may be associated with the discharge of high loads of effluents at this site.
The water quality index (WQI) is expressed as a numerical value, in which water samples are assigned a score from zero (0) to one hundred (100) concerning water quality conditions in a river: excellent (90-100); good (70-90); average (50-70); poor (25-50); and very poor (0-25). Since this index provides a simple and systematic measurement, it has been widely used for monitoring water
Table 4. Results of statistical tests applied to metal concentration.
Site Metal (mg/L) Maximum Minimum Mean Deviation
S01 (Ca, Mg) 13.00 2.77 8.56 2.77
Aluminum 2.19 0.02 0.38 0.93
Iron 3.13 0.03 0.45 0.93
Sodium 5.40 1.04 2.99 1.04
S02 (Ca, Mg) 73.00 12.00 25.61 15.85
Aluminum 6.42 0.54 1.67 1.74
Iron 11.49 0.66 2.71 3.06
Sodium 6.35 1.06 5.43 1.06
S03 (Ca, Mg) 53.40 11.81 32.03 11.81
Aluminum 2.49 0.24 1.24 0.83
Iron 15.26 0.02 3.57 4.10
Sodium 24.10 6.13 10.14 6.13
S04 (Ca, Mg) 67.00 16.00 29.43 12.67
Aluminum 2.89 0.18 1.19 0.80
Iron 13.05 0.66 2.80 3.31
Sodium 14.80 2.76 8.99 2.76
Table 5. Results of statistical tests applied to the data obtained for water quality index (WQI) monitoring.
Site n Mean Maximum Minimum Deviation Significant differences*
S01 12 70.3 77.2 56.9 6.1 >S02, >S03; >S04
S02 12 59.6 67.2 45.3 5.1 >S03; >S04
S03 12 50.2 59.1 43.6 5.2 <S01; <S02
S04 12 50.3 59.0 34.1 6.4 <S01; <S02
DEMIRAKA, A., YILMAZB, F., LEVENT TUNAB, A. and OZDEMIRC, N., 2006. Heavy metals in water, sediment and tissues of Leuciscus cephalus from a stream in southwestern Turkey. Chemosphere, vol. 63, p. 1451-1458.
FRANSON, MAH. (Ed.), 1992. Standard Methods for the Examination of Water and Wastewate. Washington: American Public Health Association, American Water Works Association and Water Environment Federation.
Fundação Estadual de Proteção Ambiental Henrique Luiz Roessler - FEPAM, 2009. Available from: <http://www.fepam.rs.gov.br>. Access in: jan. 2010.
IORIS, AAR., HUNTER, C. and WALKER, S., 2008. The development and application of water management sustainability indicators in Brazil and Scotland. Journal of Environmental Management, vol. 88, p. 1190-1201.
JACOCIUNAS, LV., DIHL, RR., LEHMANN, M., REGULY, ML. and ANDRADE, HHR., 2010. Recombinagenic activity of water and sediment from Sinos River and Araçá and Garças Streams (Canoas, Brazil), in the Drosophila wing spot test. Science of the Total Environment, vol.408, p. 571-577.
LEMOS, AT., ROSA, DP., ROCHA, JAV. and VARGAS, VMF., 2009. Mutagenicity assessment in a river basin influenced by agricultural, urban and industrial sources. Ecotoxicology and Environmental Safety, vol. 72, p. 2058-2065.
LEMOS, CA., 2003. Qualidade da água de uma bacia hidrográfica inserida na reserva da biosfera da mata atlântica, Maquine, Rio Grande do Sul, Brasil. Porto Alegre: Universidade Federal do Rio Grande do Sul, 104 p. [Dissertação de Mestrado].
LOPES TIBURTIUS, ER. and PERALTA-ZAMORA, P., 2004. Contaminação de águas por BTXS e processos utilizados na remediação de sítios contaminados. Quimica Nova, vol. 27, no..
3, p. 441-446.
MACEDO, JC., 2009. Monitoramento da qualidade das Águas do Rio dos Sinos. Novo Hamburgo: Centro Universitário Feevale, 184 p. [Dissertação de Mestrado].
MARGALEF, R., 1991. Teoria de los sistemas ecologicos. 2ª ed. Barcelona: Universitat de Barcelona, 290 p.
MATZENAUER, HB., 2003. Uma metodologia multicritério construtivista de avaliação de alternativas para o planejamento de recursos hídricos de bacias hidrográficas, V.I. Porto Alegre: Universidade Federal do Rio Grande do Sul, 669 p. [Tese de Doutorado].
PEREIRA, D. and MANSUR, MCD., 2006. Bivalves límnicos da bacia do rio dos Sinos, Rio Grande do Sul, Brasil (Bivalvia, Unionoida, Veneroida e Mytiloida). Revista Brasileira de Zoologia, vol. 23, no. 4, p. 1123-1147.
PEREIRA, TS., ROCHA, JAV., DUCCATTI, A., SILVEIRA, GA., PASTORIZA, TF., BRINGUENTI, L. and VARGAS, VMF., 2007. Evaluation of mutagenic activity in supply water at three sites in the state of Rio Grande do Sul, Brazil. Mutation Research, vol. 629, p. 71-80.
TUNDISI, JG., 2003. Recursos hídricos. MultiCiência, vol. 1, p. 1-15.
VILLELA, IV., OLIVEIRA, IM., SILVEIRA, JC., DIAS, JF., HENRIQUES, JA. and SILVA, J., 2007. Assessment of environmental stress by the micronucleus and comet assays on Limnoperna fortunei exposed to Guaıba hydrographic region samples (Brazil) under laboratory conditions. Mutation Research, vol. 628, p. 76-86.
4. Conclusions
The behaviour of water parameters in the Sinos River revealed a higher degree of deterioration in water samples from sites closer to the outfalls of the basin, mainly due to the significant influence of human activity in this area. The water quality index of the Sinos River indicated that the reduction in water quality is associated with water pollution by untreated domestic sewage. High levels of fecal coliforms reflect the large deficit in sanitation in the basin, especially in the middle and lower reaches of the Sinos River. This observation also reflects the lack of public sewage treatment systems, which is usually released at the source and discharged into streams that, in turn, discharge their waters into the main river basin without treatment.
DO concentration was highlighted concerning poor water quality in the lower reaches of the river, with the highest deficit rates at S03 and S04, setting grounds for extinction of most aerobic aquatic life at these sites. Low DO levels occurred during periods of low river flow, exhibiting a lower supply/demand oxygen capacity during the spring. Another factor related to DO reduction in the dry season concerns its ability to reduce dilution in the water input to the tributaries and low DO concentrations because of untreated sewage.
The low concentration of certain metals in surface water suggests low levels of contamination with heavy metals. However, further investigation is warranted to evaluate contamination of water by metals in deeper waters and sediments.
Based on the present results, we concluded that the sampling site 1 (S01), commonly used as a white point, should no longer be used as a reference point in future studies.
Water quality improvement in the Sinos River requires several actions, including urban planning with environmental preservation goals. The implementation of sewage collection, transport and treatment systems, focusing on urban areas located in the lower reaches of the Sinos River, is an extremely important measure for the preservation of this water resource.
Acknowledgements – This work was financially supported by Fapergs, CNPq and Capes.
References
AMARAL, VS., SINIGAGLIA, M., REGULY, ML. and ANDRADE, HHR., 2006. Genetic toxicity in surface water from Guaıba Hydrographic Region under the influence of industrial, urban and agricultural sewage in the Drosophila Wing-Spot Test.
Environmental Pollution, vol. 139, p. 469-476.
CHAVES, EMB., 2004., Tomada de decisão e otimização no planejamento com múltiplos objetivos em unidades de gerenciamento- bacia do rio dos sinos (Rio Grande do Sul). Porto Alegre: Universidade Federal do Rio Grande do Sul, 193 p. [Tese de doutorado].