Emission Tomography
Zizhong Li1*, Youwen Xu1, Don Warner1, Nora D. Volkow2,3
1Medical Department, Brookhaven National Laboratory, Upton, New York, United States of America,2National Institute on Alcohol Abuse and Alcoholism, Bethesda, Maryland, United States of America,3National Institute on Drug Abuse, Bethesda, Maryland, United States of America
Abstract
Background and Purpose:The sensitivity to the intoxicating effects of alcohol as well as its adverse medical consequences differ markedly among individuals, which reflects in part differences in alcohol’s absorption, distribution, metabolism, and elimination (ADME) properties. The ADME of alcohol in the body and its relationship with alcohol’s brain bioavailability, however, is not well understood.
Experimental Approach:The ADME of C-11 labeled alcohol, CH311CH2OH,1and C-11 and deuterium dual labeled alcohol,
CH311CD2OH,2in baboons was compared based on the principle that C–D bond is stronger than C–H bond, thus the
reaction is slower if C–D bond breaking occurs in a rate-determining metabolic step. The following ADME parameters in peripheral organs and brain were derived from time activity curve (TAC) of positron emission tomography (PET) scans: peak uptake (Cmax); peak uptake time (Tmax), half-life of peak uptake (T1/2), the area under the curve (AUC60min), and the residue
uptake (C60min).
Key Results:For1the highest uptake occurred in the kidney whereas for2it occurred in the liver. A deuterium isotope effect was observed in the kidneys in both animals studied and in the liver of one animal but not the other. The highest uptake for1and2in the brain was in striatum and cerebellum but2had higher uptake than1in all brain regions most evidently in thalamus and cingulate. Alcohol’s brain uptake was significantly higher when given intravenously than when given orally and also when the animal was pretreated with a pharmacological dose of alcohol.
Conclusion and Implications:The study shows that alcohol metabolism in peripheral organs had a large effect on alcohol’s brain bioavailability. This study sets the stage for clinical investigation on how genetics, gender and alcohol abuse affect alcohol’s ADME and its relationship to intoxication and medical consequences.
Citation:Li Z, Xu Y, Warner D, Volkow ND (2012) Alcohol ADME in Primates Studied with Positron Emission Tomography. PLoS ONE 7(10): e46676. doi:10.1371/ journal.pone.0046676
Editor:Martin W. Brechbiel, National Institute of Health, United States of America
ReceivedJune 3, 2012;AcceptedSeptember 3, 2012;PublishedOctober 1, 2012
This is an open-access article, free of all copyright, and may be freely reproduced, distributed, transmitted, modified, built upon, or otherwise used by anyone for any lawful purpose. The work is made available under the Creative Commons CC0 public domain dedication.
Funding:ZL was supported by a grant from Brookhaven National Laboratory (LDRD#03-103)and he is the author of a grant from National Institute on Alcoholism and Alcohol Abuse (5R21AA014018-03). This research was also funded by United States Department of Energy (DE-AC02-98CH1-886) and National Institutes of Health (Intramural Research Program of the National Institute on Alcoholism and Alcohol Abuse). The funders had no role in study design, data collection and analysis, decision to publish, or preparation of the manuscript.
Competing Interests:The authors have declared that no competing interests exist.
* E-mail: [email protected]
Introduction
The evaluation of alcohol’s ADME in intact animals is complicated by the fact that alcohol and its major metabolites: acetaldehyde, acetate, and carbon dioxide, are small and rapidly diffusible molecules that can penetrate cellular membranes and diffuse within the water volume of the body. In addition, no high affinity non-covalent ethanol binding sites have yet been found. As a result, the binding and bio-distribution assays with radiolabeled ligands that are routinely used in pharmacology research are not suitable for studies of alcohol’s ADME.
Enzymatic oxidation of ethanol to acetaldehyde and then to acetic acid is the major ethanol metabolic pathwayin vivo. Clinical studies suggest that organ damage from excessive alcohol consumption is at least partially related to alcohol metabolic products [1,2]. Slower acetaldehyde metabolism in Asian popu-lations is responsible for their lower lifetime prevalence of alcohol
abuse disorders than in other ethnic groups [3,4], but it is also responsible for the significantly higher risk of digestive tract cancers among heavy drinkers [5,6,7]. Greater brain atrophy [8] and liver and cardiac damage among women alcoholics than among men might be attributed to gender differences in metabolism of alcohol [9,10,11,12]. Similarly differences between men and women in the sensitivity to alcohol’s behavioral and central neurological effects are likely to reflect in part differences in alcohol’s metabolism by peripheral tissues [8,13]. Metabolism of alcohol in the brain may also modulate its behavioral effects as shown in rats that the oxidation of alcohol to acetaldehyde by catalases in the Ventral Tegmental Area (VTA) was reported to be essential for alcohol’s rewarding effects [14].
transformation data of ethanol in isolated liver [18], lung [19], kidney [20], and brain [21,22,23] have been reported. There are, however, few studies on alcohol’s whole body regional distribution and pharmacokinetics in intact primates. In cats, studies with carbon-11 labeled alcohol showed high levels of radioactivity in liver, heart and head, which presumably reflected the accumula-tion of alcohol or its metabolic products in these organs [24].
In humans, the brain imaging studies with magnetic resonance spectroscopy (MRS) showed that ethanol’s concentration in the brain plateaus at around 35 min after oral administration of pharmacological doses of ethanol [25]. A brain imaging study with positron emission tomography (PET) and O-15 water (marker of blood flow) and C-11 ethanol suggested that ethanol’s distribution in brain was in part mediated by interactions with GABA and/or NMDA receptors [26]. Glutamate, voltage-gated calcium chan-nels, opioid, dopamine, serotonin, and acetylcholine receptors are affected by alcohol, but the interaction of ethanol with these receptors is believed to be transient and of low affinity apparently acting as a ‘‘molecular lubricant’’ that alters the protein function [27].
PET is a tool of choice to study drug distribution in human and experimental animals in real time. The combination of PET and deuterium kinetics isotope effect can be used to differentiate a drug’s biochemical mechanism in the organs of interest [28]. The deuterium isotope effect is based on the principle that the C–D bond is stronger than C–H bond, and the reaction will be slower if a C–D bond breaking is involved in a metabolic rate-determining step. The deuterium isotope effect has been used to determine the contribution of various ethanol oxidative metabolic pathways both
in vitro and in vivo[29,30]. Here we aimed to use C-11 labeled alcohol, 1and C-11 and deuterium dual labeled alcohol,2 as a pair of PET tracers to study alcohol ADME in the baboon including its metabolism within the various organs. We also evaluated the relationship between overall alcohol’s ADME in the various organs of the body and its bioavailability in the brain. Thus we hypothesize that, in the same subject, we would observe a significant isotope effect in the liver and the kidneys, which are the organs that metabolize alcohol but not in heart and lungs, which don’t metabolize alcohol. We do not expect to observe significant isotope effect in the brain due to its negligible contribution to the overall alcohol metabolism [31], however uptake pattern differ-ence of1and2in different brain region in the same subject could be indicative of isotope sensitive alcohol metabolism in brain.
Methods
The preparation of CH311CH2OH, 1 and CH311CD2OH, 2
Tracers 1 and 2 were prepared according to a modified literature procedure [32]. Briefly, 11CO2from a target that was trapped in a solution of methyl magnesium bromide (MeMgBr) in ether. The product was then reduced by lithium aluminum hydride or lithium aluminum deuteride, hydrolyzed by sodium hydroxide aqueous solution (5 N) to give the crude 1 or 2
respectively with [11C]methanol (3 to 7%) and [2-11C]isopropanol (5 to 30%) as the major radiochemical impurities. The reaction mixture was then subjected to HPLC purification using a self-packed fermentation column and water as elute and the purified product was formulated into an injectable saline solution. The radiochemical purity of C-11 ethanol was greater than 99% without detectable chemical and radio-chemical impurities in the solution.
Baboon Preparation
Baboon studies were approved by the Institutional Animal Care and Use Committee of Brookhaven National Laboratory and the baboons were housed and maintained in an accredited animal facility certified by the Association for Assessment of Laboratory Animal Care. Animals had free access to food, water and toys and were monitored during study by veterinary stuff. PET studies were performed on four female baboons (Papio Anubis). Baboons were anesthetized with an intramuscular injection of ketamine hydro-chloride (10 mg/kg), intubated, and for studies in which alcohol is administrated orally, a nasogastric tube was installed. The baboon was transported from animal facility to the PET laboratory by a certified veterinary nurse and maintained on a gaseous mixture of oxygen, nitrous oxide, and isoflurane throughout the imaging session. Catheters were placed in an antecubital vein for radiotracer injection and for plasma sampling for radioactive alcohol, acetaldehyde, and acetic acid quantification. EKG, blood pressure, O2saturation, and respiratory setting were continuously monitored throughout the study.
PET studies
PET scans were performed on a Siemens HR+high resolution, whole-body PET scanner (63 slices, 4.564.564.8 mm) in
3-dimensional acquisition mode. Before each scan, a transmission scan was obtained with a68Ge rotating rod source for attenuation correction. For brain imaging, the head of the baboon was positioned at the center of the field as defined by imbedded laser lines with help of a stereotactic head fixation device. The PET measurements were carried out according to the protocols described in Table 1. Data acquisition was started immediately after the injection. The images were summed from 0 min to 59 min for liver, heart and lungs, and from 0 min to 10 min for the brain. For the peripheral organs, circular regions of interests (ROIs) were drawn manually on the heart, lungs, liver and the kidneys on a summed image and projected onto dynamic images to derive TAC. For the brain circular ROI were obtained in the striatum, cerebellum, thalamus, occipital cortex, frontal cortex, temporal cortex, cingulate, global (whole brain), and the white matter. The average radioactivity in the ROIs from each organ was taken as the tracer uptake in that organ. The images were also reconstructed into dynamic images containing 27 continuous slices to derive TAC. The area under the curve of each organ was calculated by the trapezoidal method up to the termination of acquisition (60 min). The baboon had a radial arterial cannula in the wrist to permit continuous counting of blood radioactivity concentration with a bismuth germinate counter during the course of the experiment. Blood samples were also taken after the injection and the activity in the blood sample was counted in a NaI well counter to derive the plasma and the metabolites corrected plasma curves. The radioactive ethanol, aldehyde, and acetic acid were quantified with HPLC on a fermentation column. Acetate, acetaldehyde, and ethanol eluted at 8, 10 and 12 min (elute: 30 mM HCl, flow rate 0.5 mL/min) respectively.
Results
Peripheral organ uptake and the deuterium isotope effect
peripheral ADME analysis; instead, we presented results from the two baboons individually, April (BEJ129) and Missy (BEH131) in whom we obtained measurements for the liver, kidneys, lung, and the heart. The heart, lungs, liver, and the kidneys were easily identified from the summed PET images of1and2(Fig 1). Tracer
1 had the highest uptake in the kidney, tracer 2, on the other hand, had the highest uptake in the liver. The ADME of1and2
were quantitatively assessed with the following parameters (Table 2) derived from the TAC (Fig. 2a, 2b, 2c, 2d): peak uptake (Cmax); the time at which peak uptake was observed (Tmax); time at which peak uptake was reduced to half of its value (T1/2); area under the curve (AUC60min) and residual uptake (C60min) at end of the scan. Tracers 1and 2 had different liver uptake patterns in April and Missy (Fig. 2a): the radioactive C-11 from1had a lower peak uptake (Cmax= 0.048% ID . mL21) than that from 2 (Cmax= 0.055% ID . mL2
1
) in April (Table 2), whereas in Missy peak uptakes from 1 (Cmax= 0.036% ID . mL21) and 2 (Cmax= 0.030% ID . mL21) were similar. Both tracers had slow elimination rates (T1/2.50 min) from the liver. Tracer 1 had lower liver exposure (AUC60min= 1.92 min . % ID . mL2
1 ) than2
(AUC60min= 2.61 min . % ID . mL21) in April, whereas in Missy liver exposures were similar (AUC60min= 1.24 min . % ID . mL21 for1 vs 1.11 min . % ID . mL21
for2) and the liver exposures from both tracers were lower than that for April. Tracer1had a lower residue uptake (C60min= 0.026% ID . mL2
1
) than 2
(C60min= 0.038% ID . mL21) in April and a similar residue uptake (C60min= 0.018% ID . mL21for1and 0.016% ID . mL21 for 2) in Missy.
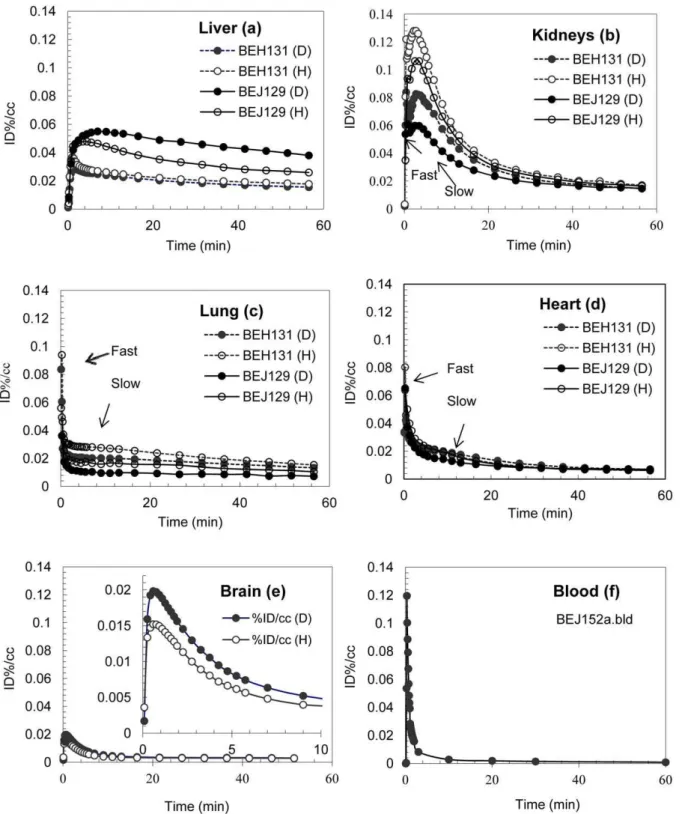
Tracers1and2had similar uptake patterns for April and Missy in the kidney, heart, and the lung (Fig. 2b, 2c, 2d). A faster uptake-elimination phase (Tmax= 0.08 to 0.75 min; T1/2= 0.3 to 1.8 min) was followed by a slower uptake-elimination phase for1and2in these organs for both baboons (Table 2). During the faster uptake-elimination phase, the alcohol simply perfused through the organ
along with the blood flow with minimal biochemical tissue interactions; we define this as the physical uptake-elimination phase. In the slower uptake-elimination phase, alcohol and its metabolites interact with tissues biochemically. Information from the alcohol’s metabolism can be derived from the slower uptake and elimination phase. Tracer 1 had higher uptake, faster elimination, and higher residue uptake than2 in the kidneys in each baboon. The elimination of both tracers from the heart was similar and in the lungs it was higher for2than1with T1/2from 20 to 32 min in lung and over 60 min in heart.
Alcohol brain uptake and deuterium isotope effect
To avoid intersubject variability, alcohol’s brain uptake were studied in the same baboon (Pearl) with tracers 1and 2. The metabolic effect on brain uptake was assess by observed deuterium
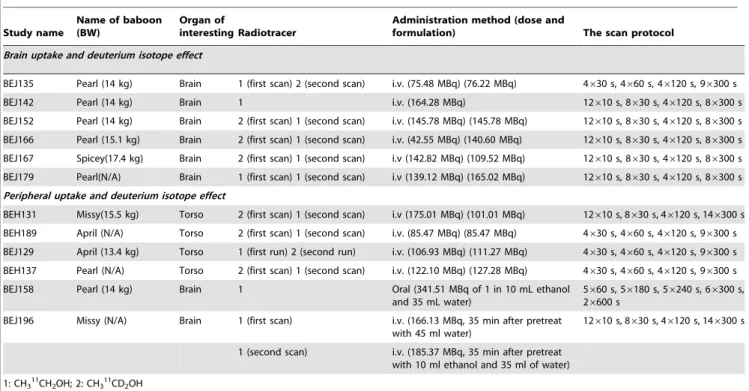
Table 1.Summary of Baboon PET studies.
Study name
Name of baboon (BW)
Organ of
interesting Radiotracer
Administration method (dose and
formulation) The scan protocol
Brain uptake and deuterium isotope effect
BEJ135 Pearl (14 kg) Brain 1 (first scan) 2 (second scan) i.v. (75.48 MBq) (76.22 MBq) 4630 s, 4660 s, 46120 s, 96300 s
BEJ142 Pearl (14 kg) Brain 1 i.v. (164.28 MBq) 12610 s, 8630 s, 46120 s, 86300 s
BEJ152 Pearl (14 kg) Brain 2 (first scan) 1 (second scan) i.v. (145.78 MBq) (145.78 MBq) 12610 s, 8630 s, 46120 s, 86300 s
BEJ166 Pearl (15.1 kg) Brain 2 (first scan) 1 (second scan) i.v. (42.55 MBq) (140.60 MBq) 12610 s, 8630 s, 46120 s, 86300 s
BEJ167 Spicey(17.4 kg) Brain 2 (first scan) 1 (second scan) i.v (142.82 MBq) (109.52 MBq) 12610 s, 8630 s, 46120 s, 86300 s
BEJ179 Pearl(N/A) Brain 1 (first scan) 1 (second scan) i.v (139.12 MBq) (165.02 MBq) 12610 s, 8630 s, 46120 s, 86300 s
Peripheral uptake and deuterium isotope effect
BEH131 Missy(15.5 kg) Torso 2 (first scan) 1 (second scan) i.v (175.01 MBq) (101.01 MBq) 12610 s, 8630 s, 46120 s, 146300 s
BEH189 April (N/A) Torso 2 (first scan) 1 (second scan) i.v. (85.47 MBq) (85.47 MBq) 4630 s, 4660 s, 46120 s, 96300 s
BEJ129 April (13.4 kg) Torso 1 (first run) 2 (second run) i.v. (106.93 MBq) (111.27 MBq) 4630 s, 4660 s, 46120 s, 96300 s
BEH137 Pearl (N/A) Torso 2 (first scan) 1 (second scan) i.v. (122.10 MBq) (127.28 MBq) 4630 s, 4660 s, 46120 s, 96300 s
BEJ158 Pearl (14 kg) Brain 1 Oral (341.51 MBq of 1 in 10 mL ethanol and 35 mL water)
5660 s, 56180 s, 56240 s, 66300 s, 26600 s
BEJ196 Missy (N/A) Brain 1 (first scan) i.v. (166.13 MBq, 35 min after pretreat with 45 ml water)
12610 s, 8630 s, 46120 s, 146300 s
1 (second scan) i.v. (185.37 MBq, 35 min after pretreat with 10 ml ethanol and 35 ml of water)
1: CH311CH2OH; 2: CH311CD2OH
doi:10.1371/journal.pone.0046676.t001
Figure 1. Summed images of tracer 1 (A, top) and tracer 2 (B, bottom) in lung, heart, liver and kidney (from 0 to 60 min) in baboon (April).Tracer 1 had the highest uptake in kidney; tracer 2, had the highest uptake in liver.
isotope effect. A total of nine studies were conducted, six with1
and three with 2. Alcohol was distributed in most of the brain regions, but showed higher concentration in striatum (Cmax= 0.028% ID . mL21) and cerebellum (Cmax= 0.026% ID . mL21
) for 1 and in striatum (Cmax= 0.034% ID . mL21), cingulate (Cmax= 0.033% ID . mL21), cerebellum (Cmax= 0.031% ID . mL21
), and thalamus (Cmax= 0.030% ID . mL21) for 2 (Fig 3).
The Cmax ratio of brain to blood obtained during the first 3 minutes is 0.13 for 1 and 0.18 for2. Tracer2 had consistently higher peak uptake (Cmax) than 1 in all brain regions studied (Fig 4). The Cmaxratio for the peak uptake of2to1was highest in thalamus (Cmax(2)/Cmax(1) = 1.38) and cingulate (Cmax(2)/ Cmax(1) = 1.34) and lowest in frontal cortex (Cmax(2)/ Cmax(1) = 1.10) (Fig S1).
Figure 2. Time activity curves in liver (TAC) (a); kidney (b); lung (c); heart (d) in baboons (April: BEJ129 and Missy: BEH131) and Brain (e) and blood (f) in baboon (Pearl: BEJ152a) of tracers 1 (H) and 2 (D).
Table 2.Pharmacokinetics assessment of alcohol afterivadministration to baboon.
Organ Study tracer Cmax(% ID . mL21) Tmax(min) T1/2(min)
AUC60min min . % ID . mL21
C60min % ID . mL21
liver BEJ129 1 0.048 0.055 0.036 0.030 3.00 7.00 1.25 1.25 .60.60 52.0 52.0 1.92 0.0260
2 2.61 0.0380
BEH131 1 1.24 0.0180
2 1.11 0.0160
faster slower faster Slower Faster slower
kidney BEJ129 1 0.094 0.110 0.75 3.00 ND 11.0 1.62 0.0164
2 0.061 0.060 0.75 3.00 ND 14.0 1.05 0.0146
BEH131 1 0.122 0.128 0.42 2.50 ND 11.0 2.35 0.0134
2 0.084 0.083 0.42 2.75 ND 14.0 1.81 0.0109
heart BEJ129 1 0.065 ,0.021 0.25 ,6 1.80 ,20 0.69 0.0060
2 0.065 ,0.015 0.25 ,6 1.00 ,32 0.60 0.0070
BEH131 1 0.080 ,0.021 0.25 ,6 0.50 ,25 0.67 0.0060
2 0.064 ,0.021 0.25 ,6 1.20 ,28 0.74 0.0070
lung BEJ129 1 0.049 0.018 0.25 ,6 0.75 .60 0.82 0.0105
2 0.036 0.011 0.25 ,7 0.75 .60 0.52 0.0073
BEH131 1 0.094 0.029 0.25 ,5 0.42 .60 1.27 0.0154
2 0.084 0.021 0.08 ,5 0.30 .60 1.00 0.0134
brain BEJ152 1 0.015 0.020 0.60 0.60 4.00 4.00 0.23 0.0029
2 0.27 0.0030
blood BEJ152 1 0.118 0.118 0.42 0.42 0.75 0.75 0.21 0.0040
2 0.25 0.0005
brain BEJ158 1 0.038 0.42 2.50 0.31 0.0032
brain BEJ196 1 Brain uptake plateaued at ca. 15 min 0.12 0.0027
Cmax, peak uptake; Tmax, time at which peak uptake was observed; T1/2, time at which uptake reduced to half of its peak value; AUC60min: area under time activity curve from 0 to 60 min; C60min residue uptake at end of scan
doi:10.1371/journal.pone.0046676.t002
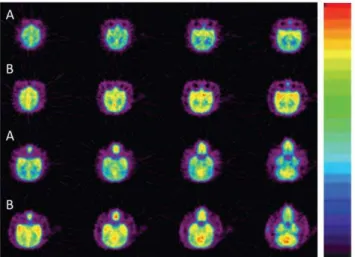
Figure 3. Summed images of tracers 1 (A) and 2 (B) in the brain of Pearl (from 0 to 10 min), alcohol distributed in all brain regions.Tracer 1 showed higher uptake in striatum and cerebellum; and tracer 2 in striatum, thalamus, cerebellum, and cingulate. Tracer 2 had consistently higher uptake than 1 across all brain regions. doi:10.1371/journal.pone.0046676.g003
Figure 4. Brain uptake (Cmax) of tracers 1 (H) and 2 (D) in
baboon (Pear) in different brain region. STR: Striatum; CB: Cerebellum; THL: Thalamus; OCC: Occipital cortex; FRT: Frontal cortex; TEMP: Temporal cortex; CING: Cingulate gyrus; GL: Global; WM: White matter. Tracer 2 shows consistent higher uptake than 1 in all brain regions.
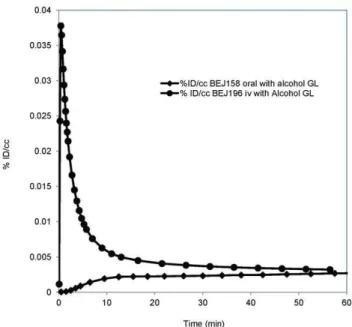
To further study the effect of metabolism on alcohol’s brain uptake we conducted a pair of sequential studies in the same baboon (Missy) with 1 (BEJ196): the first scan after pretreatment with water (45 ml), and the second one, 35 minutes after pretreatment with a pharmacological relevant dose (5.6 g/kg) of alcohol (22% alcohol by volume (ABV), 45 mL). Pretreatment with alcohol significantly increased the brain uptake of alcohol in all brain regions (Fig 5). To evaluate the effect of the first pass metabolism and intestine permeability on alcohol brain uptake, a pharmacological relevant dose of alcohol spiked with 1 (341.51 MBq) was administered to Pearl (BEJ158) orally, the brain alcohol uptake plateaued at approximately 15 min in all brain regions and remained at that level throughout the 60 minutes of the study (Fig 6). The study BEJ158 (oral 1 in a pharmacological dose of alcohol) was compared with the BEJ196 second scan (intravenous 1 after an oral pharmacological dose of alcohol) (Fig 6), and 1 was found to have a much higher brain exposure and peak uptake afterivthan after oral administration. However at 50 minutes the brain concentration of alcohol was similar forivand oral administration.
Discussion and Conclusions
Ethanol is metabolized to acetaldehyde in the body through three major pathways: (1) an alcohol dehydrogenase (ADH) pathway, which accounts for over 85% of ethanol’s oxidation and has a deuterium isotope effect of 3 and is pH (pH = 7) and coenzyme dependent (coenzyme NAD+) [35], ADH pathway is reversible in vivo and a reversible-ADH pathway converts acetaldehyde back to alcohol and causes the hydrogen for deuterium exchange (CH3CD2OH to CH3CHDOH and CH3CDHOH to CH3CH2OH) eliminating the deuterium isotope effect [29]; (2) catalase pathway, which eliminates about 2% ethanol and has a deuterium isotope effect of 1.9 determined from rat and ox liver catalase [36,37]; and (3) the microsomal ethanol-oxidizing system (MEOS) is a minor metabolic pathway in healthy humans, but in alcoholics it can account for up to 10% [38] of ethanol’s elimination in the liver and has a deuterium isotope effect from 3.6 to 5.2 [39]. Acetaldehyde is then oxidized to acetate by acetaldehyde dehydrogenase (ALDH) and it has a deuterium isotope effect of 2.8 [40].
The liver is by far the most important organ for ethanol’s elimination and it contains almost all the ethanol metabolic enzymes. In healthy animals or humans, hepatic alcohol metabolism is responsible for over 95% of ethanol’s oxidation. Individual genetic makeup and environmental condition could alter the contribution of individual metabolism pathways to the overall alcohol metabolism [41]. The two baboons in whom we studied, the liver differed in their metabolism of 1 and 2 as evidenced by their liver TAC profiles (Fig 2a), which represent hepatic uptake and elimination kinetics for all C-11 labeled species derived from C-11 labeled alcohol including C-11 labeled alcohol, acetaldehyde, acetate, carbon dioxide, and higher molecular metabolites. The hepatic TAC profiles for1and2were different in April (higher for2than1), but similar in Missy. The liver TAC patterns for1and 2could be used as a biomarker to assess the contributions from different alcohol metabolism pathways to overall hepatic alcohol metabolism, the reliability of such marker would have to be confirmed by enzyme inhibition and in a larger sample size.
Studies done inex-vivoisolated renal tissue (cortex and tubules) from baboons showed that the reversible ADH pathway is present in the kidney. In the kidney, acetaldehyde can be metabolized at a high rate and in a dose dependent manner and converted to ethanol, acetate and carbon dioxide; at acetaldehyde concentra-tion from 1 mM to 20 mM the major product is acetate and at higher acetaldehyde concentration the major product is ethanol [20,42]. Our PET images show that in the kidneys ethanol’s metabolism mainly took place in the cortex (Fig 1). The activity derived from1was eliminated consistently faster (T1/2= 11 min) than 2 (T1/2= 14 min) in both baboons (Table 2), this isotope effect may indicate the contribution of oxidation of acetaldehyde (CH3CHO from1 or CH3CDO from2) to acetate. The slower elimination of 2 than 1 in both baboons may suggest the transformation of acetaldehyde into acetate in the kidneys, which Figure 5. Brain uptake (Cmax) of tracer 1 in baboon (Missy) in
different brain region.STR: Striatum; CB: Cerebellum; THL: Thalamus; OCC: Occipital cortex; FRT: Frontal cortex; TEMP: Temporal cortex; CING: Cingulate gyrus; GL: Global; WM: White matter. When baboon was pretreated with water (45 ml) or alcohol (22% ABV, 45 ml).
doi:10.1371/journal.pone.0046676.g005
Figure 6. Time activity curves for the global brain uptake when tracer 1 was administered iv 35 min after baboon was pretreated with alcohol (22% ABV, 45 ml), and when tracer 1 was administered orally with alcohol (22% ABV, 45 ml). The brain exposure (AUC60min) was much higher when tracer 1 was administered iv. GL: Global
is supported by the well-recognized role that kidneys have in the detoxification of alcohol from the body [20].
Studies on lung slices from rats and dogs showed that alcohol dehydrogenase in pulmonary tissue can metabolize ethanol in a bicarbonate buffer by sulfoconjugation [19,43] but in human this is likely to be limited by the substrate availability. In the slower uptake elimination phase, the time-activity-curve reached a steady state in the lungs, which could be attributed to11CO2elimination. The expiration of11CO2from ethanol showed that it reached a steady state shortly after intravenous injection [44]. The overall slower metabolism of 2 would therefore result in a lower blood concentration of11CO2, and less carbon-11 exchange in the lungs through 11CO2 expiration, which would account for the lower residual activity (C60min) for2than for1(Table 2).
Like the lungs, the heart is not directly involved in oxidative metabolism of ethanol. The overall heart exposure (AUC60min) and heart residue uptake (C60min) for tracers1and2was similar for both baboons (Table 2). Ethanol in the heart can be converted into fatty acid ethyl ester (FAEE) by FAEE synthase enzyme, which is detrimental to heart muscles [45]. No carbon-hydrogen bond is broken or made in this process, thus the deuterium isotope effect is not expected.
Metabolism of ethanol in the peripheral organs has a significant impact on the uptake of alcohol by the brain. The up-to-date consensus has been that the acetaldehyde that is peripherally derived does not penetrate the blood brain barrier in any significant amount [1]. The uptake of acetate by the brain is low [46] but it increases during alcohol intoxication (Volkow et al unpublished). Thus the radioactivity in the brain for both tracers most likely reflected ethanol’s brain uptake with some contribution from acetate particularly when given concomitantly with phar-macological doses of alcohol. The slower metabolism of2resulted in a higher plasma alcohol concentration, which would account for its higher brain peak uptake (Fig 4). When the baboon was pretreated with a pharmacological dose of alcohol, the alcohol metabolizing enzymes (ie ADH and catalase) may have been saturated resulting in the elevated tracer (1) blood concentrations and higher brain uptake of 1 than when pretreated with water. However, the higher blood flow [47] and the higher acetate concentration in plasma under the influence of alcohol (Volkow et al unpublished) may have also contributed to the initial higher brain uptake of1. This added to our findings of much lower brain uptake after oral alcohol administration, which exposes alcohol to the first pass hepatic metabolism, than after intravenous admin-istration, and the higher brain uptake for 2, which has lower peripheral metabolism than 1, provides further evidence that peripheral metabolism of alcohol influences the uptake of alcohol in the brain. To the extent that there are significant differences in the rate of alcohol metabolism between individuals, including greater metabolism in alcoholics than controls and greater metabolism in males than females [48]. This would contribute to the differences in the sensitivity to alcohol’s psychoactive effects.
Alcohol distributed throughout the brain but there was a greater uptake and accumulation in the cerebellum and striatum for both tracers but also higher uptake in cingulate and thalamus for 2
(Fig 3). This is consistent with prior studies in the rodent brain that showed the highest alcohol concentration in the striatum [49] and with a prior PET study in cymologous monkeys that reported higher [C-11]ethanol uptake in subcortical brain regions [50]. The higher uptake in striatum would underlie its rewarding effects, which are mediated in part by its effects in ventral striatum [51,52]. On the other hand the high accumulation of alcohol or its metabolites in the cerebellum is consistent with findings that the cerebellum is particularly sensitive to the decreases in brain
glucose metabolism after acute alcohol administration [53] and could underlie the motor incoordination observed during intox-ication [54].
The peak uptake (Cmax) ratio of brain to blood is 0.13 for1and 0.18 for 2, which occurs within the first 3 minutes after its administration most likely reflects the high concentration of alcohol in blood (Fig S2). However after 3 minutes the blood to brain ratio reaches 1 and then slowly decreases, which is consistent with our findings from MRS in humans showing blood to brain ratios for alcohol around 1 or lower [25]. Pharmacokinetic studies of alcohol in the rat brain after an intraperitoneal injection showed that its uptake in the first 5–10 minutes reflects primarily absorption after which it reflects a combination of absorption, metabolism, elimination and water/fat equilibration [55]. Our findings of a Cmaxratio of brain to blood obtained during the first 3 minutes of 0.13 for1and 0.18 for2and its rapid equilibration to brain to blood ratios of 1 are also consistent with its uptake initially being driven by its absorption and subsequently driven by a combination of absorption, metabolism and clearance.
The first pass alcohol metabolism has a significant impact on the alcohol blood concentration [56]. Our PET data shows that the area under the curve (AUC60min) after intravenous administration is significantly higher than that after oral administration (Table 2, BEJ158 and BEJ196) (Fig 6) indicating that gastric absorption and the first pass alcohol metabolism significantly reduces alcohol overall brain’s exposure and delays its arrival to the brain.
Limitation from our studies includes the fact that PET measures the overall concentration of C-11 activity within the tissue but cannot distinguish between alcohol and its metabolites. Also because of the complexity and high cost of the studies, only a small group of animals were used in the measurments that precludes us from addressing the intersubject variability of alcohol’s ADME in primates.
In conclusion, our studies demonstrate the value of using the deuterium isotope effect and PET to investigate the ethanol ADME properties in the liver, kidney, lung, heart, and the brain. This study corroborates alcohol metabolism by the liver and kidneys, and demonstrated that peripheral alcohol metabolism has significant impact on alcohol’s brain bioavailability. These findings sets the stage for future studies of alcohol in humans to investigate how genetics, gender and alcohol abuse affect alcohol’s ADME in the various organs, including brain and its relationship to intoxication and medical consequences.
Supporting Information
Figure S1 Brain uptake ratio (Cmax) of tracer 2 (D) to 1
(H) in baboon (Pear) in different brain region. STR: Striatum; CB: Cerebellum; THL: Thalamus; OCC: Occipital cortex; FRT: Frontal cortex; TEMP: Temporal cortex; CING: Cingulate gyrus; GL: Global; WM: White matter. The ratio was highest in thalamus and cingulate gyrus and lowest in frontal cortex
(TIFF)
Figure S2 The ratio of tracer (1) blood concentration (C(blood)) to tracer brain concentration (C(brain)) vs time in baboon (Pear).
(TIFF)
Acknowledgments
PET data analysis. This manuscript has been authored by Brookhaven Science Associates. The United States Government retains, and the publishers, by accepting the article for publication, acknowledge, a world-wide license to publish or reproduce the published form of this manuscript or allow others to do so, for the United States Government purposes.
Author Contributions
Conceived and designed the experiments: ZL. Performed the experiments: ZL YX DW. Analyzed the data: ZL NV YX. Wrote the paper: ZL NV YX.
References
1. Correa M, Salamone JD, Segovia KN, Pardo M, Longoni R, et al. (2012) Piecing together the puzzle of acetaldehyde as a neuroactive agent. Neurosci Biobehav Rev 36: 404–430.
2. Guo R, Ren J (2010) Alcohol and acetaldehyde in public health: from marvel to menace. Int J Environ Res Public Health 7: 1285–1301.
3. Peng GS, Chen YC, Tsao TP, Wang MF, Yin SJ (2007) Pharmacokinetic and pharmacodynamic basis for partial protection against alcoholism in Asians, heterozygous for the variant ALDH2*2 gene allele. Pharmacogenet Genomics 17: 845–855.
4. Li D, Zhao H, Gelernter J (2011) Strong protective effect of the aldehyde dehydrogenase gene (ALDH2) 504lys (*2) allele against alcoholism and alcohol-induced medical diseases in Asians. Hum Genet.
5. Yokoyama A, Omori T (2003) Genetic polymorphisms of alcohol and aldehyde dehydrogenases and risk for esophageal and head and neck cancers. Jpn J Clin Oncol 33: 111–121.
6. Yokoyama A, Omori T, Yokoyama T (2010) Alcohol and aldehyde dehydrogenase polymorphisms and a new strategy for prevention and screening for cancer in the upper aerodigestive tract in East Asians. Keio J Med 59: 115– 130.
7. Salaspuro MP (2003) Alcohol consumption and cancer of the gastrointestinal tract. Best Pract Res Clin Gastroenterol 17: 679–694.
8. Hommer D, Momenan R, Kaiser E, Rawlings R (2001) Evidence for a gender-related effect of alcoholism on brain volumes. Am J Psychiatry 158: 198–204. 9. Jacobson R (1986) The contributions of sex and drinking history to the CT brain
scan changes in alcoholics. Psychol Med 16: 547–559.
10. Chen CH, Walker J, Momenan R, Rawlings R, Heilig M, et al. (2011) Relationship Between Liver Function and Brain Shrinkage in Patients with Alcohol Dependence. Alcohol Clin Exp Res.
11. Sato N, Lindros KO, Baraona E, Ikejima K, Mezey E, et al. (2001) Sex difference in alcohol-related organ injury. Alcohol Clin Exp Res 25: 40S–45S. 12. Friel PN, Baer JS, Logan BK (1995) Variability of ethanol absorption and breath concentrations during a large-scale alcohol administration study. Alcohol Clin Exp Res 19: 1055–1060.
13. Volkow ND, Hitzemann R, Wolf AP, Logan J, Fowler JS, et al. (1990) Acute effects of ethanol on regional brain glucose metabolism and transport. Psychiatry Res 35: 39–48.
14. Karahanian E, Quintanilla ME, Tampier L, Rivera-Meza M, Bustamante D, et al. (2011) Ethanol as a prodrug: brain metabolism of ethanol mediates its reinforcing effects. Alcohol Clin Exp Res 35: 606–612.
15. Wilkinson PK, Sedman AJ, Sakmar E, Lin YJ, Wagner JG (1977) Fasting and nonfasting blood ethanol concentrations following repeated oral administration of ethanol to one adult male subject. J Pharmacokinet Biopharm 5: 41–52. 16. Cronholm T, Jones AW, Skagerberg S (1988) Mechanism and regulation of
ethanol elimination in humans: intermolecular hydrogen transfer and oxidore-duction in vivo. Alcohol Clin Exp Res 12: 683–686.
17. Cronholm T (1985) Incorporation of the 1-pro-R and 1-pro-S hydrogen atoms of ethanol in the reduction of acids in the liver of intact rats and in isolated hepatocytes. Biochem J 229: 323–331.
18. Kuikka J, Keinanen M, Solin O, Heselius SJ, Nanto V (1980) Liver sinusoidal permeability to ethanol and xenon molecules. J Biomed Eng 2: 87–88. 19. Bernstein J, Martinez B, Escobales N, Santacana G (1983) The pulmonary
ethanol metabolizing system (PET). Res Commun Chem Pathol Pharmacol 39: 49–67.
20. Michoudet C, Baverel G (1987) Metabolism of acetaldehyde in human and baboon renal cortex. Ethanol synthesis by isolated baboon kidney-cortex tubules. FEBS Lett 216: 113–117.
21. Upadhya SC, Ravindranath V (2002) Detection and localization of protein-acetaldehyde adducts in rat brain after chronic ethanol treatment. Alcohol Clin Exp Res 26: 856–863.
22. Zimatkin SM, Liopo AV, Satanovskaya VI, Bardina Lr, et al. (2001) Relationship of brain ethanol metabolism to the hypnotic effect of ethanol. II: Studies in selectively bred rats and mice. Alcohol Clin Exp Res 25: 982–988. 23. Zimatkin SM, Liopo AV, Slychenkov VS, Deitrich RA (2001) Relationship of
brain ethanol metabolism to the hypnotic effect of ethanol. I: Studies in outbred animals. Alcohol Clin Exp Res 25: 976–981.
24. DeGrazia JA, Rodden AF, Teresi JD, Busick DD, Walz DR (1975) Radio-scintigraphic studies of 11C distribution in cats given 1-11C-ethanol. J Nucl Med 16: 73–76.
25. Hetherington HP, Telang F, Pan JW, Sammi M, Schuhlein D, et al. (1999) Spectroscopic imaging of the uptake kinetics of human brain ethanol. Magn Reson Med 42: 1019–1026.
26. Amberg R, Furmaier R, Hirt H, Urban R (2002) Regional ethanol absorption of the human brain during the influx phase measured by means of the Magnetic Resonance Spectroscopy (MRS) and Positron Emission Tomography (PET). Blutalkohol 39: 11.
27. Howard RJ, Slesinger PA, Davies DL, Das J, Trudell JR, et al. (2011) Alcohol-binding sites in distinct brain proteins: the quest for atomic level resolution. Alcohol Clin Exp Res 35: 1561–1573.
28. Fowler JS, Wolf AP, MacGregor RR, Dewey SL, Logan J, et al. (1988) Mechanistic positron emission tomography studies: demonstration of a deuterium isotope effect in the monoamine oxidase-catalyzed binding of [11C]L-deprenyl in living baboon brain. J Neurochem 51: 1524–1534. 29. Lundquist F, Hansen LL (1989) Deuterium isotope effects as a tool in the study
of ethanol oxidation in rat liver microsomes. Pharmacol Toxicol 65: 45–54. 30. Lundquist F, Iversen HL, Hansen LL (1990) Deuterium D(V/K) isotope effects
on ethanol oxidation in hepatocytes: importance of the reverse ADH-reaction. Pharmacol Toxicol 66: 244–251.
31. Xiang Y, Shen J (2011) In vivo detection of intermediate metabolic products of [1-(13) C]ethanol in the brain using (13) C MRS. NMR Biomed 24: 1054–1062. 32. Raichle ME, Eichling JO, Straatmann MG, Welch MJ, Larson KB, et al. (1976) Blood-brain barrier permeability of 11C-labeled alcohols and 15O-labeled water. Am J Physiol 230: 543–552.
33. Ramchandani VA, Bosron WF, Li TK (2001) Research advances in ethanol metabolism. Pathol Biol (Paris) 49: 676–682.
34. Li TK, Yin SJ, Crabb DW, O’Connor S, Ramchandani VA (2001) Genetic and environmental influences on alcohol metabolism in humans. Alcohol Clin Exp Res 25: 136–144.
35. Damgaard SE (1981) Primary deuterium and tritium isotope effects upon V/K in the liver alcohol dehydrogenase reaction with ethanol. Biochemistry 20: 5662–5669.
36. Damgaard SE (1980) Isotope effect in peroxidation of deuterium-labelled ethanol by liver catalase. Biochem J 191: 613–618.
37. Corrall RJ, Rodman HM, Margolis J, Landau BR (1974) Stereospecificity of the oxidation of ethanol by catalase. J Biol Chem 249: 3181–3182.
38. Lieber CS (1988) The microsomal ethanol oxidizing system: its role in ethanol and xenobiotic metabolism. Biochem Soc Trans 16: 232–239.
39. Bell LC, Guengerich FP (1997) Oxidation kinetics of ethanol by human cytochrome P450 2E1. Rate-limiting product release accounts for effects of isotopic hydrogen substitution and cytochrome b5 on steady-state kinetics. J Biol Chem 272: 29643–29651.
40. Bell-Parikh LC, Guengerich FP (1999) Kinetics of cytochrome P450 2E1-catalyzed oxidation of ethanol to acetic acid via acetaldehyde. J Biol Chem 274: 23833–23840.
41. Ramchandani VA (2004) Genetic aspects of alcohol metabolism, in Nutrition and Alcohol: Linking Nutrient Interactions and Dietary Intake; Watson RR, Preedy VP, editors: CRC Press, Boca Raton. 12 p.
42. Michoudet C, Baverel G (1987) Characteristics of acetaldehyde metabolism in isolated dog, rat and guinea-pig kidney tubules. Biochem Pharmacol 36: 3987– 3991.
43. Bernstein J, Basilio C, Martinez B (1990) Ethanol sulfation by the pulmonary ethanol metabolizing system (PET). Res Commun Chem Pathol Pharmacol 68: 219–234.
44. Hlastala MP (1998) The alcohol breath test–a review. J Appl Physiol 84: 401– 408.
45. Beckemeier ME, Bora PS (1998) Fatty acid ethyl esters: potentially toxic products of myocardial ethanol metabolism. J Mol Cell Cardiol 30: 2487–2494. 46. Deelchand DK, Shestov AA, Koski DM, Ugurbil K, Henry PG (2009) Acetate transport and utilization in the rat brain. J Neurochem 109 Suppl 1: 46–54. 47. Christie IC, Price J, Edwards L, Muldoon M, Meltzer CC, et al. (2008) Alcohol
consumption and cerebral blood flow among older adults. Alcohol 42: 269–275. 48. Friel PN, Logan BK, O’Malley D, Baer JS (1999) Development of dosing guidelines for reaching selected target breath alcohol concentrations. J Stud Alcohol 60: 555–565.
49. Chen JC, Lin CC, Ng CC, Chiu TF, Shyr MH (2007) Uneven distribution of ethanol in rat brain following acute administration, with the highest level in the striatum. J Stud Alcohol Drugs 68: 649–653.
50. Gulyas B, Halldin C, Sandell J, Karlsson P, Sovago J, et al. (2002) PET studies on the brain uptake and regional distribution of [11C]vinpocetine in human subjects. Acta Neurol Scand 106: 325–332.
51. Volkow ND, Wang GJ, Begleiter H, Porjesz B, Fowler JS, et al. (2006) High levels of dopamine D2 receptors in unaffected members of alcoholic families: possible protective factors. Arch Gen Psychiatry 63: 999–1008.
52. Volkow ND, Wang GJ, Telang F, Fowler JS, Logan J, et al. (2007) Profound decreases in dopamine release in striatum in detoxified alcoholics: possible orbitofrontal involvement. J Neurosci 27: 12700–12706.
54. Zhu W, Volkow ND, Ma Y, Fowler JS, Wang GJ (2004) Relationship between ethanol-induced changes in brain regional metabolism and its motor, behavioural and cognitive effects. Alcohol Alcohol 39: 53–58.
55. Adalsteinsson E, Sullivan EV, Mayer D, Pfefferbaum A (2006) In vivo quantification of ethanol kinetics in rat brain. Neuropsychopharmacology 31: 2683–2691.