© FECAP
RBGN
Received on January 20, 2015 Approved on November 25, 2015
1. Gladyson
Brommonschenkel Demonier Master in Accounting Sciences UFES
(Brazil)
[gladyson.demunier@ifes.edu.br]
2. José Elias Feres de Almeida Doctor in Controlling and Accounting
FEA/USP (Brazil)
[jose.e.almeida@ufes.br]
3. Patricia Maria Bortolon Doctor in Management COPPEAD-UFRJ (Brazil)
[patricia.bortolon@ufes.br]
Review of Business Management
DOI:10.7819/rbgn.v17i57.2326
The impact of financial constraints on
accounting conservatism
Gladyson Brommonschenkel Demonier
Logistics Coordinator, Federal Institute of Espírito Santo, ES, Brazil
José Elias Feres de Almeida and Patricia Maria Bortolon
Department of Accounting, Federal University of Espírito Santo, ES, Brazil.
Responsible editor: Ivam Ricardo Peleias, Dr. Evaluation process: Double Blind Review
ABstRAct
Objective – his study investigates the efects of inancial constraints on the conservatism practices of Brazilian irms.
Design/methodology/approach – A sample totaling 1,086 observations of Brazilian publicly traded companies listed on BM&FBovespa was developed from 2000 to 2012. In the sample 106 observations were classiied in condition of inancially constrained according to the criteria related to lower dividends payout, large amount of cash and equivalents available and investment or capital expenditures (property, plant and equipment). We use Basu (1997) and Ball and Shivakumar (2005) models to investigate the relationship between inancial constraints and accounting conservatism.
Findings – he results show inancially constrained irms adopt less conditional conservatism practices on their accounting igures. In other words, those irms avoid to disclose losses trying to access more external funds, however, increasing information asymmetry.
Practical implications – he evidence of this study could be used by creditors and regulators to support new inancing policies and risk monitoring through irms’ inancial statements.
Originality/value – We empirically show that conditional conservatism practices are afected by inancial constraints. Also, we develop an alternative way to classify companies in terms of inancial constraints from a combination of three proxies traditionally applied in the literature such as cash and cash-equivalent, capital expenditure (property, plant and equipment) and dividends payout.
1 IntRODuctIOn AnD MOtIvAtIOn
Research concerning inancial constraints was highlighted from the end of the 1980s on, through the work of Fazzari, Hubbard and Peterson (1988), who sought to investigate the sensitivity of investments to cash low in companies facing inancial constraints. hese authors demonstrated that companies facing a higher degree of inancial constraint had higher investment sensitivity to cash low, that is, the sum applied to investments increases according to the volume of a company’s cash low.
Based on this study, Kaplan and Zingales (1997), seeking to test the results demonstrated by Fazzari et al. (1988), used the same sample, but reclassifying the inancial situation of companies through qualitative and quantitative measures drawn from accounting reports. Using variables such as the ratio of debt by total capital, interest coverage, dividend distribution and the inancial slack resulting from the cash level plus the line of credit that was not used, the authors divided ive groups of companies according to their level of inancial constraint. he results reveal that companies facing greater financial constraint presented lower investment sensitivity to cash low, contradicting the results of research by Fazzari et al. (1988).
Finance literature concerning the topic increased, and research out relating inancial constraints to the sensitivity of the level of investment to cash low (Almeida, Campello & Weisbasch, 2004; Chen, Huang & Chen, 2009; Cleary, 1999; Pellicani & Kalatzis, 2009) was carried out. However, despite these studies, the efects of inancial constraints on accounting numbers is still an infrequent topic in the literature that looks for interactions between accounting and inance – and it is this gap that this research seeks to ill, investigating the relationship between inancial constraints and conditional accounting conservatism.
hus, to understand this relationship, it is necessary to, at irst, understand the company’s contractual theory, which states that any given
company is made up of a set of agreements made among stakeholders – such as managers, shareholders, suppliers and creditors. However, within these contracts, the existence of problems involving information asymmetry, in which internal agents have informational advantage over outsiders (Sunder, 1997), is usually veriiable. herefore, to mitigate possible problems arising from this asymmetry of information, creditors see in conservatism a form of protection, since, for these users, through timely recognition of bad news, companies would promote better management, with a lower level of information asymmetry (Watts, 2003).
Watts (2003) argues that conservatism leads companies to recognize possible losses in advance (asymmetric recognition between bad and good news, or conditional conservatism), taking on an important role in combating possible opportunistic attitudes by managers – which, if is not properly applied, would undermine the analysis of creditors as to companies’ real situation, such as, for example, a delay in registering failed investment.
Therefore, we suggest that timely recognition of bad news (conditional conservatism) increases creditors’ perception of the reality of businesses via financial statements. This information that is disclosed to the market reduces the cost of monitoring interested parties (stakeholders), reducing contract costs by enhancing transparency. In this case, timely recognition of losses may enable creditors to exert their contractual rights, either to demand these rights or to monitor managers more eiciently. As a consequence of this increased transparency, creditors could ofer more resources to these companies when the losses recognized in advance do not to interfere in covenants, reducing inancial constraint.
which could afect the timely recognition of losses. hus, considering diferences in literature, we observed that there are still uncertainties about this relationship, a fact that motivates the investigation of the effects of financial constraints on accounting conservatism as carried out by this study.
Moreover, managers’ behavior considering the debt hypothesis developed by the positive theory of accounting (Watts & Zimmerman, 1990), which provides that the most leveraged irms are more likely to use practices that increase net income, we believe that – by investigating agents’ behavior in a inancial constraint scenario – this research will contribute to the expansion of literature on the subject, also contributing to creditors’, investors’ and regulators’ understanding of companies with inancial constraints’ trends when selecting accounting policies.
Thus, this paper poses the following question: What efect do inancial constraints have on accounting conservatism? In this way, we establish our main objective: to investigate the efects of inancial constraint on accounting conservatism within Brazilian public companies listed by BM&FBovespa.
Literature has pointed out that it is diicult to identify companies facing inancial constraints (Fazzari, Hurbard & Peterson, 1988; Kaplan & Zingales, 1997). hus, one of the main contributions of this research is to develop an alternative way to classify companies in terms of inancial constraints, based on proxies traditionally applied in literature, such as cash and cash-equivalents available, degree of investment in ixed assets, and distribution of dividends, which is the combination of the conditions for classifying inancial constraint. hus, to be classiied under inancial constraint, companies have to simultaneously present a positive variation for cash and cash-equivalents available and negative variations for distribution of dividends and investments in ixed assets.
To investigate the relationship between inancial constraints and conditional conservatism, we adapted the models of Basu (1997) and Ball
and Shivakumar (2005), in a sample of 1,086 observations of public companies listed on BM&FBovespa from the year 2000 to 2012.
Evidence from this research supports the hypothesis that companies facing inancial constraints use less conservative practices in their accounting. In other words, companies facing credit constraints, so as not to lose their borrowing capacity, avoid recognizing losses in order to reduce the volatility of net incomes and present better results, but the latter are artiicial and, in the long term, may harm creditors, investors and shareholders. This result can contribute to regulators’ work of monitoring companies’ inancial choices more accurately.
2 thEOREtIcAl FRAMEwORK AnD
hyPOthEsIs DEvElOPMEnt
2.1 Financial constraints: concept and
identiication
According to Whited (1992), inancial constraints are present when a company inds it difficult to obtain funding from external sources. Kaplan and Zingales (1997) question a common argument in literature that states that a company faces inancial constraint problems when it is harder and more expensive to attract external resources, forcing companies to inance their investments internally. To the author, this argument is incomplete and literature disagrees as to this point.
hus, given the above, in this research the identiication of companies facing inancial constraints considers a combination of indicators from the literature review that is presented in it.
When studying inancial constraint, one of the main diiculties that arise refers to choosing criteria to classify companies that are inancially constrained or unconstrained. As such, we will present a few methodologies that were used to identify this condition in companies.
investigated the investment-cash low ratio and inancial constraints, analyzing dividend payment policy to identify companies facing financial constraints. To the authors, companies that pay less dividends face a higher degree of inancial constraint, based on two assumptions: i) intention to guard against possible unforeseen events; managers prefer to inance with retained earnings, since external fundraising faces asymmetric information problems (Myers & Majluf, 1984); ii) companies that had inancial diiculties and major financial constraints would not have suicient cash low to pay dividends.
Gilchrist & Himmelberg (1998) identify the degree of inancial constraint companies face according to their access to the credit market, and to their risk rating. Survey results revealed that investments respond signiicantly to inancial factors such as Tobin’s Q, cash low and debt. Moreover, the authors state that small businesses and companies with no risk rating for their debt securities responded with greater sensitivity to cash low, while companies possessing securities with risk ratings presented little or no response.
Kaplan and Zingales (1997), on the other hand, use both qualitative and quantitative measures drawn from accounting reports as an alternative to the study of Fazzari et al. (1988). The authors, using data such as the ratio of debt by total capital, interest coverage, dividend distribution and the financial slack given by the level of cash plus the line of unused credit, classiied ive groups of companies according to their level of inancial constraint. hese criteria were also a basis for other surveys such as those by Lamont, Polk and Saá-Requejo (2001), Pellicani and Kalatzis (2009), and Chen et al. (2009).
Almeida, Campello and Weisbach (2004) claim that inancial constraint can be identiied through the cash volume stored by a company, in which companies facing inancial constraints tend to retain a higher amount of cash in order to guard against possible unforeseen events. In a complementary way, Cleary (1999) points out that inancially less solid companies tend to avoid applying their own resources to investments, in
order to sustain a inancial slack and thus reduce the risk of, in the future, if there is a need for resources, being obliged to take on debt capital at high costs.
Expanding on most recent literature, Costa, Paz and Funchal (2008), using the same model by Almeida et al. (2004) to identify the efects of inancial constraints on cash reserve policies, used access to international inancial markets through American Depositary Receipts (ADRs) to identify companies facing inancial constraints. he authors note that companies that issue ADRs meet numerous requirements to do so and, therefore, have easier access to the US inancial system, reducing inancial constraints.
Analyzing these studies, we observed that the dividend payment policy and cash volume are criteria that are present in almost all papers, even if involving metrics that have faced criticism (Kaplan & Zingales, 1997). hus, in the same line of reasoning, this research used these two criteria alongside the volume of investment in fixed assets criterion to identify inancially constrained companies.
2.2 Accounting conservatism
Basu (1997) and Ball and Shivakumar (2005) define conditional conservatism as the recognition of bad news faster than the recognition of good news. Iudicibus (2010) reports that conservatism is present in situations in which managers, being able to choose between two or more alternatives to recognize a given fact, will favor the option that culminates in a lower asset value or greater liability value.
Regarding these agreements, it is essential to emphasize companies’ contractual theory and the contribution of conservatism to mitigating potential problems in these contracts. Concerning this theory, Sunder (1997) contributes by stating that companies are made up of a set of formal and informal agreements between stakeholders, such as managers, shareholders, customers, creditors, suppliers, amongst others.
Watts and Zimmerman (1990) corroborate this by stating that companies are made up of agreements between individuals, but there is not always harmony between the goals of the parties involved in this contractual relationship. Lopes (2004), on the other hand, reveals that the harmony of these contracts is usually threatened by problems referring to information asymmetry, in which agents (who manage) have more information than main stakeholders (the ones who invest), and may beneit from privileged information to increase well-being to the detriment of the latter.
In this scenario, Sunder (1997) states that accounting has an important informational role in reducing problems referring to information asymmetry. Watts (2003) argues that company stakeholders prefer accounting conservatism, since it minimizes opportunistic earnings by the management, reducing information asymmetry and conlicts of interest between the company and investors, facilitating debt renegotiation and preventing the company from resorting to bankruptcy to solve inancial problems.
hus, in view of the above, we can observe how important the accounting conservatism attribute is to the management of an organization; as such, in the next section, we will present the relationship between conservatism and inancial constraints along with the formulation of the hypothesis of this research.
2.3 conservatism, inancial constraints and
hypothesis formulation
As seen in the previous section, conditional conservatism plays a key role in aligning contracts
while respecting interests within an organization. In practice, in a contract between a company and a creditor, conditional conservatism is an attribute that represents minimum guarantees to the latter’s perception of risk (Paul, 2007). his perspective is based on the fact that, by recognizing economic losses in a timely fashion, results are less optimistic, so that creditors would be in a less uncertain environment as to the company’s economic and inancial situation.
Authors such as Li (2015), Watts (2003) and Kothari, Shu and Wysocji (2009) also state that conditional conservatism can contribute to reducing the cost of third-party funds borrowed by the company, since this attribute would help in corporate monitoring and governance.
So, it turns out that accounting conservatism helps in reducing companies’ inancial constraints by minimizing information asymmetry in company contracts. However, through cash retention, we can also observe conservatism’s relationship with inancial constraint.
Watts (2003) states that conservatism has the power to reduce or postpone expenditures aimed at paying for remuneration based on performance, for dividends and for taxes. Biddle, Ma and Song (2012) used a sample of 4,621 companies listed in NYSE Amex and NASDAQ stock exchanges, over the 1989-2007 period, to see if the risk of bankruptcy inluences accounting conservatism. he authors tested two research hypotheses: the irst claimed that unconditional conservatism is negatively associated with the risk of subsequent bankruptcy, and the second hypothesis stated that conditional conservatism is negatively associated with the risk of subsequent bankruptcy. he authors’ indings conirmed the two research hypotheses.
In order to investigate the relationship between conservatism and inancial constraints, using a sample made up of 43,598 US companies per year, over the 1971-2007 period, Lee (2010) investigated the relationship between accounting conservatism and a company’s ability to access and restructure its capital at a low cost. To formulate his research hypotheses, the author presented two theories referring to this relationship.
In the irst one, the author suggests that conservatism supports the monitoring of capital providers; thus, the latter should be more willing to extend inancing at lower rates, increasing companies’ access to capital. In the second theory, on the other hand, the author shows that the more timely recognition of losses rather than of gains unreasonably increases companies’ leverage ratio, when compared to the actual index, as well as underestimating companies’ equity when compared to the actual market value of the same. hus, facing this increase in leverage ratio and reduction in shareholders’ equity, the author argues that companies’ ability to raise capital in the future will be reduced, since creditors will fear that they cannot fulill their contracts. Finally, by testing these hypotheses, the author’s indings revealed that, although companies enjoy lower costs in funding raised through conservative practices, they companies would face future diiculties in accessing capital.
Analyzing and comparing the studies presented by Lee (2010) and Biddle et al. (2012) and taking into account that companies declaring bankruptcy often face inancial constraints, we observe that the results found by them contradict each other. Lee (2010) showed that accounting conservatism would hinder access to company capital in the future, while Biddle et al. (2012) highlighted that the risk of failure decreases for companies that use conservative practices.
In this context, the research hypothesis of this study is as follows:
H1: Companies facing inancial constraints do not use conditional conservatism in their accounting igures.
3 MEthODOlOGy
his research uses the positive accounting approach, in which Watts and Zimmerman (1990) claim that it can provide useful information to those responsible for making decisions about the accounting policies of companies. The purpose of this research, on the other hand, is to investigate the efects of inancial constraints on accounting conservatism in Brazilian companies. To identify companies’ inancial constraint status, this research uses three criteria: cash and cash-equivalents available, investment in ixed assets and dividend distribution.
To understand the criteria for identifying each inancial constraint used in this study, we start off from the claim that companies that face inancial constraints tend to accumulate higher balances in cash accounts, in order to avoid using more expensive sources of resources, should unforeseen events occur (Almeida et al., 2004). From this perspective, the cash and cash-equivalents available criterion could be a way to investigate the degree of inancial constraint a company is facing.
herefore, to meet the objectives of this study, using a complementary and alternative way to measure inancial constraints, for the company to be classiied as facing inancial constraint, it must simultaneously present: (i) negative variation of dividend distribution, also considering the
interest on own capital, (ii) negative variation in investment in ixed assets, and (iii) positive variation of cash and cash-equivalents available. Table 1 presents the calculation memory and the theoretical framework for each of these criteria.
tABlE 1 – Criteria to identify companies facing inancial constraints
criterion Description Rationale
Positive variation of cash and cash-equivalents
available
(Cash and cash equivalents + Short-term investment)it - (Cash and cash equivalents + Short-term
investment)it-1
Following the reasoning of Almeida et al. (2004), companies that present a high degree of inancial constraint tend to store larger amounts of cash in order to guard against possible unforeseen events, since, if there is a need for
cash, taking from external funding sources would be more expensive.
negative or null variation of investments in
ixed assets
(Fixed + Depreciation)it- (Fixed + Depreciation)it - 1
According to Cleary (1999), companies facing inancial constraints avoid making investments with their own resources, so as not to, out of necessity,
be forced to deal with high capital costs.
negative or null variation
of dividend distribution
((dividend distribution + IOE)it / NPit)) - ((dividend distribution +
IOE)it-1/ NPit-1))
-According to the criterion used by Fazzari et al. (1988), companies facing constraints tend to retain a larger share of net income, in order to cover possible unforeseen events, since, to these companies, the cost of equity is
less than the cost of external capital.
Note: IOE = Interest on equity; NPit = net income.
To capture the effects of financial constraints on the quality of accounting information, we established a dummy variable called DRF, which will take on the value of 1 for companies classiied as with inancial constraints, that is, for companies that met all the criteria highlighted in Table 1, and 0 for companies classiied as without inancial constraints.
In addition, we selected a control sample in order to test the eiciency of the criteria used to classify companies as inancially constrained or unconstrained. his selection occurred via the website of the Brazilian Securities Commission (Comissão de Valores Mobiliários/CVM), where we initially selected 25 companies that iled for
bankruptcy between years 1997 and 2011; next, we excluded the companies that had a negative cash low. he remaining 12 companies made up the control sample.
interesting time to evaluate the eiciency of the inancial constraint identiication criteria. he results of these tests are presented in section 3.1.
In the sample selection, on the other hand, using the Economática® database, we selected all active Brazilian companies listed in BM&FBovespa between 2000 and 2012, with the exception of companies belonging to the inancial sector, because of its speciicities and speciic regulation. From these companies, we excluded the observations with incomplete information and observations that had negative cash low, since, for the cash and cash-equivalents available to be a valid criterion for identifying companies with inancial constraints, they need to have a positive cash low, so as to save a part of that low, giving evidence that these companies would protect their own resources for possible unforeseen events. Moreover, we excluded from the sample companies that presented losses, because dividends are distributed based on a company’s net income
Also, such as the in work of Basu (1997) and Ball and Shivakumar (2005), in order to reduce the effect of outliers on the result of regressions, we excluded from the sample 1% of the extremes of each variable. Finally, the sample amounted to a total 1,086 observations; 106 observations were classiied as with inancial constraints.
Next, as shown in section 3.2 models, we used the models of Basu (1997) and Ball and Shivakumar (2005) in a panel, adapted through the insertion of a DRF financial constraint dummy to capture its efect in the practice of conditional conservatism, and of three variables
control: Size (SIZ) given by the natural logarithm of total assets, Leverage (LEV) given by the ratio of total debt by total assets, and Growth Opportunity
(GRO) calculated as the change in operating net revenues divided by operating net revenue in t-1.
3.1 Analysis of sensitivity and robustness
To increase the eiciency of the criterion for identiication of companies with inancial constraints used in this research, as well as the robustness of the results, we selected a sample of 12 companies iling bankruptcy and registered in the CVM.
he three inancial constraint criteria were applied to this control sample; results showed that, of the 12 companies analyzed, only three did not meet all the inancial constraint criteria and, as such, were classiied as unconstrained. All the others met all the classiication criteria for companies with inancial constraints.
Therefore, assessing the financial constraints classification model used in this research through this analysis, it appears that the criteria represent a 75% accuracy rate.
3.2 Empirical models of conservatism
To investigate companies with inancial constraints’ conditional conservatism, we will use the model of Basu (1997) and the model of Ball and Shivakumar (2005), but with the inclusion of a dummy variable referring to the inancial constraint status in both models.
hus, the model of Basu (1997) adapted for this research is as follows:
In which: LPAit– Net income of irm i in period t scaled by stock price in t-1; DRit
– dummy variable referring to negative stock returns, assuming 1 for negative stock returns and 0, otherwise for irm I in period; Rit - Stock return of irm I in period t scaled by stock price in t-1;;
DRFit – dummy variable assuming 1 for irm I in period t in inancial constraint condition and 0, otherwise; VCni – control variable n, in a total of
k variables, measured for the i company; Year –
Dummy variables for each year; εit – regression error term.
So as to control the efects of scale and of problems referring to heterocedasticity as Basu
(1997) did, variables LPAit and Rit were scaled by asset price in t-1. For the hypothesis that companies with inancial constraints tend to be less conservative not to be rejected, we expect coeicient β7 to take on a value that is statistically signiicant and negative. he negative coeicient demonstrates that the Market recognized losses in a more timely manner than results that were recognized and presented by the company.
On the other hand, the model of Ball and Shivakumar (2005) adapted for this research is:
In which: ΔLLit – variation of the net accounting net income of company i from year
t-1 to year t scaled by the total assets of company
i at the beginning of year t; ΔLLit-1 - variation of the net accounting net income of company i from year t-2 to year t-1 delated by the total assets of company i at the beginning of year t-1; DΔLLit-1
- dummy variable with value 1 for negative variations of the net accounting net income of company i in year t-1, and 0 otherwise; DRFit – dummy variable assuming 1 for irm I in period t in inancial constraint condition and 0, otherwise;
VCni - n control variable, for a total k variables,
measured for the I company; Year - Dummy variables for each year; εit – regression error term. Considering the hypothesis developed in this research, we expect that the α7 coeicient takes
on a positive and statistically signiicant value, thus conirming that companies with inancial constraints do not present the conservatism attribute in their inancial statements.
4 REsults
4.1 Descriptive statistics results
tABlE 2 – Descriptive statistics of inancially constrained and unconstrained companies
variables companies Obs. Mean standard Deviation Minimum Maximum p-value
LPA it
Unconstrained 980 0.322 0.358 0.035 1.18
0.001 Constrained 106 0.196 0.162 0.035 0.544
R it
Unconstrained 980 2.368 3.944 -2.466 10.768
0.039 Constrained 106 1.674 3.01 -2.88 7.14
∆LL it
Unconstrained 980 0.026 0.075 -0.135 0.436
0.0009 Constrained 106 0.052 0.118 -0.134 0.69
∆LL it-1
Unconstrained 980 0.014 0.073 -0.257 0.326
0.151 Constrained 106 0.006 0.095 -0.433 0.364
LEV it
Unconstrained 980 0.5382 0.176 0.238 0.801
0.078 Constrained 106 0.512 0.205 0. 195 0.831
SIZ it
Unconstrained 980 13.822 1.43 11.492 16.019
0.002 Constrained 106 13.37 1.844 10.497 16.319
GRO it
Unconstrained 980 0.135 0.131 -0.064 0.366
0.034 Constrained 106 0.108 0.015 -0.114 0.373
Note. Unconstrained = Companies classiied as without inancial constraints; Constrained = Companies classiied as with inancial constraints.
C o m p a r i n g Ta b l e 2 i n f o r m a t i o n , concerning companies with inancial constraints and companies without inancial constraints, we can see that both mean net incomes and mean net incomes per asset of companies with inancial constraints were lower than the mean values of companies without constraints inancial. his may be an indication that less proitable companies deal with higher inancial constraints due to the lack of perspective that the market may have about them; in other words, the market prices inancial diiculties.
Moreover, confirming the results of research carried out by Devereux and Shiantarelli (1990), which show that the degree of inancial constraint is inversely related to the size of the company, we observe that, in the sample analyzed in this study, companies classiied as inancially constrained are on mean smaller than companies classiied without inancial constraints.
Finally, analyzing the degree of leverage of the two groups of companies, companies with inancial constraints were expected to present, on mean, higher levels of leverage compared to the group of companies classiied without inancial
constraints. However, in the selected sample, the result of the statistical test rejects the hypothesis that there is a diference of means between the degrees of leverage of the groups of analyzed companies.
4.2 Results of Basu’s adapted model (1997)
We carried out regression in panel with fixed and random effects, and applied the Hausman test to identify which estimator would be the most appropriate. he test result rejected the null hypothesis that error ui and explanatory variables are not correlated. hus, the estimator with ixed efects was the most appropriate one for the model.
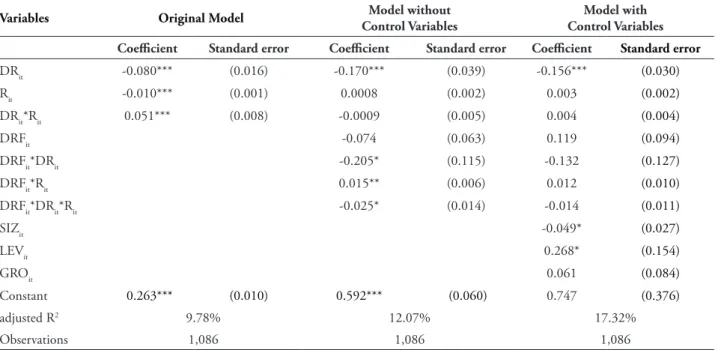
tABlE 3 – Results of Basu’s adapted model (1997)
LPA
it = β0 + β1DRit + β2Rit + β3DRit*Rit + β4DRFit + β5DRFit*DRit + β6 DRFit *Rit + β7 DRFit *DRit*Rit +
variables Original Model Model without
control variables
Model with control variables
coeicient standard error coeicient standard error coeicient standard error
DRit -0.080*** (0.016) -0.170*** (0.039) -0.156*** (0.030)
Rit -0.010*** (0.001) 0.0008 (0.002) 0.003 (0.002)
DRit*Rit 0.051*** (0.008) -0.0009 (0.005) 0.004 (0.004)
DRFit -0.074 (0.063) 0.119 (0.094)
DRFit*DRit -0.205* (0.115) -0.132 (0.127)
DRFit*Rit 0.015** (0.006) 0.012 (0.010)
DRFit*DRit*Rit -0.025* (0.014) -0.014 (0.011)
SIZit -0.049* (0.027)
LEVit 0.268* (0.154)
GROit 0.061 (0.084)
Constant 0.263*** (0.010) 0.592*** (0.060) 0.747 (0.376)
adjusted R2 9.78% 12.07% 17.32%
Observations 1,086 1,086 1,086
Note. LPAit – Net accounting net income per asset of company i in year t, scaled by asset price in t1; DRit – Dummy variable referring to negative net incomes, with 1 for negative net incomes and 0 for positive net incomes for companies i
in year t; Rit - Net income of assets of company i in year t scaled by asset price in t–1; DRFit – Dummy variable referring
to inancial constraint, 1 for company i in year t classiied as with inancial constraints and 0 for the remaining companies; SIZit – Natural logarithm of the total assets of company i in year t; LEVit – leverage of company i in year t; GROitgrowth opportunity of company i in year t; ***, **, *, signiicant coeicients at 1%, 5%, and 10%, respectively.
he results of the original model of Basu (1997) reveal a positive and signiicant coeicient for variable drit DRit*Rit.,(0.051), suggesting more timely recognition of bad news than good news for companies in general. Furthermore, when analyzing the results of models adapted with the inancial constraint dummy variable, we observed that the regression without the control variables presented an adjusted R2 of 12.07%. By adding control variables to the model, on the other hand, the explanatory power of regression was increased to 17.32%.
As for the coefficient of variable
DRFit*DRit*Rit. , (β7) , w h i c h i n ve s t i g a t e s conservatism in companies with financial constraint, we observed that only the model without control variables presented a statistically signiicant result at 10%, still revealing a negative coeicient of -0.025. Analyzing this result, we can infer that companies with inancial constraints do
not use conservative practices in their inancial statements.
4.3 Results of Ball e shivakumar’s adapted
model (2005)
Once again, after carrying out regression with ixed and random efects, and applying the Hausman test to determine which of the efects is most appropriate, the result again rejected the null hypothesis that error ui and explanatory variables are not correlated. hus, the estimator with ixed efects was the most appropriate for the model.
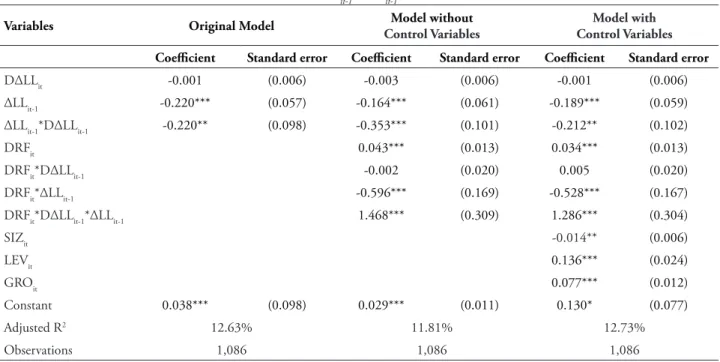
table 4 – Results of Ball e Shivakumar’s adapted model (2005)
ΔLLit = α0+ α1DΔLLit-1+ α2ΔLLit-1 + α3ΔLLit-1*DΔLLit-1+ α4DRFit + α5DRFit *DΔLLit-1 +α6DRFit *ΔLLit-1 + α7DRFit
*DΔLLit-1*ΔLLit-1 ++
variables Original Model Model without
control variables
Model with control variables
coeicient standard error coeicient standard error coeicient standard error
DΔLLit -0.001 (0.006) -0.003 (0.006) -0.001 (0.006)
ΔLLit-1 -0.220*** (0.057) -0.164*** (0.061) -0.189*** (0.059)
ΔLLit-1*DΔLLit-1 -0.220** (0.098) -0.353*** (0.101) -0.212** (0.102)
DRFit 0.043*** (0.013) 0.034*** (0.013)
DRFit*DΔLLit-1 -0.002 (0.020) 0.005 (0.020)
DRFit*ΔLLit-1 -0.596*** (0.169) -0.528*** (0.167)
DRFit*DΔLLit-1*ΔLLit-1 1.468*** (0.309) 1.286*** (0.304)
SIZit -0.014** (0.006)
LEVit 0.136*** (0.024)
GROit 0.077*** (0.012)
Constant 0.038*** (0.098) 0.029*** (0.011) 0.130* (0.077)
Adjusted R2 12.63% 11.81% 12.73%
Observations 1,086 1,086 1,086
Note. LPAit – Net accounting net income per asset of company i in year t, scaled by asset price in t1; DRit – Dummy
variable referring to negative net incomes, with 1 for negative net incomes and 0 for positive net incomes for companies i in year t; Rit - Net income of assets of company i in year t scaled by asset price in t–1; DRFit – Dummy variable referring to inancial constraint, 1 for company i in year t classiied as with inancial constraints and 0 for the remaining companies; SIZit – Natural logarithm of the total assets of company i in year t; LEVit – leverage of company i in year t; GROit growth opportunity of company i in year t; ***, **, *, signiicant coeicients at 1%, 5%, and 10%, respectively.
hus, as in the original model of Basu (1997), the result of the original model of Ball and Shivakumar (2005) revealed through analysis of coeicient ΔLLit-1*DΔLLit-1 that, in general, the negative results of previous years tend to be reversed in the following year. In other words, these companies use conservative practices.
Now, looking at the results of the adapted models to investigate conservatism in companies with inancial constraints, it turns out that the regression without control variables presented an
adjusted R2 of 11.81%, while, by adding them,
the explanatory power of the model increased to 12.73%.
Starting from analysis of the model without control variables, we observe a negative coeicient of -0.3535 for variable ΔNIit-1*DΔNIit-1
at 1% significance, indicating conservative practices when analyzing the sample as a whole. Coeicient of variable DRFit*DΔLLit-1*ΔLLit-1 in the same model, in which there is only evidence of conservatism in companies with financial constraints, the result was also signiicant at 1%, but with a positive value of 1.468, demonstrating the absence of accounting conservatism in companies with inancial constraints.
Analyzing the results of the model with control variables, the coeicient found for the
DRFit*DΔLLit-1*ΔLLit-1 variable was 1.286, which
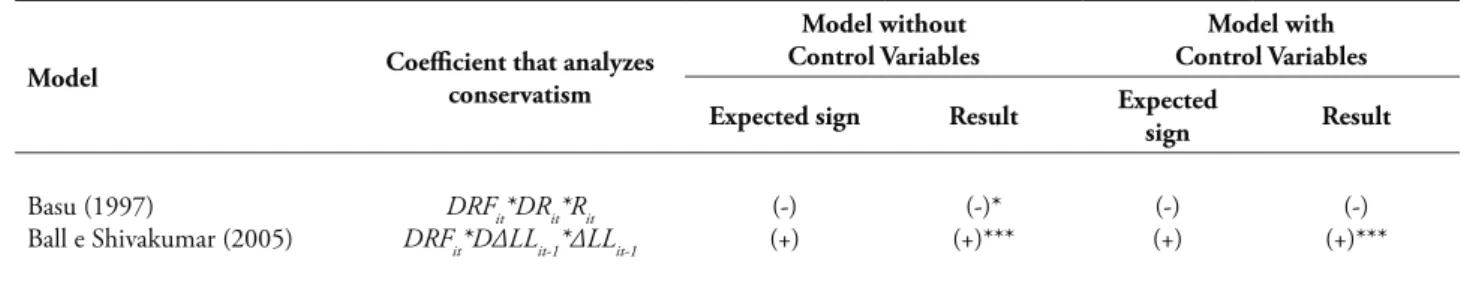
tABlE 5 – Summary of research results
Model coeicient that analyzes
conservatism
Model without control variables
Model with control variables
Expected sign Result Expected
sign Result
Basu (1997)
Ball e Shivakumar (2005)
DRFit*DRit*Rit DRFit*DΔLLit-1*ΔLLit-1
(-) (+)
(-)* (+)***
(-) (+)
(-) (+)***
Note. Asterisks represent the signiicance level of Pearson’s coeicients: ***, **, *, signiicant at 1%, 5%, and 10%, respectively.
We observed that, except for the results from the model of Basu (1997) with control variables, the coefficient was not statistically signiicant; all other results showed coeicients with statistically signiicant signs, expected by this research. herefore, we cannot reject the hypothesis of this research, which proves that companies classiied as with inancial constraints do not use conditional conservatism in their accounting.
Evidence indicates that companies in inancial constraint position do not have the conditional conservatism attribute; in other words, the timely recognition of losses does not occur. his result may also be due to earnings management practices to meet companies’ contractual debt covenants.
5 FInAl cOnsIDERAtIOns
This research investigated accounting conservatism in Brazilian companies with inancial constraints. To this end, we used a sample of 1,086 observations of Brazilian companies listed in BM&FBovespa from 2000 to 2012, with 106 observations classiied as companies with inancial constraint status.
With regard to identiication of inancial constraints, this research based on studies by Adams et al., (2004), Cleary (1999), Fazzari
et al. (1988), developed an alternative way to
identify this condition by examining the cash and cash-equivalents available, the distribution of dividends and investments in ixed assets.
For robustness of results, the same methodology was tested by applying it in a control sample consisting of companies considered in bankruptcy condition, resulting in a degree of 75% accuracy for that criterion. hus, facing the diiculty that studies on inancial constraints found to identify this condition in organizations, we expect that the criteria considered in this paper can be used in future studies. Moreover, the results for that speciic sample were qualitatively compliant.
he results presented in this article, in turn, indicate that the companies with inancial constraints did not show practical evidence of conditional conservatism in their accounting igures, measured by the models of Basu (1997) and Ball and Shivakumar (2005). In this case, there are indications that companies facing inancial constraints avoid reporting economic losses so as to have higher net incomes. his may be motivated by covenants from debt contracts, so that creditors do not exercise their contractual rights if an indicator is breached.
Still, corroborating the arguments presented by Biddle et al., (2012), this research suggests that the negative association between conservatism and inancial constraints is related to the fact that, if managers recognize losses in a timely way, access to credit could be reduced by signaling bad news to the market, once again encouraging these companies to retain higher volume of cash.
by creditors, suppliers and investors, since net incomes could be anticipated opportunistically by management, a fact that would contribute to increasing inancial constraints over subsequent periods.
Finally, the results of this research contribute to those who use accounting, such as investors, creditors, the government, and suppliers, amongst others, by verifying the possibility of identifying evidence of the inancial constraints of a given company from analysis of its inancial statements.
REFEREncEs
Almeida, H., Campello, M., & Weisbach, M. S. (2004). he cash low sensitivity of cash. Journal
of Finance, 59(4), 1777–1804.
Ball, R., & Shivakuar, L. (2005). Earnings quality in UK private irms: Comparative loss recognition timeliness. Journal of Accounting & Economics,
39(1), 83–128.
Basu, S. (1997). he conservatism principle and the asymmetric timeliness of earnings. Journal of
Accounting and Economics, 24(1), 3–37.
Biddle, G. C., Ma, M. L., & Song, F. M. (2012). Accounting conservatism and bankruptcy risk.
Social Science Research Network
Chen, Y., Huang, Y., & Chen, C. (2009). Financing constraints, ownership control, and cross- border m&as: evidence from nine east asian economies. Corporate Governance: An
International Review, 17(6), 665–680.
Cleary, S. (1999). he relationship between irm investment and inancial status. he Journal of
Finance, 54(2), 234–270.
Costa, C. M., Paz, L. S., & Funchal, B. (2008). Fluxo de caixa, ADRs e restrições de crédito no Brasil. Revista Brazilian Business Review, 5(2), 144–151.
Dechow,P., Ge, W., & Schrand, C. (2010). Understanding earnings quality: A review of the proxies, their determinants and their consequences.
Journal of Accounting and Economics, 50(2/3),
344–401.
Devereux, M., & Schiantarelli, F. (1990). Investment, financial factors and cash flow: evidence from UK panel data [Working Paper Nº 3116]. he National Bureau of Economic Research. Chicago.
Fazzari, S., Hurbard R. G., & Peterson, B. (1988). Financing constraints and corporate investment.
Brooking Papers on Economic Activity, 1(2387),
141–195.
Gigler, F., Kanodia, C., Sapra, H., & Venugopalan, R. (2009). Accounting conservatism and the eiciency of debt contracts. Journal of Accounting
Research, 47(3), 767–797.
Gilchrist, S., & Himmelberg, C. (1998). Investment, fundamentals and inance. National
Bureau of Economic Research, 12(3), 221–242.
Holthausen, R. W., & Watts, R. L. (2001). he relevance of the value -relevance literature for inancial accounting standard setting. Journal of
Accounting & Economics, 31, 3-75.
Iudicibus, S. (2010). Teoria da contabilidade (10a ed.). São Paulo: Atlas.
Kaplan, S., & Zingales, L. (1997). Do inancing constraints explain why investments is correlated with cash low? Quarterly Journal of Economics,
112(1), 169–215.
Kothari, S. P., Shu, S., & Wysocki, P. (2009). Do managers withhold bad news? Journal of
Accounting Research, 47(1), 241–276.
Lamont, O., Polk, C., & Saá-Requejo, J. (2001). Financial constraints and stock returns. The
Review of Financial Studies, 14(2), 529–554.
Lee, K. B. J. (2010). he role of accounting conservatism in irms’ inancial decisions. Research
Li, X. (2015). Accounting Conservatism and the Cost of Capital: International Analysis. Journal of Business Finance & Accounting. 42(5/6), 555-582.
Lopes, A. B. (2004). A informação contábil e o
mercado de capitais. São Paulo: homson.
Myers, S. C.; Majluf, N. S. (1984). Corporate inancing and investment decisions when irms have information that investors do not have.
Journal of Financial Economics, 13(2), 187-221.
Paulo, E. (2007). Manipulação das informações contábeis: Uma análise teórica e empírica sobre os modelos operacionais de detecção de gerenciamento
de resultados (PhD thesis). Universidade de São
Paulo, São Paulo, SP, Brazil.
Pellicani, A. D., & Kalatzis, A. E. G. (2009). Ownership structure on overinvestment and
underinvestment: Evidence from a panel of Brazilian irms. Anais do Encontro Brasileiro de
Finanças, São Paulo, SP, Brazil, 12.
Sunder, S. (1997). heory of accounting and control. South-Western Publishing, 8(4), 212–230.
Watts, R. L. (2003). Conservatism in accounting part 1: Explanations and implications. Accounting
Horizons, 7(3), 207–221.
Watts, R. L., & Zimmerman, J. L. (1990). Positive accounting theory: A ten year perspective. he
Accounting Review, 65(1), 131–156.