Nectar and pollen production in pumpkin (
Cucurbita pepo
L.)
MARIA DAS GRAÇAS VIDAL
1,5, DAVID DE JONG
2, HANS CHRIS WIEN
3and ROGER A. MORSE
4(received: May 12, 2005; accepted: May 18, 2006 )
ABSTRACT– (Nectar and pollen production in pumpkin (Cucurbita pepo L.)). Cucurbitaceae species depend on pollination by
honey bees for fruit production. The overall objective of this work was to evaluate the potential of C. pepo for pollen and nectar production, that could help maintain colonies placed in the field. Plants of pumpkin were cultivated in field, in 1996 and 1997. Before anthesis, male flowers were covered to prevent visits by bees and other insects. After anthesis the flowers were uncovered and the following parameters were evaluated: 1) nectar production; 2) total sugar concentration in the nectar; 3) nectar replacement; and 4) production of pollen and flowers during the crop cycle. Nectar production varied from 18 to 79 µL flower -1 and increased progressively from 7h to 13h. The sugar concentration, measured at 7h, 9h and 11h, did not vary, averaging
50.5% ± 0.5% in 1996 and 40.5% ± 0.6% in 1997. At 13h the concentration decreased to 42% in 1996 and to 35% in 1997. Total daily nectar production was not influenced by removing nectar several times per day, indicating that nectar secretion is not stimulated or inhibited by frequent removal. The number of pollen grains did not differ in the two years, with an average of 43,669 ± 1,382 grains per flower. The peak rate of male and female flowers occurred from 60 to 66 days after planting (DAP) with 34.6 male flowers and 2.2 female flowers per plant, respectively. Cucurbita pepo has a potential for honey and pollen production of about 105 and 160 kg per hectare per season, respectively, which is enough to sustain, at least, five honeybee colonies.
Key words - flower production, honey potential, nectar production, pollen production, sugar concentration
RESUMO– (Produção de néctar e pólen em abóbora (Cucurbita pepo L.)). As espécies das cucurbitáceas dependem da
polinização por abelhas para produzir frutos. O objetivo geral deste trabalho foi avaliar o potencial da C. Pepo para produzir pólen e néctar, no sentido de ajudar a manter colônias no campo visando a polinização. Plantas de abóbora foram cultivadas no campo, em 1996 e 1997. Antes da antese, flores masculinas foram cobertas para prevenir visitas de abelhas e outros insetos. Depois da antese as flores foram desprotegidas e os seguintes parâmetros foram avaliados: 1) produção de néctar; 2) concentração total de açúcar no néctar; 3) reposição de néctar e 4) produção de pólen e flores durante o ciclo da cultura. A produção de néctar variou de 18 a 79 µL flor-1 e aumentou progressivamente de 7h00 para 13h00. A concentração de açúcares,
avaliada às 7h00, 9h00 e 11h00, não variou, apresentando uma média de 50,5% ± 0,5% em 1996 e 40,5% ± 0,6% em 1997. Às 13h00 a concentração decresceu para 42% em 1996 e para 35% em 1997. A produção diária de néctar não foi influenciada pela remoção do néctar em diferentes horas do dia, indicando que a produção de néctar não é estimulada ou inibida pela freqüente remoção. O número de grãos de pólen não variou nos dois anos, com uma média de 43.669 ± 1.382 grãos por flor. O pico de produção de flores masculinas e femininas ocorreu 60 a 66 dias após o plantio (DAP), com 34,6 flores masculinas e 2,2 flores femininas por planta, respecivamente. C. pepo tem um potencial para produção de mel e pólen de 105 e 160 kg por hectare, respectivamente, que é suficiente para alimentar, pelo menos, cinco colônias de abelhas.
Palavras-chave - concentração de açúcares, potencial de mel, produção de flores, produção de néctar, produção de pólen
Introduction
Pumpkins are popular as food and for decoration. In the USA, approximately 340 thousand tons of pumpkins are produced annually, generating an income
of 150 million dollars (Smith 1998). Cucurbita pepo
L., the most cultivated species of pumpkin, is monoecious, the male and female flowers occurring individually in the axils of the leaves in the same plant. The female flower is easily distinguished due to its large ovary at the base of the flower, with a thick style and three stigmatic lobes. The male flower has five stamens with united filaments and anthers (Free 1993). Both flowers produce nectar, but the nectaries differ between the two kinds of flowers. In the male flower the nectary is located at the base of the filaments, and the bees can access the nectar through three pores. In the female flower the nectary is opened forming a ring around the base of the style. Both types of flowers are viable for less than a day, opening in the early morning and closing around midday. The pollen of C. pepo is large (80 to
1. Universidade Federal da Bahia, Escola de Agronomia, Departamento de Zootecnia, 44380-000 Cruz das Almas, BA, Brasil.
2. Universidade de São Paulo, Faculdade de Medicina, Departamento de Genética, 14049-902 Ribeirão Preto, SP, Brasil.
3. Cornell University, Department of Fruit and Vegetable Science, 14853 Ithaca, NY, USA.
4. Cornell University, Department of Entomology, 14853 Ithaca, NY, USA.
150 µm) and sticky, attributes associated with biotic pollen transportation (Velthius 1992).
Nectar secretion is important for attracting insects, favoring the pollination of crops. An adequate supply of nectar of sufficiently high concentration is necessary to induce bees to visit a particular crop. Also production of nectar by the target crop facilitates maintenance of the pollinating colonies. The volume and sugar concentration of nectar vary among plant species (Lanza
et al. 1995) and different varieties of the same species
may also differ greatly in nectar sugar concentration (Free 1993).
The pollen that sticks to the body of the bees during their visits to flowers serves both to pollinate the flowers and as food for the bees. It is essential for normal growth and development of bees, and can also be collected from traps at the entrance of the colony for use as human food.
Pumpkin production is dependent on bee pollination and Tepedino (1981) and Lord (1985) reported an increase in pumpkin production with bee activity increasing. Bees pollinate the pumpkin flowers and receive as a reward the nectar. The ecological studies on amount and quality of these rewards will determine if the colonies can be maintained in large plantings.
The objectives of this work were: a) to investigate nectar production, sugar concentration and nectar re-secretion after its removal, in flowers of C. pepo L.
‘Howden’; b) to determine the amount of pollen produced by pumpkin flowers; and c) to determine the number of flowers per plant produced during the crop cycle.
Material and methods
Experiments were carried out in 1996 and 1997, in field plots on the campus of Cornell University, Ithaca, NY (USA), with pumpkin (C. pepo L. cv. Howden). Seeds of C. pepo L. ‘Howden’ were sown in trays in individual 200 cm3 cells, filled
with 2:1 (v/v) vermiculite:peatmos, supplemented with minerals and maintained in a greenhouse. Twenty days after sowing, the plants were transferred to the field, which was previously (3 weeks before) fertilized with 100 kg ha-1 of
nitrogen in the form of urea. The spacing was 2.00 m between rows by 0.30 m between plants which would give a density of 16,666 plants per hectare. In 1996, 75 plants were cultivated in an area of 45 m2, and in 1997, 100 plants were planted in
60 m2. Flowers were randomly selected before anthesis and
bagged with bridal veil in order to prevent visits from bees and other insects. The following parameters were evaluated: nectar production, sugar concentration in the nectar, nectar recovery, pollen production, and flower production during
the crop cycle. Nectar was collected from male flowers with a 10 µL capillary between 7h and 13h. Female flowers were not included in this study due to the very small number of flowers during the plant cycle, comparing to the male flowers (9 female to 205 male). So, the number of replication for female flowers was very few at each sampling time, and the contribution of female flowers nectar for estimating sugar potential is negligible. Climatic data were recorded at the same time that nectar was collected. The capillary collection technique was essentially the same as that used by Southwick (1983) and Cady (1993).
Nectar production – Nectar production per flower was estimated by measuring the length of the nectar column in the capillary and calculated based on the known volume and length of each capillary (Cruden & Herman 1983). In 1996, the nectar was collected in three days: July 23th, 25th, and 28th. At
each day, the nectar were collected in four periods (7h, 9h, 11h, and 13h) in three different male flowers per period, making a total of 12 flowers per day. So, in three days, a total of 36 flowers were sampled (3 days × 3 flowers × 4 periods = 36 flowers). In 1997, the same procedure was done, but in four days, making a total of 48 male flowers (4 days × 3 flowers × 4 periods = 48 flowers).
Nectar sugar concentration –Sugar concentration in the nectar produced per flower was measured in the field (as sucrose equivalent) using a hand refractometer (American Optical 10431, Buffalo, NY; range concentration 0-50º, BRIX units). This parameter was evaluated in the same flowers used for nectar production. The nectar was collected by capillary and a drop of 5 µL was placed in the refractometer. The reading was rapidly performed to avoid alterations due to evaporation.
Nectar recovery–The replacement, or additional secretion of nectar, after removal by the bees, was evaluated in male flowers on different days and during different periods of the day. This parameter was evaluated on July 16th, 22th, 24th (1996),
and on August 26th, 31st, and September 1st (1997). Each day all
the nectar of three male flowers (bagged with bridal veil, one day before anthesis) was collected at 13h. Other three flowers were bagged and nectar was collected at 3h intervals (7h, 10h and 13h) in order to observe the nectar replacement in the same flowers. The volume of nectar was determined using a capillary tube as previously described.
pollen suspension and all pollen grains were counted under 60X magnification. The total number of pollen grains in the five 50 µL subsamples was used to estimate the total number of grains in 5 mL, which would represent the number of pollen grains per flower. This procedure was based on Weller (1981) and Cruzan (1989), with some modification. Pollen production´s data between two seasons (1996 and 1997) were analyzed following Tukey test.
Number of flowers produced–In 1997, twelve plants were randomly selected to count the number of flowers. Pistillate and staminate flowers were counted every day from the beginning (July 20, 1997) to the end (October 10) of flowering. The number of flowers that appeared was grouped by week, for a total of 12 weeks.
Results
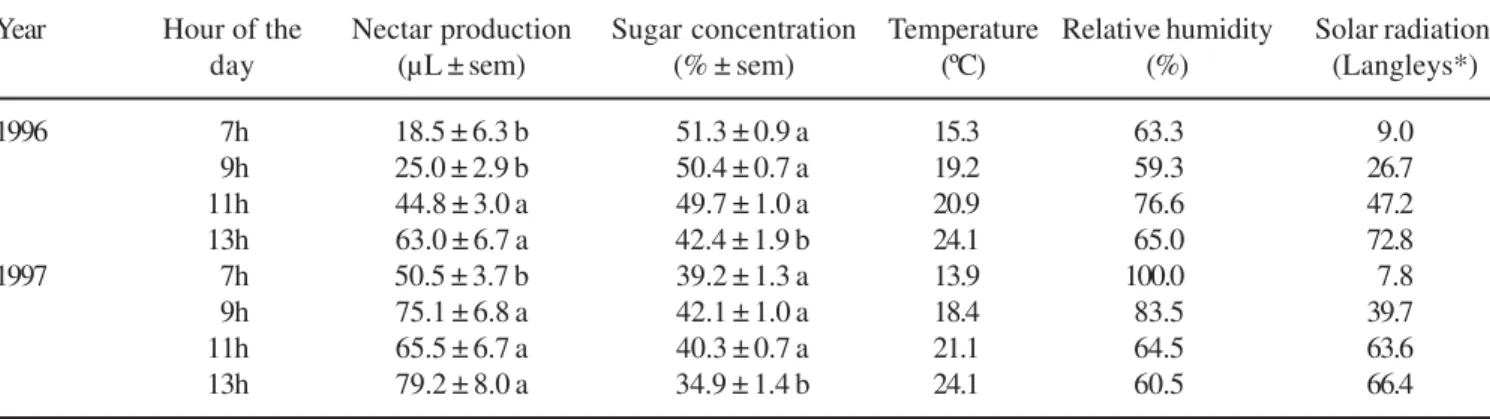
Nectar production, sugar concentration and nectar recovery – In 1996 the quantity of nectar found in male flowers was low at 7h compared to subsequent hours (table 1). The amount of accumulated nectar increased progressively until 13h. In 1997 the lowest amount of nectar also occurred at 7h (table 1). There was also a general increase during the day.
There were no differences in sugar concentration at 7h, 9h, and 11h, in both years (table 1). The average sugar concentration in these three periods was 50.5% ± 0.5% in 1996, and 40.5% ± 0.6% in 1997 (mean ± standard error of the mean). In the last period (13h) the concentration was significantly decreased to 42.4% ± 1.9% in 1996, and to 34.9% ± 1.4% in 1997.
No difference was found between the total daily nectar production measured by only one collection at 13h and that obtained from three collections (7h, 10h and 13h) (figure 1).
Table 1. Nectar production and nectar sugar concentration in male pumpkin (Cucurbita pepo L.) flowers at different times of
day and associated climatic data. The values per period are the mean ± standard error of the mean (sem) of nine flowers in 1996, and 12 flowers in 1997. Ithaca, NY. Means followed by the same letter in columns are equals at P < 0.01 (Tukey test).
* 1 langley = 1 cal cm-2.
Year Hour of the Nectar production Sugar concentration Temperature Relative humidity Solar radiation
day (µL ± sem) (% ± sem) (ºC) (%) (Langleys*)
1996 7h 18.5 ± 6.3 b 51.3 ± 0.9 a 15.3 63.3 9.0
9h 25.0 ± 2.9 b 50.4 ± 0.7 a 19.2 59.3 26.7
11h 44.8 ± 3.0 a 49.7 ± 1.0 a 20.9 76.6 47.2
13h 63.0 ± 6.7 a 42.4 ± 1.9 b 24.1 65.0 72.8
1997 7h 50.5 ± 3.7 b 39.2 ± 1.3 a 13.9 100.0 7.8
9h 75.1 ± 6.8 a 42.1 ± 1.0 a 18.4 83.5 39.7
11h 65.5 ± 6.7 a 40.3 ± 0.7 a 21.1 64.5 63.6
13h 79.2 ± 8.0 a 34.9 ± 1.4 b 24.1 60.5 66.4
Pollen and flowers production – The number of pollen grains per flower in both years was similar, with an average of 43,669 ± 1,382 grains (± sem) (table 2).
The first male flowers started to appear between 25 and 31 DAP - days after planting (week 1) at a rate of 3.3 flowers per plant (figure 2). After this period the production of male flowers increased, reaching a peak in the period between 60 and 66 DAP (week 6) with a rate of 34.5 flowers per plant. This rate decreased until week 12 (102 to 108 DAP), with a rate of 1.8 flowers per plant (figure 2).
The number of female flowers was much smaller than that of male flowers during the entire flowering period (figure 2). The peak number of female flowers was 2.2 flowers per plant, which occurred in the same period (week 6) as the peak number of male flowers. In the peak of flower production the male and female flower ratio was 16:1. During the entire period of flowering the accumulated number of male flowers was much greater than that of female flowers, with a male to female flower ratio of 23:1.
Honey potential – The total amount of honey produced by a plant depends on three factors: a) sugar value, which is the weight of sugar (in mg) secreted by one flower in 24 hours; b) number of flowers per area, and c) number of days in which the flowers are secreting nectar (Crane 1985). Considering, for example, that in 1997 the daily maximum production of nectar was 79 µL, with a mean sugar concentration of 39% (table 1), the estimated sugar value was 30.8 mg per flower in 24 hours. The average number of flowers was 205 (figure 2) and the plant density 16,666 plants ha-1,
Discussion
The results of this work demonstrated that pumpkin flowers produce abundant nectar and pollen, which seem to be available in quantities sufficient to sustain pollinating colonies in large planting.
An increase in the nectar production of male flowers occurred during the day, coinciding with an increase in temperature and solar radiation (table 1). Probably these factors affect nectar production. However the higher temperatures did not provoke an increase in the sugar concentration of the nectar, as would be expected due to evaporation (Nepi et al. 2001),
as the lowest values were observed at 13h, when the temperature was highest (tables 1, 2). Similar outcomes were reported by several authors in other species (Southwick 1983, Pleasants 1983, Jakobsen & Kristiansson 1994, Corbet 2003, Karp et al. 2004). The
most important factors influencing the attractiveness of nectar are its abundance and sugar concentration (Abrol 1990, Free 1993). When the sugar concentration of nectar is below 20% the amount of energy needed to evaporate the water to produce honey may make its collection uneconomical (Free 1993).
The volume of nectar produced by C. pepo L.
‘Howden’ (table 1) is large (63.0 to 79.2 µL flower-1 day-1),
compared with the nectar volume produced by flowers of apple (0.05-0.68 µL) (Abrol 1990), eucalyptus (25 µL) 0
20 40 60 80 100 120 140 160 180
a a
0 20 40 60 80 100 120 140 160 180
a
a
Figure 1. Total daily nectar production determined by only one collection (at 13h) and by three collections (at 7h, 10h, and 13h) from male pumpkin (Cucurbita pepo L.) flowers
(n = 9), in 1996 (A) and 1997 (B). Bars represent standard
error of the mean. Bars followed by the same letter are equal at P > 0.05 (Tukey test). Ithaca, NY, USA.
A
B
one three
Number of collections
Nectar production (µ
L flower
-1 day -1)
Table 2. Number of pollen grains per flower in pumpkin (Cucurbita pepo L.). Mean of four flowers, in 1996 and five
flowers, in 1997, ± standard error of the mean. Means followed by the same letter in columns are equals at P < 0.01 (Tukey
test).
Year Number of pollen per flower
1996 42,765 ± 2,500 a
1997 44,392 ± 1,682 a
Average 43,669 ± 1,382
Figure 2. Mean production of male and female flowers per plant during the cycle of pumpkin (Cucurbita pepo L.).
Average of 12 plants. Bars represent standard error of the mean. Ithaca, NY, USA, 1997. y = Male flowers; U = Female flowers.
Week
Number of flowers
40
35 30
25 20
15 10 5
0
(Buys& Cedenos 1990), alfalfa (0.11-0.40 µL) (Jain 1993) and citrus (20 µL) (Vansell et al. 1942), species that are
important sources of nectar. This is important since
C. pepo flowers are highly dependent on their pollinators
for reproductive success and the attractiveness of the flowers to pollinators depend on the amount of nectar and sugar concentration in the flowers (Karp et al. 2004).
Nectar availability prolongs the time spent by pollinators on a particular flower, apparently increasing the probability of pollen deposition and successful pollination (Manetas & Petropoulou 2000). The high nectar production of
C. pepo is due to the fact that the polysaccharide
component of the nectar is derived from the hydrolysis of previously accumulated starch, while in species that produce little nectar, the polysaccharides are from recent photosynthesis (Nepi & Pacini 1993).
The volume and sugar concentration of nectars are known to vary among plant species and to affect pollinator response to plants. The nectar of the most important melliferous plants in the USA, alfalfa
(Medicago sativa L.) and clover (Trifolium repens
L.) have 15%-29% and 37%-44% sugar, respectively (Free 1993). In Brazil, some important melliferous plants, such as eucalyptus trees (Eucalyptus robusta Sm.) and
apples (Pyrus malus L.) have nectar with sugar
concentrations of 51% (Camargo 1972) and 28%-45% (Abrol 1990), respectively. Our results demonstrate that sugar concentration in C. pepo flowers was high
(35%-45%) compared with these melliferous plants. A relatively high production of nectar (94 µL during the morning) also was observed in C. pepo ‘Greyzini’ (Nepi
et al. 2001). Further investigation, comparing C. pepo
and melliferous plants should be performed to evaluate whether C. pepo can be considered a melliferous
species.
Although pumpkin flowers produce copious nectar with a high sugar concentration a planting has far fewer flowers per hectare (~3 million) than produced by alfalfa (5 billion ha-1) (Tysdal 1946, apud McGregor 1976) and
by clover (1.7 billion ha-1) (Koltowski & Jablonski 1994).
A plant with a smaller number of flowers is spending less energy and nutrients for flowering; therefore, its flowers are containing more nectar (Karp et al. 2004).
The results of this work demonstrate that periodic removal of nectar does not increase the total volume of nectar. Nectar secretion was not stimulated or inhibited by three collections of nectar (figure 1). This was also observed in Ipomopsis aggregata (Pursh) V. E. Grant
(Pleasants 1983), Asclepias syriaca L. (Southwick
1983) and Ligaria cuneifolia (Ruiz & Pav.) Tiegh
(Rivera et al. 1996). On the other hand, removal nectar
from flowers can reduce or stimulate the process of secretion in many plant species. Galetto & Bernadello (1993), comparing three species of Solanaceae, observed that the total nectar production in Nicotiana
longiflora Cav. was reduced by frequent removal, while
nectar production in Aloe castanea (Nicolson & Nepi
2005) and in Tillandsia species (Ordano & Ornelas
2004) was stimulated by nectar removal. Evaluation of the secretion rate of nectar are often an important component of ecological studies of flower-visiting insects, which prolong their time spent on a particular flowers if nectar is available, increasing the probability of pollen deposition and successful pollination. For
C. pepo the nectar production characteristic, in which
nectar removal does not stimulate production, is an disadvantage for a successful pollination, considering that the number of bee visits can be directly related to the presence of nectar during all period of flower life.
The amount of pollen produced did not vary significantly between the two years, with a mean production per flower of 43,669 ± 1,382 grains (table 2). This pollen’s number is higher than in other species such as clover (Trifolium pratense L.), with 267-554 grains
(Szabo & Najda 1985); pear (Pyrus communis L.), with
400-7,000 grains (Stanley & Linskens, 1974); apple
(Malus spp. ‘Fuji’), with 36,445 grains (Dall Orto et al.
1985); and lower than passion fruit (Passiflora edulis
Sims), with 153,674 grains, Cucurbita moschata
Duchesne, with 47,715 grains (Vidal, unpublished data),
and Pedicularis contorta Benth, with 104,000-161,000
grains (Harder 1990).
The amount of pollen found in C. pepo ‘Howden’
was very similar to that observed in C. pepo ‘Wizard’,
by Cady (1993), with 42,400 grains per flower. On the other hand, other C. pepo varieties can produce
10,000-11,000 grains (Free 1993).
These results confirm that pollen production by flower varies among species and can vary among varieties, within the same species, showing that pollen production is regulated by genetic factors. This was also observed by Beri & Anand (1971) who compared 22 wheat varieties and found a variation from 581 to 2,153 grains.
Considering that one pollen grain of C. pepo weighs
1.068 10-6 g (Stanley & Linskens, 1974), then one flower
2A). In this case, 3,114 plants would be necessary to produce 638,298 flowers (or 30 kg of pollen). In the plant density used (16,666 plants ha-1), one hectare would
have enough flowers to produce 160 kg of pollen, which, potentially would provide food for five colonies for one year.
These aspects of nectar and pollen production are important for the honey-producing potential of C. pepo
by bees, and further exploratory investigation will lead to an increased understanding of bee-flower relationship
in C. pepo.
Acknowledgements – The first author thanks to Carlos Augusto Vidal, Dulce Vidal and Ragendra de Sousa who helped in data collection. A special gratitude to Alfredo A.C. Alves for field and lab assistance.
References
ABROL, D.P. 1990. Energetics of nectar production in some apple cultivars as a predictor of floral choice by honeybees. Tropical Ecology 31:116-122.
BERI, S.M. & ANAND, S.C. 1971. Factors affecting pollen shedding capacity in wheat. Euphytica 20:327-332. BUYS, B. & CEDENO, A. 1990. Relationships between
Argentine ants and honeybees in South Africa. In Applied-myrmecology: a world perspective (R.K. Van-der-Meer & K. Jaffe, eds.). Westview Press, Boulder, p.519-524.
CADY, S.W. 1993. Pollination and flowering patterns of field-grown pumpkin (Cucurbita pepo). PhD dissertation, Cornell University, Ithaca.
CAMARGO, J.M.F. 1972. Manual de apicultura. Editora Agronômica Ceres, São Paulo.
CORBET, S.A. 2003. Nectar sugar content: estimating standing crop and secretion rate in the field. Apidologie 34:1-10.
CRANE, E. 1985. O livro do mel. Editora Nobel, São Paulo. CRUDEN, R.W. & HERMANN, S.M. 1983. Studying nectar?
Some observations on the art. In The biology of nectaries (B. Bentley & T. Elias, eds.). Columbia University Press, New York, p.223-241.
CRUZAN, M.B. 1989. Pollen tube attrition in Erythronium grandiflorum. American Journal of Botany 76:562-570. DALL’ORTO, F.A.C., BARBOSA, W., OJIMA, M. &
CAMPOS, S.A.F. 1985. Análise do pólen em dezoito cultivares de macieira. Bragantia 44:421-427.
FREE, J.F. 1993. Insect pollination of crops. Academic Press, San Diego.
GALETTO, L. & BERNADELLO, I. 1993. Nectar secretion pattern and removal effects in three species of Solanaceae. Canadian Journal of Botany 71:1394-1398. HARDER, L.D. 1990. Pollen removal by bumble bees and its implications for pollen dispersal. Ecology 71:1110-1125.
HODGES, D. 1952. The pollen loads of the honeybee: a guide to their identification and form. Bee Research Association, London.
JAIN, K.L. 1993. Anthesis and nectar secretion pattern in alfalfa (Medicago sativa L.). Indian Bee Journal 55:37-41. JAKOBSEN, H.B. & KRISTIANSSON, K. 1994. Influence of temperature and floret age on nectar secretion in Trifolium repens L. Annals of Botany 74:327-334. KARP, K., MÄND, M., STARAST, M. & PAAL, T. 2004.
Nectar production of Rubus arcticus. Agronomy Research 2:57-61.
KOLTOWSKI, Z. & JABLONSKI, B. 1994. Beekeeping value of Persian clover (Trifolium resupinatum) cultivated for seeds. Pszczelnicze-Zeszyty-Naukowe 38:39-47. LANZA, J., SMITH, G.C., SACK, S. & CASH, A. 1995.
Variation in nectar volume and composition of Impatiens capensis at the individual, plant, and population level. Oecologia 102:113-119.
LORD, W.G. 1985. Pollination of horticultural crops in North Carolina. America Bee Journal 125:127-128.
MANETAS, Y. & PETROPOULOU, Y. 2000. Nectar amount, pollinator visit duration and pollination success in the Mediterranean shrub Cistus creticus. Annals of Botany 86:815-820.
MCGREGOR, S.E. 1976. Insect pollination of cultivated crop plants. Agriculture Handbook 496. United States Department of Agriculture, Washington, DC.
NEPI, M. & PACINI, E. 1993. First observations on nectaries and nectar of Cucurbita pepo. Giornale Botanico Italiano 127:1208-1210.
NEPI, M., GUARNIERI, M. & PACINI, E. 2001. Nectar secretion, reabsorption, and sugar composition in male and female flowers of Cucurbita pepo. International Journal of Plant Science 162:353-358.
NICOLSON, S.W. & NEPI, M. 2005. Dilute nectar in dry atmospheres: Nectar secretion patterns in Aloe castanea (Asphodelaceae). International Journal of Plant Sciences 166:227-233.
ORDANO, M. & ORNELAS, J.F. 2004. Generous-like flowers: Nectar production in two epiphytic bromeliads and a meta-analysis of removal effects. Oecologia 140:495-505. PLEASANTS, J.M. 1983. Nectar production patterns in Ipomopsis aggregata (Polemoniaceae). American Journal of Botany 70:1468-1475.
RIVERA, J.G.L., GALETTO, L. & BERNARDELLO, L. 1996 Nectar secretion pattern, removal effects, and breeding system of Ligaria cuneifolia (Loranthaceae). Canadian Journal of Botany 74:1996-2001.
SMITH, F.E. 1998. Field Notes - Specialty Crops? What about Pumpkins! Available: site Southwest Virginia Enterprise (8-July 1998). URL:http://www.wythenews.com/980708/ I-Articles/fa-1.htm. Consulted in 17-I-2000.
STANLEY, R.G. & LINSKENS, H.F. 1974. Pollen: biology biochemistry management. Springer-Verlag, New York. SZABO, T.I. & NAJDA, H.G. 1985. Flowering, nectar secretion
and pollen production of some legumes in the Peace River region of Alberta, Canada. Journal Apicultural Research 24:102-106.
TEPEDINO, V.J. 1981. The pollination efficiency of the squash bee (Peponapis pruinosa) and the honey bee (Apis mellifera) on summer squash (Cucurbita pepo). Journal of Kansas Entomology Society 54:359-377.
VANSELL, G.H., WATKINS, W.G. & BISHOP, R.K. 1942. Orange nectar pollen in relation to bee activity. Journal of Economic Entomology 35:321-323.
VELTHIUS, H.H.W. 1992. Pollen digestion and the evolution of sociality in bees. Bee World 73:77-89.