www.atmos-chem-phys.net/13/6603/2013/ doi:10.5194/acp-13-6603-2013
© Author(s) 2013. CC Attribution 3.0 License.
Atmospheric
Chemistry
and Physics
Geoscientiic
Geoscientiic
Geoscientiic
Geoscientiic
Immersion freezing of water and aqueous ammonium sulfate
droplets initiated by humic-like substances as a function of water
activity
Y. J. Rigg1,*, P. A. Alpert1,*, and D. A. Knopf1
1Institute for Terrestrial and Planetary Atmospheres/School of Marine and Atmospheric Sciences, Stony Brook University,
Stony Brook, New York, USA
*These authors contributed equally to this work.
Correspondence to:D. A. Knopf ([email protected])
Received: 1 February 2013 – Published in Atmos. Chem. Phys. Discuss.: 20 February 2013 Revised: 10 June 2013 – Accepted: 11 June 2013 – Published: 12 July 2013
Abstract. Immersion freezing of water and aqueous
(NH4)2SO4 droplets containing leonardite (LEO) and
Pa-hokee peat (PP) serving as surrogates for humic-like sub-stances (HULIS) has been investigated. Organic aerosol con-taining HULIS are ubiquitous in the atmosphere; however, their potential for ice cloud formation is uncertain. Immer-sion freezing has been studied for temperatures as low as 215 K and solution water activity, aw, from 0.85 to 1.0.
The freezing temperatures of water and aqueous solution droplets containing LEO and PP are 5–15 K warmer than homogeneous ice nucleation temperatures. Heterogeneous freezing temperatures can be represented by a horizontal shift of the ice melting curve as a function of solution aw
by 1aw = 0.2703 and 0.2466, respectively.
Correspond-ing hetrogeneous ice nucleation rate coefficients, Jhet, are
(9.6±2.5)×104and (5.4±1.4)×104cm−2s−1for LEO and PP containing droplets, respectively, and remain constant along freezing curves characterized by1aw. Consequently
predictions of freezing temperatures and kinetics can be made without knowledge of the solute type when relative humidity and ice nuclei (IN) surface areas are known. The acquired ice nucleation data are applied to evaluate differ-ent approaches to fit and reproduce experimdiffer-entally derived frozen fractions. In addition, we apply a basic formulation of classical nucleation theory (α(T )-model) to calculate con-tact angles and frozen fractions. Concon-tact angles calculated for each ice nucleus as a function of temperature,α(T )-model, reproduce exactly experimentally derived frozen fractions without involving free-fit parameters. However, assigning the
IN a single contact angle for the entire population (single-α
model) is not suited to represent the frozen fractions. Ap-plication ofα-PDF, active sites, and deterministic model ap-proaches to measured frozen fractions yield similar good rep-resentations. Furthermore, when using a single parameteriza-tion ofα-PDF or active sites distribution to fit all individual
aw immersion freezing data simultaneously, frozen fraction
curves are not reproduced. This implies that these fitting for-mulations cannot be applied to immersion freezing of aque-ous solutions, and suggests that derived fit parameters do not represent independent particle properties. Thus, from fitting frozen fractions only, the underlying ice nucleation mecha-nism and nature of the ice nucleating sites cannot be inferred. In contrast to using fitted functions obtained to represent ex-perimental conditions only, we suggest to use exex-perimentally derivedJhetas a function of temperature andaw that can be
applied to conditions outside of those probed in laboratory. This is becauseJhet(T )is independent of time and IN surface
areas in contrast to the fit parameters obtained by representa-tion of experimentally derived frozen fracrepresenta-tions.
1 Introduction
radiation through absorption and scattering processes (Chen et al., 2000). Cirrus clouds can account for up to 30 % of total cloud coverage (Wylie et al., 2005) and their impact on the radiative forcing is estimated to have a predominantly warm-ing effect (Chen et al., 2000). Prediction of the atmospheric ice production is challenging since ice particles can form by homogeneous or heterogeneous nucleation (Pruppacher and Klett, 1997). Homogenous ice nucleation refers to ice forma-tion from a supercooled water or aqueous soluforma-tion droplet as opposed to heterogeneous ice nucleation in which ice forma-tion is initiated from a pre-existing substrate acting as an ice nucleus (Pruppacher and Klett, 1997).
Heterogeneous ice nucleation occurs at warmer temper-atures and lower supersaturation with respect to ice than homogeneous ice nucleation (Pruppacher and Klett, 1997). Heterogeneous ice nucleation pathways, also referred to as modes, are as follows: deposition nucleation (the ice forms on the ice nucleus from supersaturated water vapor), immer-sion freezing (the ice forms on the ice nucleus immersed in a supercooled aqueous droplet), condensation freezing (ice forms after water vapor condenses onto the ice nucleus at su-percooled temperatures), and contact freezing (ice formation is induced by collision of supercooled droplets with an ice nucleus) (Pruppacher and Klett, 1997). Ice crystal concen-trations in cirrus clouds impacted by heterogeneous ice nu-cleation are ill defined and remain largely uncertain (Cantrell and Heymsfield, 2005; Forster et al., 2007). Field campaigns in addition to cloud models indicate that immersion freezing can occur under cirrus conditions (Heymsfield et al., 1998; DeMott et al., 1998; Seifert et al., 2003) and that immer-sion and condensation freezing can be important ice nucle-ation pathways within mixed-phase clouds in which super-cooled water droplets and ice particles coexist (Rogers et al., 2001; DeMott et al., 2003; Verlinde et al., 2007; Prenni et al., 2009). Cirrus ice crystal residue analysis and cloud system resolving model studies also indicate that cirrus clouds can either form or are influenced by heterogeneous ice nucleation (Chen et al., 1998; Lohmann et al., 2001; DeMott et al., 2003; K¨archer and Lohmann, 2003; Cziczo et al., 2004; Lohmann et al., 2004; Prenni et al., 2009).
Field measurements have confirmed the presence of or-ganic particulate matter at altitudes in which temperatures favor ice formation (Murphy et al., 1998, 2007; Jost et al., 2004; Froyd et al., 2010). Biomass burning plumes are a large source of both inorganic and organic particles that can reach the upper troposphere/lower stratosphere (Fromm et al., 2010; Hudson et al., 2004; Murphy et al., 2007). Anthro-pogenically emitted organic-containing particles have been shown to possess the potential to act as efficient IN at mixed-phase and cirrus cloud formation conditions (Knopf et al., 2010; Wang and Knopf, 2011; Wang et al., 2012a,b; Baus-tian et al., 2012). Humic-like substances (HULIS) represent multiple organic compounds frequently encountered in atmo-spheric aerosol that can consist of both water soluble and insoluble species (Graber and Rudich, 2006). Biomass
burn-ing is among the sources for atmospheric HULIS (Mukai and Ambe, 1986; Mayol-Bracero et al., 2002; Lukacs et al., 2007; Pio et al., 2008; Lin et al., 2010; Konovalov et al., 2012). Pre-vious studies have indicated that particulate HULIS likely can be associated with ammonium sulfate ((NH4)2SO4)
(Chan and Chan, 2003; Iinuma et al., 2007; Schmidl et al., 2008) and that HULIS surrogates such as Suwannee River standard fulvic acid and leonardite (LEO) can act as efficient deposition IN (Kanji et al., 2008; Wang and Knopf, 2011). Pahokee peat (PP) serving also as a HULIS surrogate has been investigated as potential IN in contact with the surface of a water drop and as immersion IN (Fornea et al., 2009). However, immersion freezing temperatures and correspond-ing ice nucleation kinetics of HULIS surrogates have neither been investigated as a function of solution water activity,aw,
nor applying micrometer-sized aqueous solution droplets. Here we address the question of how the presence of insol-uble and partially solinsol-uble organic material affects ice nucle-ation from aqueous inorganic solution droplets with different
aw. If heterogeneous ice nucleation does not occur, ice
for-mation can commence from concentrated aqueous solutions via homogeneous ice nucleation and can be described byaw
andT, independent of the type of solute (Koop et al., 2000; Knopf and Lopez, 2009; Knopf and Rigg, 2011). Previous studies suggest that the aw-based description of
homoge-neous ice nucleation can also be applied to predict immersion freezing temperatures (Zobrist et al., 2008; Koop and Zobrist, 2009; Alpert et al., 2011a,b; Knopf et al., 2011). K¨archer and Lohmann parameterized immersion freezing by scaling the aw-based homogeneous ice nucleation theory (K¨archer
and Lohmann, 2003). Only one study so far has derived freezing temperatures and heterogeneous ice nucleation rate coefficients applying the aw-based description (Knopf and
Forrester, 2011), thus linking thermodynamic data with ki-netic information similar to theaw-based description of
ho-mogeneous ice nucleation (Koop et al., 2000). In this study we investigate immersion freezing with respect to tempera-ture and nucleation kinetics from micrometer-sized water and aqueous (NH4)2SO4 droplets, representing slightly larger
droplets than observed in the atmosphere (Sassen and Dodd, 1988; Heymsfield et al., 1998; Ansmann et al., 2008), con-taining PP and LEO particles acting as IN forawof 0.85–1.0
and temperatures from 273 to 215 K.
in assessing the underlying processes that govern ice nucle-ation. We first introduce a formulation for heterogeneous ice nucleation founded in classical nucleation theory, but that is independent of the frozen fraction. We assign each ice nu-cleus active at one specific ice nucleating temperature one contact angle,α(α(T )-model) (Pruppacher and Klett, 1997; Zobrist et al., 2007; Wang and Knopf, 2011; Alpert et al., 2011a,b; Knopf and Forrester, 2011). Second, a single con-tact angle,αover similar IN (single-αmodel, Marcolli et al., 2007; L¨u¨ond et al., 2010), is applied. Third, a distribution of αover similar IN (α-PDF model, Marcolli et al., 2007; L¨u¨ond et al., 2010) is assumed. Fourth, it is assumed that ice nucleation is initiated by active sites of different qualities (ac-tive sites model, Marcolli et al., 2007). Lastly, it is assumed that ice nucleation is only dependent on temperature (deter-ministic model, Vali, 1971). For the first time, these different heterogeneous ice nucleation descriptions are applied for im-mersion freezing data spanning a wide range of solutionaw.
2 Experimental
2.1 Droplet sample preparation
Aqueous(NH4)2SO4solutions containing PP and LEO were
prepared for generation of micrometer-sized droplets. These aqueous suspension compositions are given in Table 1. PP and LEO were first crushed using a mortar and pestle. Sub-sequently, the finely crushed and weighted material was im-mersed in a known amount of water, sonicated for 30 min, and manually agitated roughly every 10 min. Humic acid solubility is dependent on humic acid type and solution pH (Graber and Rudich, 2006). PP exhibited a brownish hue within minutes of being sonicated, indicating potential par-tial dissolution in water and aqueous(NH4)2SO4solutions
that may include break up of particulate aggregates. LEO particles accumulated on top of the solutions when not agi-tated. The well mixed suspensions were then filtered through a 5 µm filter. A significant amount of LEO particles, when placed in water, aggregated to form a large mass, which re-mained behind after filtering. From weighing the organic par-ticle residues on the filter, we determined that about 75 % of PP and LEO mass was filtered out. Lastly, a known quan-tity of(NH4)2SO4was added to the suspension, resulting in
an aqueous solution with known PP or LEO and(NH4)2SO4
content as given in Table 1. Prior to application for droplet generation, the aqueous suspensions were sonicated for an additional hour.
A piezo-electric single-droplet dispenser was employed to create single droplets containing LEO and PP on demand (Alpert et al., 2011a,b; Knopf and Rigg, 2011). For each sample 30–60 droplets were placed on a hydrophobic coated glass plate (Knopf and Lopez, 2009; Knopf and Rigg, 2011). The sample was introduced into an aerosol conditioning cell (ACC) that allows droplet exposure to controlled relative
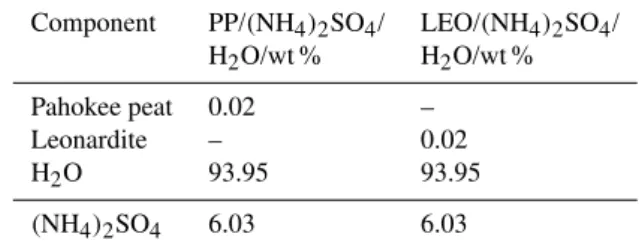
Table 1.Composition of Pahokee peat (PP) and leonardite (LEO) containing aqueous ammonium sulfate droplets employed in ice nu-cleation experiments.
Component PP/(NH4)2SO4/ LEO/(NH4)2SO4/
H2O/wt % H2O/wt %
Pahokee peat 0.02 –
Leonardite – 0.02
H2O 93.95 93.95
(NH4)2SO4 6.03 6.03
humidity (RH), as outlined in detail in our previous stud-ies (Knopf and Lopez, 2009; Knopf and Rigg, 2011; Alpert et al., 2011a,b). In short, this is achieved by flowing humid-ified N2 gas with known dew point temperature,Td, as
de-termined by a chilled mirror hygrometer, above the droplets. The uncertainty ofTdis<±0.15 K. FromTdand the droplet
temperature,Tdrop, RH=
pH2O(Td)
p0
H2O(Tdrop) can be derived (Murphy and Koop, 2005). The uncertainty inTdropis±0.1 K. Droplet
conditioning is conducted at droplet temperatures of 291– 294 K. The ACC is calibrated by determination of the ice melting point and deliquescence relative humidities of var-ious inorganic salts (Knopf and Koop, 2006; Knopf, 2006; Knopf and Lopez, 2009; Knopf and Rigg, 2011). The re-sulting uncertainty in aw is ±0.01. At equilibrium,
ambi-ent RH equals solution aw (Koop et al., 2000), which
re-sults in droplets with diameters ranging from 20 to 80 µm of identical composition (Knopf and Lopez, 2009; Knopf and Rigg, 2011). After conditioning, the droplet sample is sealed against the environment by using a second hydrophobically coated glass slide serving as a cover and a tin foil spacer coated with high-vacuum grease. Hence, droplet composition is fixed for the remainder of the experiments according to the conditioning procedure. Subsequent ice nucleation exper-iments in which the aerosol sample is cooled will not signif-icantly change droplet composition, since the amount of wa-ter vapor within the sealed aerosol sample that can condense onto the droplets is negligible compared to the amount of the condensed-phase water (Koop et al., 1998; Knopf et al., 2002; Knopf and Lopez, 2009). All sample preparation steps were done on a clean bench, thereby reducing the possibility of contamination from airborne particles (Knopf and Lopez, 2009; Knopf and Rigg, 2011).
Optical microscopy applying objectives with up to 100× magnification coupled to a CCD camera and digital imag-ing analysis software confirmed the presence of PP and LEO particles within the micrometer-sized water and aqueous
(NH4)2SO4solution droplets. For estimation of PP and LEO
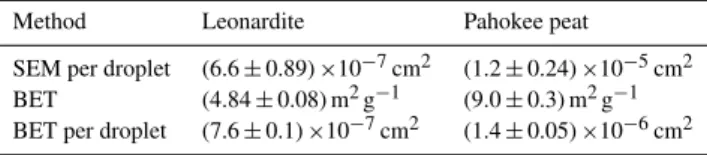
Table 2. Surface area estimates applying analysis of scanning electron microscopy (SEM) images and Brunauer–Emmett–Teller (BET) gas adsorption technique.
Method Leonardite Pahokee peat
SEM per droplet (6.6±0.89)×10−7cm2 (1.2±0.24)×10−5cm2 BET (4.84±0.08) m2g−1 (9.0±0.3) m2g−1 BET per droplet (7.6±0.1)×10−7cm2 (1.4±0.05)×10−6cm2
(SEM) imaging analysis further corroborated the presence of organic particles within the generated droplets and allowed for estimation of PP and LEO surface areas. Surface area estimates derived from 10 droplets are given in Table 2. In addition, surface areas of PP and LEO were determined us-ing the Brunauer–Emmett–Teller (BET) gas adsorption tech-nique (Brunauer et al., 1938). Both PP and LEO preparation for the BET analysis involved crushing the organic material using a mortar and pestle. The resulting BET-determined sur-face areas are given in Table 2, indicating that PP exhibits almost double the surface area per weight compared to LEO, similar to the findings of a previous study (Hanzl´ık et al., 2004). For LEO, SEM- and BET-estimated surface areas are very similar. However, for PP, the SEM-based surface area estimates are about a factor of 8 larger than the ones derived from BET analysis. A possible reason for this difference is that PP and LEO remain anhydrous when examined by BET and thus their macromolecular size and orientation remains mostly unchanged. However, for SEM-derived surface areas, these particles are placed in water and parts of these macro-molecules may dissolve or rearrange, thereby altering their size, orientation, or lead to breakup of particulate aggregates with subsequent effects on the visible condensed-phase sur-face area. For the remainder of this work, we apply the BET-obtained surface areas for ice nucleation analysis.
2.2 Ice nucleation apparatus
The experimental setup is based on our previous studies (Knopf, 2006; Knopf and Lopez, 2009; Knopf and Rigg, 2011; Knopf and Forrester, 2011; Alpert et al., 2011a,b) and only described briefly here. The ice nucleation apparatus consists of a cryo-cooling stage coupled to an optical micro-scope equipped with digital imaging analysis, which allows controlled cooling and heating of the droplets. Ice nucleation was investigated applying a cooling rate of 10 K min−1until all droplets froze. Subsequently, corresponding ice melting points were determined using a heating rate of 0.5 K min−1. The temperature is calibrated by measuring known melt-ing points of ice and various organic species (Knopf, 2006; Knopf and Lopez, 2009; Knopf and Rigg, 2011). The tem-perature uncertainty is±0.1 K. For aqueous (NH4)2SO4
so-lutions it has been shown experimentally and by thermo-dynamic models (Bertram et al., 2000; Knopf and Lopez, 2009; Clegg et al., 1998) thataw does not change
signifi-cantly with temperature for the investigated aw range. For
this reason, dropletawand corresponding uncertainty as
de-fined by the droplet conditioning procedure apply to the ice nucleation experiments observed at lower temperatures. Ev-ery 0.2 K during the freezing and melting cycles an image is recorded that contains experimental time and temperature. For each investigatedaw, at least two independently prepared
droplet samples were applied. Each droplet sample was used twice for observation of freezing and melting events. This re-sults in a total of at least 1600 individually analyzed freezing and melting events. Once the experiment is completed, the freezing and melting temperatures of each droplet in a single experiment are determined.
2.3 Chemicals
N2 (99.999 %) was purchased from Praxair. (NH4)2SO4
(99.95 %) was purchased from Alfa Aesar. Humic acid ref-erence Pahokee peat (1R103H) and humic acid standard leonardite (1S104H) were purchased from the International Humic Substances Society (IHSS). Millipore water (resistiv-ity≥18.2 Mcm) was used for preparation of aqueous so-lutions.
3 Results and discussion
3.1 Experimentally derived freezing temperatures
Median freezing temperatures with 10th and 90th percentiles of water and aqueous(NH4)2SO4droplets containing LEO,
˜
TfLEO, and PP, T˜fPP, particles are shown in Fig. 1a and b, respectively, as a function ofT and aw defined at droplet
preparation conditions. Since direct measurements ofawfor
supercooled aqueous(NH4)2SO4droplets do not exist, we
assume thataw does not change significantly with
decreas-ing T (Knopf and Lopez, 2009). Within the experimental uncertainty, mean melting temperatures of water and aque-ous (NH4)2SO4 droplets containing LEO and PP are in
good agreement with the ice melting curve (Koop et al., 2000; Clegg et al., 1998). Agreement of measured ice melt-ing temperatures with expected meltmelt-ing points (Koop and Zobrist, 2009; Clegg et al., 1998) indicates negligible ef-fects on droplet aw and composition due to the presence
of LEO or PP. T˜fLEO andT˜fPP and corresponding melting points as a function of(NH4)2SO4wt % content are given in
rate is negligible at these heterogeneous freezing tempera-tures and droplet volumes (Koop et al., 2000).
Figure 1 shows the predicted homogeneous freezing curves that are adjusted for the average droplet diameter of our samples representingJhom=2.18×106cm−3s−1(Koop
and Zobrist, 2009). T˜fLEO and T˜fPP are about 5 to 15 K warmer than homogeneous freezing temperatures for high to lowaw indicating the ice nucleation efficiency of LEO and
PP. At determined freezing temperatures andaw<1, these
HULIS surrogates may be in a solid (glassy) state, as inferred by a previous study employing fulvic acid particles as IN (Young and Leboeuf, 2000; Koop and Zobrist, 2009; Wang et al., 2012a). Furthermore, the measured freezing points fol-low a similaraw dependency as the homogeneous freezing
curve. Hence, we representT˜fLEO andT˜fPPby a shifted ice melting curve as suggested by previous studies (Zuberi et al., 2002; Archuleta et al., 2005; Cantrell and Robinson, 2006; Zobrist et al., 2008; Koop and Zobrist, 2009; Knopf et al., 2011; Knopf and Forrester, 2011; Alpert et al., 2011a,b). These heterogeneous ice nucleation curves are constructed by fittingT˜fto
awhet(T˜f)=awice(T )+1aw,het, (1)
whereaicew (T ) represents the thermodynamically given ice melting curve (Koop and Zobrist, 2009) and1aw,het is the
only free parameter. The best fit yields for LEO-containing particles1aLEOw,het=0.2703, as indicated by the solid line in Fig. 1a. PP nucleates ice at higher temperatures compared to LEO, resulting in a lower1appw,het=0.2466, which is shown as the solid line in Fig. 1b. Within experimental uncertainties both data sets are well represented by the modifiedaw-based
ice nucleation approach, which is thus sufficient to describe and predict immersion freezing temperatures of LEO and PP particles in water and aqueous(NH4)2SO4 droplets. Koop
and Zobrist (2009) found that 1aw,het does not depend on
solute type. Similarly, we suggest that onlyaw, and thus RH,
can be applied as a valid description of immersion freezing induced by LEO and PP independent of the nature of the so-lute.
3.2 Kinetic analysis of freezing data
The freezing data are analyzed applying five different de-scriptions of the parameters governing ice nucleation. First it is assumed that each ice nucleation event occurring at a specific temperature can be described by a corresponding contact angle, α, between the ice nucleus and the ice em-bryo, which we termα(T )-model (Zobrist et al., 2007; Knopf and Forrester, 2011; Wang and Knopf, 2011; Alpert et al., 2011a,b). This implies that α varies with temperature and does not represent a fixed parameter for similar IN. Second, a single contact angle is attributed among similar IN, termed single-α model (Marcolli et al., 2007; L¨u¨ond et al., 2010). Third, a probability density function (PDF) to distributeα
among similar IN is applied, termedα-PDF model (Marcolli
200 210 220 230 240 250 260 270 280
200 210 220 230 240 250 260 270 280
T/K
0.86 0.88 0.9 0.92 0.94 0.96 0.98 1.0
0.86 0.88 0.9 0.92 0.94 0.96 0.98 1.0
200 210 220 230 240 250 260 270 280
0.86 0.88 0.9 0.92 0.94 0.96 0.98 1.0
0.86 0.88 0.9 0.92 0.94 0.96 0.98 1.0
(a) (b)
aw
Fig. 1.Experimentally derived median freezing temperatures with 10th and 90th percentiles and mean melting temperatures with±1σ of leonardite in water and aqueous(NH4)2SO4droplets(a), and
Pa-hokee peat in water and aqueous(NH4)2SO4droplets(b)are shown
as a function ofaw determined at particle preparation conditions.
Ice melting and homogeneous freezing curves are plotted as dashed and dotted lines, respectively (Koop and Zobrist, 2009). The ho-mogeneous freezing curve representsJhom=2.18×106cm−3s−1.
The solid lines are best fits based on the data in which the ice melt-ing curves are shifted by1aw=0.2703 for leonardite in(a)and by
1aw=0.2466 for Pahokee peat in(b). The derived freezing curves
representJhetexp=(9.6±2.5)×104and(5.4±1.4)×104cm−2s−1 for leonardite(a)and Pahokee peat(b), respectively. It is assumed thatawdoes not change with temperature.
et al., 2007; L¨u¨ond et al., 2010). Fourth, randomly sampled ice nucleating sites with the same surface area but differentα
are distributed on each of the IN surfaces, termed active sites model (Marcolli et al., 2007; L¨u¨ond et al., 2010). Lastly, it is assumed that ice nucleation does not significantly depend on time, and thus ice nucleation can be described as a func-tion of temperature and IN surface areas only, termed the de-terministic model (Vali, 1971; Alpert et al., 2011a,b). These ice nucleation descriptions have been derived and discussed in detail in previous literature (Zobrist et al., 2007; Alpert et al., 2011a,b; Marcolli et al., 2007; L¨u¨ond et al., 2010). The correctness of the underlying mathematical analysis applied here using single-α, α-PDF, active sites, and deterministic model described below has been validated by reproduction of the results by L¨u¨ond et al. (2010). It should be noted that a constant cooling rate is applied in our experiments and that the frozen and unfrozen number of droplets and correspond-ing nucleation time and temperature are known for each in-vestigated temperature interval throughout the entire experi-ment.
3.2.1 Derivation of heterogeneous ice nucleation rate coefficients
Each individually observed freezing event occurring at tem-peratureT is analyzed to yield a heterogeneous ice nucle-ation rate coefficient,Jhetexp(T ), andα(T ).Jhet is calculated
(Zobrist et al., 2007; Knopf and Forrester, 2011; Alpert et al., 2011a,b):
JhetexpTi= n
i
nuc
ttoti ·Ai , (2)
whereninuc is the number of freezing events,ttoti ·Ai is the product of the total observation time and surface area, and
Tiis the mean ice nucleation temperature in thei-th temper-ature interval. The productttoti ·Aiis the sum of the contribu-tion from the droplets that remain liquid and those that freeze according to
ttoti ·Ai=1T
cr A
i
rm+
ni
nuc X
j=1
1 cr
Tsti−Tnuc,i jAij, (3)
where cr is the experimental cooling rate, Airm is the total surface area remaining until the end of the temperature in-terval,Tsti is the start of the temperature interval, andTnuc,i j
andAij are the freezing temperature and corresponding ice nucleus surface area, respectively, of thej-th droplet nucle-ating ice within the i-th interval. Derivations of Jhetexp(Ti)
employ1T =0.2 K. It should be noted that no further as-sumptions or information such as the diffusion coefficient of water in supercooled aqueous solutions, interfacial surface tensions between ice nucleus and surrounding medium, dis-tribution of contact angles, or active sites are employed to deriveJhetexp(T ), but only the number of freezing events are counted and related to the available IN surface areas and time the droplets stay liquid. Hence, this analysis of the underly-ing nucleation kinetics is solely based on experimental data omitting any prescribed or fitted parameters.
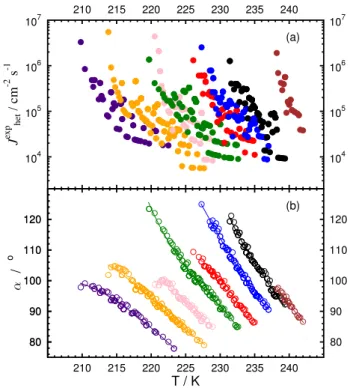
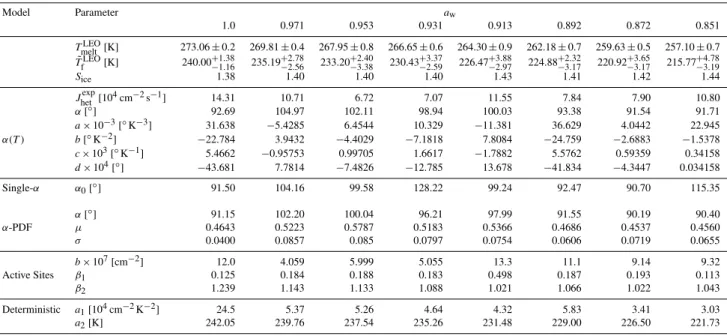
Figures 2a and 3a show experimentally derived Jhetexp as a function ofT andawfor LEO and PP containing droplets,
respectively. For each dropletaw, Jhetexp increases
exponen-tially with decreasingT. For a givenaw, a temperature
de-crease of about 10 K results in an inde-crease ofJhetexp by over 2 orders of magnitude. It should be noted that homogeneous ice nucleation is unlikely to have affected derivedJhetsince
mogeneous ice nucleation rates 1–2 K above the expected ho-mogeneous freezing curve shown in Fig. 1 are too slow to in-duce freezing under applied experimental timescales (Koop et al., 2000). A summary ofJhetexpvalues for eachawderived
atT˜fis given in Tables 3 and 4 for LEO and PP, respectively,
and indicate thatJhetexp(T˜f)are almost constant, changing by
only about a factor of 2 along the corresponding freezing curve (Fig. 1) constructed by shifting the ice melting curve by its respective1aw,het. Thus, both of the experimentally
determined freezing curves can be assigned a constantJhetexp
value similar to the findings of theaw-based homogeneous
ice nucleation description (Koop et al., 2000; Koop and Zo-brist, 2009). Determined atT˜f,J
exp
het are(9.6±2.5)×104and (5.4±1.4)×104cm−2s−1 for the freezing curves of LEO and PP containing droplets, respectively.
104 105 106 107
J
ex
p het
/c
m
-2
s
-1
104 105 106 107
210 215 220 225 230 235 240
80 90 100 110 120
80 90 100 110 120
/
o
80 90 100 110 120
210 215 220 225 230 235 240
T / K
(a)
(b)
Fig. 2. (a) shows experimentally derived heterogeneous ice nu-cleation rate coefficients,Jhetexp, and(b)corresponding contact an-gles,α, of leonardite / water and aqueous leonardite /(NH4)2SO4
droplets shown as a function of temperature andaw. Brown, black,
blue, red, green, pink, orange, and purple circles represent the ini-tialawof 1.00, 0.971, 0.953, 0.931, 0.913, 0.892, 0.872, and 0.851,
respectively. Lines indicate a third-order polynomial fit.
3.2.2 α(T )-model
Experimentally derived values ofJhetexp are used to calculate
α, which represents the contact angle between the ice nucleus and the ice embryo in an aqueous medium (Zobrist et al., 2007).αis derived from the compatibility factor,fhet, which
describes the reduction in Gibbs free energy of formation compared to homogeneous ice nucleation,1Gact(T ), due to
the presence of an ice nucleus according to (Pruppacher and Klett, 1997)
fhet=
1
4(2+cosα)(1−cosα)
2. (4)
Anfhetvalue of 1, corresponding toα=180◦, indicates no
reduction in Gibbs free energy equivalent to homogeneous ice nucleation; that is, the ice nucleus does not enhance the ice nucleating abilities of the bulk phase, and a value of 0◦ implies perfect compatibility between the ice nucleus and the ice embryo, yielding vanishing Gibbs free energy (Prup-pacher and Klett, 1997; Zobrist et al., 2007). The derivation offhetfollows previous studies (Zobrist et al., 2007; Knopf
and Forrester, 2011; Alpert et al., 2011a,b) and is only briefly introduced here.fhet is calculated from experimentally
Table 3.Immersion freezing from water and aqueous ammonium sulfate particles containing leonardite (LEO). The following are given as a function of solution water activity,aw: mean melting temperature (TmeltLEO,±1σ), median freezing temperature (T˜fLEO, with 10th and 90th
percentiles), supersaturation with respect to ice (Sice, atT˜fLEO); heterogeneous ice nucleation rate coefficient (Jhetexp, atT˜fLEO), contact angle αatT˜fLEO, and fit parameters forα(T ), single-α,α-PDF, active sites, and deterministic model.
Model Parameter aw
1.0 0.971 0.953 0.931 0.913 0.892 0.872 0.851
TmeltLEO[K] 273.06±0.2 269.81±0.4 267.95±0.8 266.65±0.6 264.30±0.9 262.18±0.7 259.63±0.5 257.10±0.7 ˜
TfLEO[K] 240.00+−11..3816 235.19−+22..7856 233.20+−32..4038 230.43+−32..3759 226.47−+32..8897 224.88−+23..3217 220.92−+33..6517 215.77+−43..7819
Sice 1.38 1.40 1.40 1.40 1.43 1.41 1.42 1.44
Jhetexp[104cm−2s−1] 14.31 10.71 6.72 7.07 11.55 7.84 7.90 10.80
α[◦] 92.69 104.97 102.11 98.94 100.03 93.38 91.54 91.71
a×10−3[◦K−3] 31.638 −5.4285 6.4544 10.329 −11.381 36.629 4.0442 22.945
α(T ) b[◦K−2] −22.784 3.9432 −4.4029 −7.1818 7.8084 −24.759 −2.6883 −1.5378
c×103[◦K−1] 5.4662 −0.95753 0.99705 1.6617 −1.7882 5.5762 0.59359 0.34158
d×104[◦] −43.681 7.7814 −7.4826 −12.785 13.678 −41.834 −4.3447 0.034158
Single-α α0[◦] 91.50 104.16 99.58 128.22 99.24 92.47 90.70 115.35
α[◦] 91.15 102.20 100.04 96.21 97.99 91.55 90.19 90.40
α-PDF µ 0.4643 0.5223 0.5787 0.5183 0.5366 0.4686 0.4537 0.4560
σ 0.0400 0.0857 0.085 0.0797 0.0754 0.0606 0.0719 0.0655
b×107[cm−2] 12.0 4.059 5.999 5.055 13.3 11.1 9.14 9.32
Active Sites β1 0.125 0.184 0.188 0.183 0.498 0.187 0.193 0.113
β2 1.239 1.143 1.133 1.088 1.021 1.066 1.022 1.043
Deterministic a1[104cm−2K−2] 24.5 5.37 5.26 4.64 4.32 5.83 3.41 3.03
a2[K] 242.05 239.76 237.54 235.26 231.48 229.00 226.50 221.73
Table 4.Immersion freezing from water and aqueous ammonium sulfate particles containing Pahokee peat (PP). The following are given as a function of solution water activity,aw: mean melting temperature (TmeltPP,±1σ), median freezing temperature (T˜fPP, with 10th and 90th
percentiles), supersaturation with respect to ice (Sice, atT˜fPP); heterogeneous ice nucleation rate coefficient (J exp
het, atT˜fPP), contact angleα
atT˜fPP, and fit parameters forα(T ), single-α,α-PDF, active sites, and deterministic model.
Model Parameter aw
1.0 0.981 0.964 0.947 0.926 0.901 0.883 0.862
TmeltPP [K] 272.94±0.1 270.91±0.3 268.83±0.3 267.38±0.3 265.49±0.4 262.49±0.5 260.96±0.6 257.82±0.5 ˜
TPP
f [K] 242.57+
3.0
−2.6 242.07+ 3.37
−2.78 238.55+ 2.63
−2.08 237.85+ 2.77
−2.19 234.39+ 2.74
−2.04 229.51+ 2.72
−2.18 225.48+ 2.57
−4.33 219.96+ 3.12
−4.17
Sice 1.35 1.33 1.34 1.33 1.35 1.37 1.40 1.42
Jhetexp[104cm−2s−1] 3.60 4.73 4.68 5.79 6.59 5.78 8.11 3.89
α[◦] 84.51 86.77 89.45 83.21 84.44 85.54 86.98 90.35
a×10−3[◦K−3] 2.3951 1.1471 17.810 12.377 13.111 −93.389 10.971 32.564
α(T ) b[◦K−2] −1.6356 −0.78175 −1.2775 −8.8617 −0.92924 6.3971 −7.3661 −2.1540
c×103[◦K−1] 0.36770 0.17371 3.0516 2.1123 0.21714 −1.4626 1.6463 0.47296
d×105[◦] −0.27053 −12.426 −2.4266 −1.6755 −0.16642 1.1171 −1.2239 −0.34383
Single-α α0[◦] 83.92 85.51 88.33 82.29 83.32 84.65 85.97 88.25
α[◦] 83.75 85.33 87.51 81.89 82.53 84.86 85.70 88.77
α-PDF µ 0.3796 0.3983 0.4235 0.3571 0.3650 0.3927 0.4026 0.4378
σ 0.0678 0.0877 0.0678 0.0675 0.0626 0.0490 0.0523 0.0707
b×108[cm−2] 2.9827 2.9022 2.3871 3.0485 3.0864 3.0058 3.0146 3.0864
Active Sites β1 1.3601 1.0697 0.9500 0.8580 0.6810 0.7248 0.7443 0.8008
β2 0.9075 0.9507 0.9899 0.9577 1.0062 1.0143 1.0155 1.0296
Deterministic a1[104cm−2K−2] 2.59 3.43 4.25 4.00 4.75 6.07 4.38 1.78
Jhet(T , α)= kT
h exp
−1FkTdiff(T )
nexp
−1Gact(T )fkT het(α)
,(5) wherekandhare the Boltzmann and Planck constants, re-spectively,nis the number density of water molecules at the ice-nucleus–water interface, and1Fdiff(T )is the diffusion
activation energy of a water molecule to cross the water–ice-embryo interface (Pruppacher and Klett, 1997). 1Fdiff(T )
and1Gact(T )are dictated by the properties of the aqueous (NH4)2SO4 solution such as water diffusivity, DH(NH2O4)2SO4,
and the solid–liquid interfacial tension of the ice embryo,
σ(NH4)2SO4
sl , respectively (Zobrist et al., 2007; Knopf and
For-rester, 2011; Alpert et al., 2011a,b). In the case of LEO and PP containing water droplets,DH2O
H2O (Smith and Kay, 1999) andσH2O
sl are applied following Zobrist et al. (2007).
Tanaka (1975) experimentally determinedD(NH4)2SO4
H2O for
aqueous (NH4)2SO4 solutions 0.75–6.46 wt % in
concen-tration at 298 K and at temperatures 278–308 K for an aqueous (NH4)2SO4 solution 0.75 wt % in concentration.
The change in diffusion coefficients with T of pure water,
DH2O
H2O(Smith and Kay, 1999) andD
(NH4)2SO4
H2O determined by Tanaka (1975) are very similar. We assume a similar tem-perature dependence is also true for aqueous(NH4)2SO4
so-lutions of higher concentrations typical of our investigated aqueous (NH4)2SO4 droplets. Hence, we use DHH22OO(T ) to describeD(NH4)2SO4
H2O (T ). As previously discussed, potential uncertainties arising usingDH2O
H2O are expected to be negligi-ble as1Fdiffis proportional to
dlnD(NH4)2SO4 H2O (T )
dT (Knopf and
Forrester, 2011; Alpert et al., 2011b). Thus, uncertainties in
D(NH4)2SO4
H2O are expected to have a small effect onJhet (and thus onα) since the derivative with respect to temperature is not expected to change significantly.
The derivation of 1Gact(T ) for aqueous (NH4)2SO4 is
dependent upon σ(NH4)2SO4
sl , which has yet to be
exam-ined for the supercooled temperature region. For this rea-son, σ(NH4)2SO4
sl (T ) is derived for each aw from the aw
-based homogeneous ice nucleation description as previ-ously discussed in detail (Alpert et al., 2011b). In short,
σ(NH4)2SO4
sl (T )is calculated from Eq. (5) settingfhet=1 and
and replacingnfornv, which describes the volume number
density of water molecules in liquid water and correspond-ingJhom(1aw,het)from theaw-based homogeneous ice
nu-cleation description (Koop et al., 2000; Koop and Zobrist, 2009).
Figures 2b and 3b show α as a function of T and aw
for LEO and PP containing water and aqueous(NH4)2SO4
droplets, respectively. As temperature decreases by about 10 K,αincreases by approximately 20◦. Furthermore, for the same freezing temperatures,αvaries for differentaw
indicat-ing the effect of the solute on the water hydrogen bondindicat-ing network (Knopf and Rigg, 2011; Alpert et al., 2011b) and
104 105 106 107
J
ex
p het
/c
m
-2
s
-1
104 105 106 107
215 220 225 230 235 240 245 250
70 80 90 100 110
70 80 90 100 110
/
o
70 80 90 100 110
215 220 225 230 235 240 245 250
T / K
(a)
(b)
Fig. 3. (a)shows experimentally derived heterogeneous ice nucle-ation rate coefficients,Jhetexp, and(b)corresponding contact angles, α, of Pahokee peat/water and aqueous Pahokee peat/(NH4)2SO4
droplets shown as a function of temperature andaw. Brown, black,
blue, red, green, pink, orange, and purple squares represent the ini-tialawof 1.00, 0.981, 0.964, 0.947, 0.926, 0.901, 0.883, and 0.862,
respectively. Lines indicate a third-order polynomial fit.
thus on the ice nucleation process. Evaluated atT˜f,αis given
in Tables 3 and 4 for LEO and PP, respectively. We also rep-resentα(T ) as a third-order polynomial fit, valid over the experimentally applied temperature range shown in Figs. 2b and 3b. Corresponding fit parameters are listed in Tables 3 and 4.
keeping the contact angle constant for all temperatures and varying the pre-exponential factor in Eq. (5) does not im-prove the representation ofJhet with temperature compared
to the implementation of a contact angle that varies with tem-perature. Lastly, we have determined that when keeping the contact angle constant, σsl increases with decreasing T in
contrast to expected behavior (Pruppacher and Klett, 1997; Zobrist et al., 2007; Alpert et al., 2011b; Welti et al., 2012), further supporting a temperature-dependent contact angle ex-hibiting increasing contact angles with decreasing tempera-tures.
Jhetcan be derived for a specific freezing temperature
us-ing laboratory-determined α(T ), and Eq. (5) yielding the heterogeneous ice nucleation rate coefficient as a continu-ous function ofT,Jhetα (T ).Jhetα (T ) can then be applied to predict ice nucleation rates or frozen fractions for IN sur-face areas and nucleation (cloud activation) times that were not probed in the laboratory. This is corroborated by the comparable results inJhetexp(T ),Jhetα (T ), andα(T )between Zobrist et al. (2007), who used smaller IN surface areas, faster cooling rates, and observed lower freezing tempera-tures compared to the study by Knopf and Forrester (2011), who used larger surface areas, slower cooling rates, and ob-served higher freezing temperatures. These results allude to homogeneous ice nucleation, where the freezing rate scales with the volume and nucleation time (Pruppacher and Klett, 1997; Koop, 2004).
For each temperature interval,i, the frozen fraction can be derived. The experimentally derived cumulative frozen frac-tion for the entire freezing temperature range is given by
f (Ti)=
P
iNfi Ntot
, (6)
whereNfi is the number of frozen droplets in thei-th tem-perature interval at Ti with width 1T, and Ntot is the
to-tal number of droplets; both parameters are readily available from the experimental data. The experimentally derived cu-mulative frozen fractions are shown in Figs. 4 and 5. At the median, i.e., f =0.5, 50 % of all investigated droplets are frozen.
We can now reproduce the cumulativef (T )using Jhetexp
derived from Eq. (2), i.e., directly from experimental data, or by usingα(T ), i.e.,Jhetα . We can express the change in the number of unfrozen droplets per temperature intervalias
Nufi
dt = −Jhet(T )AN
i
uf, (7)
whereNufi represents the number of unfrozen droplets re-maining after cooling beyond the temperature intervaliand
Ais the mean ice nucleus surface area. With dt=dcrT and integration fromNtottoNufi yields
Nufi Ntot =
exp
−
A
cr
Ti
Z
Tmelt
Jhet(T )dT
. (8)
The number of frozen droplets of temperature intervali is given asNfi=Ntot−Nufi. Applying this to the previous
equa-tion results in
Nfi Ntot =
f (T )=1−exp
−
A cr
Ti
Z
Tmelt
Jhet(T )dT
. (9)
It is with no surprise that application of experimentally de-rivedJhetexp(T )reproduces experimentally derivedf exactly as shown by the crosses in Figs. 4 and 5 since its derivation is based on the very same data set. (Very minor differences are due to the application ofAand mean temperature of the
i-th temperature interval.)
As mentioned above Jhetexp(T˜f)are almost constant along
the freezing curve and thus with1aw,het. However, this fact
is not only true atT˜fwheref=0.5, but for every frozen
frac-tion value. Upon closer inspecfrac-tion of Figs. 2a and 3a note that
Jhetexpspan a similar range of values for the different investi-gatedaw. Frozen fraction values at eachawsuperimposed on Jhetexpmatch exactly, and in turn, the lowest and highestJhetexp
values correspond to frozen fractions between 0 and 1. In other words, this indicates that any1aw,het that falls within
the range of our experimental data can be assigned a single
Jhetexp value, further corroborating theaw-based approach to
describe freezing temperatures and time-dependent kinetics. We can now useJhetα (T )to reproducef. These results are also given in Figs. 4 and 5 and show overall very good agree-ment with the experiagree-mental data, as indicated by the root-mean-square error (RMSE) being smaller than 0.1 for most cases.f derived by the continuous functionJhetα (T )deviates in two cases at lowawsignificantly from experimentally
de-rivedf. This is due to the application of a fittedα(T )curve that results in a continuous Jhetα (T ). However, Jhetα (T ) can deviate by half an order of magnitude from experimentally derivedJhetexp, depending on the scatter of the data. When cal-culating and integrating the cumulativef, this deviation in
Jhetat the beginning (high freezing temperatures) propagates
through the whole data set, which leads to this apparently lesser fit quality. Again, this is not a problem of the model it-self, sincef derived fromJhetexpagrees almost perfectly with experimentally derivedf, but is a matter of howα(T )is fit-ted. The experimentally derivedf do not depend onJhetand
on assumptions of the water diffusion coefficient and ice– liquid interfacial tension in contrast to application ofJhetα (T )
to derivef.
3.2.3 α-PDF model
The ice nucleation data are analyzed applying the α-PDF model following the studies by Marcolli et al. (2007) and L¨u¨ond et al. (2010). A probability density function (PDF) is applied to distributeαamong the IN in the immersed droplets for each investigated aw. Jhet depends onα, which in this
0.0 0.1 0.2 0.3 0.4 0.5 0.6 0.7 0.8 0.9 1.0 f
236 237 238 239 240 241 242 243 244 RMSE=0.062 RMSE=0.169 RMSE=0.034 RMSE=0.048 RMSE=0.046 0.0 0.1 0.2 0.3 0.4 0.5 0.6 0.7 0.8 0.9 1.0
230 232 234 236 238 240 242
RMSE=0.068 RMSE=0.216 RMSE=0.029 RMSE=0.061 RMSE=0.040 0.0 0.1 0.2 0.3 0.4 0.5 0.6 0.7 0.8 0.9 1.0
226 228 230 232 234 236 238 240
RMSE=0.023 RMSE=0.220 RMSE=0.026 RMSE=0.025 RMSE=0.013 0.0 0.1 0.2 0.3 0.4 0.5 0.6 0.7 0.8 0.9 1.0 f
224 226 228 230 232 234 236 238
RMSE=0.071 RMSE=0.241 RMSE=0.032 RMSE=0.034 RMSE=0.041 0.0 0.1 0.2 0.3 0.4 0.5 0.6 0.7 0.8 0.9 1.0
220 222 224 226 228 230 232 234 RMSE=0.059 RMSE=0.188 RMSE=0.029 RMSE=0.035 RMSE=0.045 0.0 0.1 0.2 0.3 0.4 0.5 0.6 0.7 0.8 0.9 1.0
218 220 222 224 226 228 230
T / K
RMSE=0.052 RMSE=0.200 RMSE=0.018 RMSE=0.021 RMSE=0.023 0.0 0.1 0.2 0.3 0.4 0.5 0.6 0.7 0.8 0.9 1.0 f
212 214 216 218 220 222 224 226 228 230
T / K
RMSE=0.058 RMSE=0.202 RMSE=0.017 RMSE=0.024 RMSE=0.019 0.0 0.1 0.2 0.3 0.4 0.5 0.6 0.7 0.8 0.9 1.0
208 210 212 214 216 218 220 222 224 226
T / K
RMSE=0.194 RMSE=0.212 RMSE=0.028 RMSE=0.047 RMSE=0.045
aw= 1.00 aw= 0.971 aw= 0.953
aw= 0.931 aw= 0.913 aw= 0.892
aw= 0.872 aw= 0.851
Experimental Data JexphetApplication
(T)
Single--PDF Active Site Deterministic
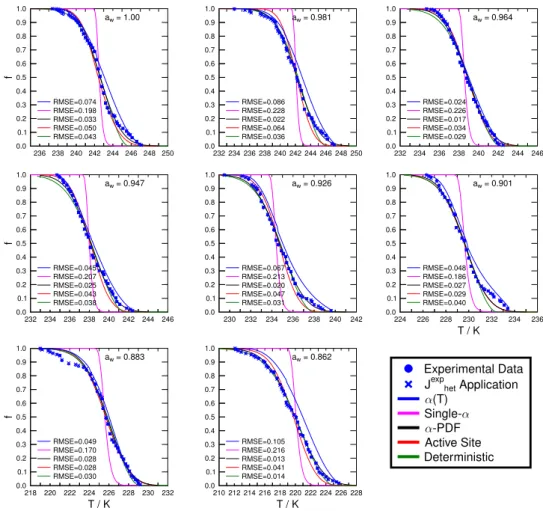
Fig. 4.Summary of different immersion freezing descriptions for water and aqueous(NH4)2SO4droplets containing leonardite as a function ofT andaw. The experimentally derived cumulative frozen fraction,f, of droplets in 0.2 K temperature increments is represented by blue
circles. Blue crosses indicate application of experimentally derived heterogeneous ice nucleation rate coefficient,Jhetexp, to calculatef. Blue, magenta, black, red, and green lines representα(T ), single-α,α-PDF, active sites, and deterministic model, respectively. The fit quality is given by the root-mean-square error, RMSE.
(Marcolli et al., 2007; L¨u¨ond et al., 2010) and Eq. (9) yield the cumulativef according to
f (T )=1−
π Z 0 p(α)exp − A cr Ti Z Tmelt
Jhet(T )dT
dα, (10)
wherep(α)represents a log-normal distribution ofαfor each investigated aw. We follow Marcolli et al. (2007) and
de-scribep(α)as
p(α)= 1
ασ√2πexp
( −
logα−µ2 2σ2
)
, (11)
whereα, µ, and σ are obtained by fitting Eq. (10) to the experimental data.
Figures 4 and 5 show the fitted frozen fraction for LEO and PP acting as IN, respectively, when applying theα-PDF model for investigatedaw. As indicated by the low RMSE
values, the fit represents the experimental data very well. This result should come as no surprise since the same data were used to constrain the fit. Figures S4 and S5 show in detail corresponding PDFp(α)for differentaw for ice
nu-cleation from water and aqueous(NH4)2SO4 droplets
con-taining LEO and PP, respectively. Tables 3 and 4 list derived fit parameters used for the calculation offand PDFp(α)for LEO and PP, respectively.
3.2.4 Single-αmodel
This model is based on the same equations as the α-PDF model; however, as outlined by L¨u¨ond et al. (L¨u¨ond et al., 2010), in Eq. (10)p(α)is replaced with a delta function, i.e.,
p(α)=δ(α=α0). This procedure assigns all IN the same
contact angle,α0instead of a distribution of contact angles.
Figures 4 and 5 show the resulting frozen fractions of droplets containing LEO and PP when applying the single-α
0.0 0.1 0.2 0.3 0.4 0.5 0.6 0.7 0.8 0.9 1.0 f
236 238 240 242 244 246 248 250 RMSE=0.074 RMSE=0.198 RMSE=0.033 RMSE=0.050 RMSE=0.043 0.0 0.1 0.2 0.3 0.4 0.5 0.6 0.7 0.8 0.9 1.0
232 234 236 238 240 242 244 246 248 250 RMSE=0.086 RMSE=0.228 RMSE=0.022 RMSE=0.064 RMSE=0.036 0.0 0.1 0.2 0.3 0.4 0.5 0.6 0.7 0.8 0.9 1.0
232 234 236 238 240 242 244 246
RMSE=0.024 RMSE=0.226 RMSE=0.017 RMSE=0.034 RMSE=0.029 0.0 0.1 0.2 0.3 0.4 0.5 0.6 0.7 0.8 0.9 1.0 f
232 234 236 238 240 242 244 246
RMSE=0.045 RMSE=0.207 RMSE=0.025 RMSE=0.043 RMSE=0.038 0.0 0.1 0.2 0.3 0.4 0.5 0.6 0.7 0.8 0.9 1.0
230 232 234 236 238 240 242
RMSE=0.067 RMSE=0.213 RMSE=0.020 RMSE=0.047 RMSE=0.031 0.0 0.1 0.2 0.3 0.4 0.5 0.6 0.7 0.8 0.9 1.0
224 226 228 230 232 234 236
T / K
RMSE=0.048 RMSE=0.186 RMSE=0.027 RMSE=0.029 RMSE=0.040 0.0 0.1 0.2 0.3 0.4 0.5 0.6 0.7 0.8 0.9 1.0 f
218 220 222 224 226 228 230 232
T / K
RMSE=0.049 RMSE=0.170 RMSE=0.028 RMSE=0.028 RMSE=0.030 0.0 0.1 0.2 0.3 0.4 0.5 0.6 0.7 0.8 0.9 1.0
210 212 214 216 218 220 222 224 226 228
T / K
RMSE=0.105 RMSE=0.216 RMSE=0.013 RMSE=0.041 RMSE=0.014
aw= 1.00 aw= 0.981 aw= 0.964
aw= 0.947 aw= 0.926 aw= 0.901
aw= 0.883 aw= 0.862
Experimental Data JexphetApplication
(T)
Single--PDF Active Site Deterministic
Fig. 5.Summary of different immersion freezing descriptions for water and aqueous (NH4)2SO4 droplets containing Pahokee peat as
a function ofT andaw. The experimentally derived cumulative frozen fraction,f, of droplets in 0.2 K temperature increments is represented
by blue circles. Blue crosses indicate application of experimentally derived heterogeneous ice nucleation rate coefficient,Jhetexp, to calculate f. Blue, magenta, black, red, and green lines representα(T ), single-α,α-PDF, active sites, and deterministic model, respectively. The fit quality is given by the RMSE.
does not describe the immersion freezing data well compared to the other descriptions. This is also evident from given RMSE values, which are about 1 order of magnitude higher compared to the other cases. Allowing variation ofσslcould
yield a better agreement between the single-αmodel and the data. However, as mentioned above, this procedure results inσslthat increases with decreasing temperature, in contrast
to measurements and the notion that the supercooled water becomes more ice-like as the temperature decreases (Prup-pacher and Klett, 1997; Zobrist et al., 2007). Clearly, a single contact angle attributed to the IN for each investigated solu-tionawis not sufficient to represent the ice nucleation data.
Tables 3 and 4 list the derivedα0 used for the calculation
off.
3.2.5 Active sites model
This ice nucleation description assumes that the surface of an ice nucleus manifests a distribution of varying ice nucleating sites. Ice nucleation occurs only on one of these active sites, where each active site is characterized by oneαvalue and the frequency of occurrence of different active sites is a function ofα(Marcolli et al., 2007; L¨u¨ond et al., 2010). The active site surface area is assumed to be similar to the critical ice em-bryo, about 6 nm2(Marcolli et al., 2007). Following Marcolli et al. (2007) and L¨u¨ond et al. (2010) we define the frozen fraction as
f (T )= 1 Ntot
Ntot X
j=1
pfrz,j(T ), (12)
whereNtotis the total number of droplets andpfrz,j(T )
density of active sites in each contact angle interval fromα
toα+1α. The probability of one droplet to freeze is
pfrz(T )=1−
Y
k
exp
Aαk
cr
Ti
Z
Tmelt
Jhet(T , αk)dT
, (13)
wherek indicates the interval number with an interval size
1α, andAαk is the total surface area of all active sites with
contact angles from αk to αk+1α present in the droplet
(L¨u¨ond et al., 2010). The difference to the original formu-lation is the integration ofJhet(T )to account for the changes
inT and thusJhet(T )since a constant cooling experiment is
conducted.
A Poisson random number with parameter
λk=ρ(αk)1αA is sampled to determine the number
of sites having a singleαkand individually having a surface
area of 6 nm2. We assume that the surface site density of active sites with differentαcan be described for eachawby
(Marcolli et al., 2007)
ρ(α)=bexp
−β1 α−β2
, (14)
whereb, β1, and β2 are fit parameters obtained by fitting
the freezing data to a simulation of 1000 droplets applying Eq. (12).
Figures 4 and 5 show the resulting frozen fractions of droplets containing LEO and PP when applying the active site model for investigatedaw, respectively. The active site
model represents the experimental data very well, as indi-cated by the low RMSE values. Figures S4 and S5 show in detail corresponding surface site density of active sites,ρ(α), for droplets containing LEO and PP, respectively. Tables 3 and 4 list respective fit parameters used for the calculation of
f andρ(α).
3.2.6 Deterministic model
This description assumes that ice nucleation is governed by a characteristic temperature only and fluctuations affecting the ice embryo growth can be neglected (Vali, 1971). This allows us to define a surface density of active sites,ns,
nu-cleating ice between a characteristic temperature andTmelt.
For each investigatedawthe number of droplets frozen,Nf,
per temperature interval dT can then be expressed as (L¨u¨ond et al., 2010)
dNf
dT =(Ntot−Nf)AK
aw(Ti), (15)
whereNtotis the total number of droplets, andK(T )
repre-sents the number of ice nucleation events and thus the num-ber of active sites per unit of ice nucleus surface area when cooling the sample by a unit temperature interval (L¨u¨ond et al., 2010; Alpert et al., 2011a,b). The frozen fraction of droplets for eachawis then derived as
f (T )=1−exph−Ans(Ti) i
with ns= −
Ti
Z
Tmelt
K(T )dT , (16)
wherensis expressed as (Connolly et al., 2009; L¨u¨ond et al.,
2010)
ns=
(
a1(T−a2)2 T < a2
=0 T ≥a2
, (17)
wherea1anda2are fit parameters.
Figures 4 and 5 show the frozen fractions of droplets con-taining LEO and PP particles acting as IN when applying the deterministic model, respectively. Similar to the previous models, the deterministic site model represents the experi-mental data very well as indicated by the small RMSE val-ues. Tables 3 and 4 list corresponding fit parameters used in the deterministic model.
3.2.7 Discussion on different ice nucleation descriptions
Five approaches have been applied to analyze immersion freezing of water and aqueous(NH4)2SO4droplets
contain-ing LEO and PP. Four are based on CNT and one assumes no time dependence. It should be emphasized that only the
α(T )-model yieldsα andJhet values directly from the
ex-perimental data; thus, no fitting is involved except if a con-tinuous function ofJhet(T )andf (T )is desired. This
exer-cise emphasizes three points that are different to the com-monly applied nucleation descriptions (α-PDF, active sites, and deterministic) that are fitted to the frozen fraction. First, as previously stated, no fitting is involved and no free param-eters are available for the calculation ofJhet(T )from Eq. (2).
Only experimental data – i.e., number of freezing events, nu-cleation time, and available IN surface areas – are employed (Zobrist et al., 2007). Second,Jhet(T )is independent of the
frozen fraction and is only a function ofT. Thus,f given in Figs. 4 and 5 is not described by a singleJhetvalue. Each
in-vestigated temperature interval possesses oneJhetvalue
(Zo-brist et al., 2007; Knopf and Forrester, 2011; Alpert et al., 2011a,b). OnceJhetfor a particular temperature is derived,
the number of frozen droplets is calculated by knowledge of available IN surface areas and nucleation time. Third,α(T )
can be applied to determineJhet for given freezing
temper-atures (within the laboratory-probed temperature range) and then used to calculate the number of frozen droplets for con-ditions (i.e.,Aandt) different than the ones applied in the laboratory.
0.0 0.1 0.2 0.3 0.4 0.5 0.6 0.7 0.8 0.9 1.0
f
236 237 238 239 240 241 242 243 244 0.0
0.1 0.2 0.3 0.4 0.5 0.6 0.7 0.8 0.9 1.0
230 232 234 236 238 240 242 0.0
0.1 0.2 0.3 0.4 0.5 0.6 0.7 0.8 0.9 1.0
226 228 230 232 234 236 238 240
0.0 0.1 0.2 0.3 0.4 0.5 0.6 0.7 0.8 0.9 1.0
f
224 226 228 230 232 234 236 238 0.0
0.1 0.2 0.3 0.4 0.5 0.6 0.7 0.8 0.9 1.0
220 222 224 226 228 230 232 234 0.0
0.1 0.2 0.3 0.4 0.5 0.6 0.7 0.8 0.9 1.0
218 220 222 224 226 228 230
T / K
0.0 0.1 0.2 0.3 0.4 0.5 0.6 0.7 0.8 0.9 1.0
f
212 214 216 218 220 222 224 226 228 230
T / K
0.0 0.1 0.2 0.3 0.4 0.5 0.6 0.7 0.8 0.9 1.0
208 210 212 214 216 218 220 222 224 226
T / K
aw= 1.00 aw= 0.971 aw= 0.953
aw= 0.931 aw= 0.913 aw= 0.892
aw= 0.872 aw= 0.851
Experimental Data -PDF, RMSE=0.1675 Active Site, RMSE=0.2137
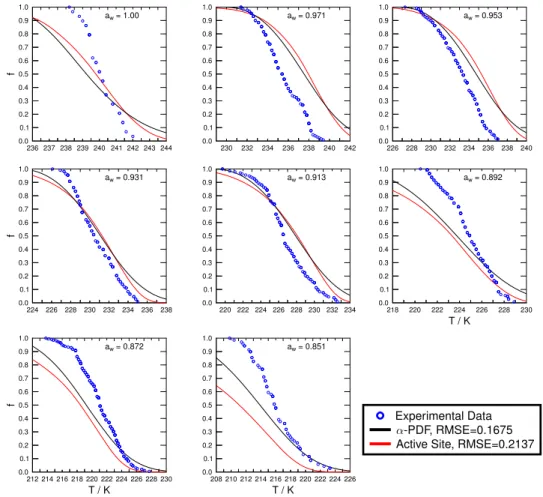
Fig. 6.Resulting immersion freezing descriptions for water and aqueous(NH4)2SO4droplets containing leonardite when fitting the entire immersion freezing data set including all investigatedaw using α-PDF (black lines) and active sites parameterizations (red lines). The
experimentally derived cumulative frozen fraction,f, of droplets in 0.2 K temperature increments is represented by blue circles. The fit quality is given by the RMSE.
representing the frozen fraction, and thus the underlying nu-cleation mechanism and nature of the ice nucleating sites cannot be inferred. The very similar representation quality of the fit-based ice nucleation descriptionsα-PDF, active sites, and deterministic model is due to the application of fitting functions with sufficient free-fit parameters to reproduce the same data set to which they are fitted. In other words, fitting experimentally observed frozen fractions of droplets by these different fit-based nucleation descriptions neither yields the underlying nucleation mechanism nor the nature and distri-bution of the ice nucleating sites. Theα(T )-model differs in that that a physical theory is tested by experimental data and onlyαis fitted with respect toT to yieldJhetα in order to de-rive continuous cumulativef. CorrespondingJhetexpandJhetα
can be applied only in the investigated temperature range, but we emphasize that investigated nucleation time and IN surface areas can lie outside of our laboratory scales.
Figures 2 to 5 and Tables 3 and 4 indicate that for each IN andaw, the underlying investigated fitting parameters for
ap-plication of each nucleation description differ significantly.
The reason for this is most likely due to the solute effect on ice nucleation and potential interaction of the solute with the IN surfaces impacting the hydrogen bonding network (Zo-brist et al., 2003; Knopf and Rigg, 2011; Alpert et al., 2011b). From this it follows that it would be computationally cum-bersome and demanding to represent in a single parameteri-zation all parameters to describe immersion freezing for one IN type for typical atmosphericT and RH.
To further test the applicability of theα-PDF, as well as ac-tive sites parameterizations, we fit our entire frozen fraction data set spanning all investigatedaw yielding one
parame-ter set for each model. This is to test the common notion that the resulting fit parameters potentially represent particle properties that should not depend on varying temperature, IN surface area, andaw. Figures 6 and 7 showα-PDF and
0.0 0.1 0.2 0.3 0.4 0.5 0.6 0.7 0.8 0.9 1.0
f
236 238 240 242 244 246 248 250 0.0
0.1 0.2 0.3 0.4 0.5 0.6 0.7 0.8 0.9 1.0
232 234 236 238 240 242 244 246 248 250 0.0
0.1 0.2 0.3 0.4 0.5 0.6 0.7 0.8 0.9 1.0
232 234 236 238 240 242 244 246
0.0 0.1 0.2 0.3 0.4 0.5 0.6 0.7 0.8 0.9 1.0
f
232 234 236 238 240 242 244 246 0.0
0.1 0.2 0.3 0.4 0.5 0.6 0.7 0.8 0.9 1.0
230 232 234 236 238 240 242 0.0
0.1 0.2 0.3 0.4 0.5 0.6 0.7 0.8 0.9 1.0
224 226 228 230 232 234 236
T / K
0.0 0.1 0.2 0.3 0.4 0.5 0.6 0.7 0.8 0.9 1.0
f
218 220 222 224 226 228 230 232
T / K
0.0 0.1 0.2 0.3 0.4 0.5 0.6 0.7 0.8 0.9 1.0
210 212 214 216 218 220 222 224 226 228
T / K
aw= 1.00 aw= 0.981 aw= 0.964
aw= 0.947 aw= 0.926 aw= 0.901
aw= 0.883 aw= 0.862
Experimental Data -PDF, RMSE=0.1122 Active Site, RMSE=0.1213
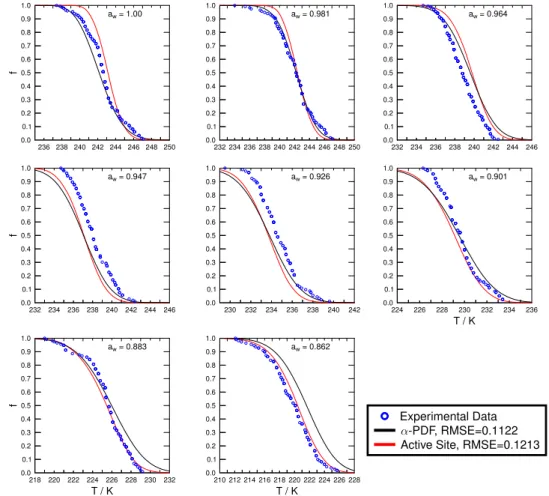
Fig. 7.Resulting immersion freezing descriptions for water and aqueous(NH4)2SO4droplets containing Pahokee peat when fitting the
entire immersion freezing data set including all investigatedawusingα-PDF (black lines) and active sites parameterizations (red lines).
The experimentally derived cumulative frozen fraction,f, of droplets in 0.2 K temperature increments is represented by blue circles. The fit quality is given by the RMSE.
indicated by the RMSE values being larger by up to about 1 order of magnitude. This could have been anticipated from Tables 3 and 4 and Figs. S4 and S5 indicating a large vari-ation of the fit parameters with respect toaw to achieve an
overall good fit. In some instances where the fit parameters for all data sets are somehow similar to the fit parameters de-rived fromf at a given singleaw, the fits come closer to the
experimental data sets. In most instances the fits deviate sig-nificantly from experimentally derivedf, as shown in Figs. 6 and 7. Figure 8 presents the PDFp(α)and active sites sur-face density for LEO and PP when fitting all available data sets at once. These distributions may reflect a sort of aver-age distribution from those derived from fittingf determined at singleaw. Clearly, these results corroborate our findings
discussed above that current fit-based parameterizations can-not capture immersion freezing occurring from aqueous so-lutions and thus at subsaturated conditions. Furthermore, this also strongly suggests that derived fit parameters do not rep-resent fundamental particle properties. An elegant solution to
Table 5. Fit parameters for α-PDF and active sites descriptions when fitting entire immersion freezing data sets including all inves-tigated water activities for water and aqueous ammonium sulfate droplets containing leonardite and Pahokee peat.
Model Parameter Leonardite Pahokee peat
α[◦] 94.7260 85.0635
α-PDF µ 0.5028 0.3952
σ 0.1210 0.0797
b×107[cm−2] 3.1975 28.727
Active Sites β1 0.2736 0.9279
β2 1.0566 0.9313
0.0 0.5 1.0 1.5 2.0 2.5
p(
)
0 1E7 2E7 3E7 4E7 5E7
60 80 100 120 140 160 180
/ o
-PDF Active Sites
0.0 0.5 1.0 1.5 2.0 2.5 3.0 3.5
0 5E7 1E8 1.5E8 2E8 2.5E8 3E8
Surf
ace
Density
of
Activ
e
Sites
/
cm
-2
60 80 100 120 140 160 180
/o
-PDF Active Sites
(a) (b)
Fig. 8.Lognormal PDFp(α)(black line) and surface density of active sites distribution (red line) determined from immersion freezing data sets for all investigatedawfor water and aqueous (NH4)2SO4droplets containing leonardite(a)and Pahokee peat(b). Note the different
scales in panels(a)and(b).
4 Atmospheric implications
The freezing data shown in Fig. 1 indicates that HULIS com-pounds possess the potential to act as immersion IN enhanc-ing the freezenhanc-ing temperatures by 5–15 K compared to homo-geneous ice nucleation over a wide range of RH. The het-erogeneous freezing temperatures can be well described by an ice melting curve shifted by1aw,het=0.2703 and 0.2466
for water and aqueous(NH4)4SO4droplets containing LEO
and PP particles, respectively. It has been previously shown that immersion freezing temperatures elevated by only 1.8 to 5 K compared to homogeneous ice nucleation due to the pres-ence of oxalic acid dihydrate crystals, translating into1aw,het
= 0.285, can have significant effects on the global radiative forcing due to alteration of the microphysical and thus radia-tive properties of cirrus clouds (Zobrist et al., 2006; K¨archer and Lohmann, 2003). Since HULIS can be a common com-pound of ubiquitous organic aerosol, our results indicate that these particles can also play a significant role in atmospheric glaciation processes and consequently the radiative budget.
This study corroborates previous work showing that im-mersion freezing temperatures can be well described by an aw-based nucleation description (Zuberi et al., 2002;
Archuleta et al., 2005; Cantrell and Robinson, 2006; Zobrist et al., 2008; Koop and Zobrist, 2009; Knopf et al., 2011; Knopf and Rigg, 2011; Alpert et al., 2011a,b). Previously de-termined1awfor different IN including organic, inorganic,
and biological particles immersed in various aqueous solu-tions are given in Table 6. The smaller1aw, the higher the ice
nucleation potential. As can be seen from Table 6, LEO and PP show similar ice nucleation efficiencies compared to other organic, inorganic, and biological IN. However, it has been shown previously, employing water droplets, that the immer-sion freezing temperature increases when IN surface areas increase (Zobrist et al., 2007; L¨u¨ond et al., 2010; Knopf and Forrester, 2011; Murray et al., 2011; Broadley et al., 2012;
Pinti et al., 2012; Knopf and Alpert, 2013). Therefore, when comparing1aw, the applied total IN surface areas should be
taken into account.
As discussed above, the kinetic analysis of the frozen frac-tions by fit-based nucleation descripfrac-tions does not allow for inference of the underlying nucleation mechanism. This is supported by (i) the very similar fit quality ofα-PDF, active sites, and deterministic descriptions; (ii) application of differ-ent water activities result in differdiffer-ent fit parameters; and (iii) fitting the entire immersion freezing data set including all in-vestigatedawusingα-PDF and active sites parameterizations
does not yield satisfactory representation of the frozen frac-tion. It is clear from above analyses that if immersion freez-ing is time dependent (CNT) (Welti et al., 2012; Knopf and Alpert, 2013), then parameterizations fitted to laboratory-measured frozen fractions cannot be applied to atmospheric conditions since experimental timescales can differ by or-ders of magnitude from atmospheric timescales (Westbrook and Illingworth, 2013), and atmospheric IN surface areas are likely not the same as applied in laboratory experiments (Er-vens and Feingold, 2012). This is because fitting frozen frac-tions by a least-squares minimization procedure always re-sults in the fit being constrained by the laboratory-derived data. The corresponding fit parameters are consequently only valid for the specific data set, thereby discarding the potential of exploiting the underlying physical processes expressed as
Jhet. This is in contrast to the α(T )-model, which initially
derivesJhetexp and then provides a physical explanation in the form of contact angle distribution. At a given freezing tem-perature,Jhetin combination withAandt yields the frozen
fraction or ice particle numbers.
Our experimental approach allows for derivation of ice nucleation kinetics for a range of droplet solution aw in
addition to freezing temperatures. Atmospherically relevant ice particle production rates, Pice(T ,RH), can be derived