IASI measurements of tropospheric ozone over Chinese megacities: Beijing, Shanghai, and Hong Kong
Texto
Imagem


Documentos relacionados
TCO monthly averages obtained from IASI between June 2008 and December 2012 are com- pared with collocated TCO measurements from the Ozone Monitoring Instrument (OMI) on the
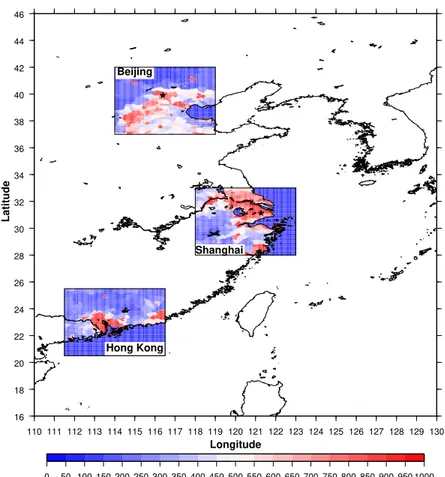
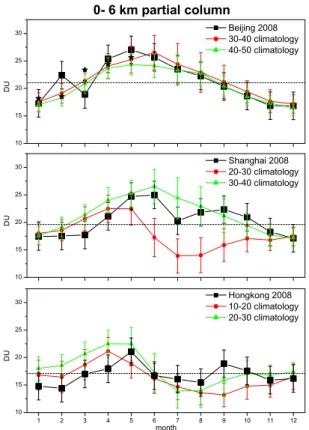
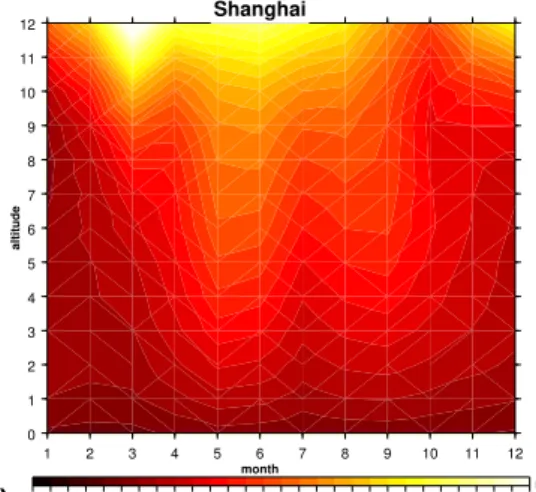
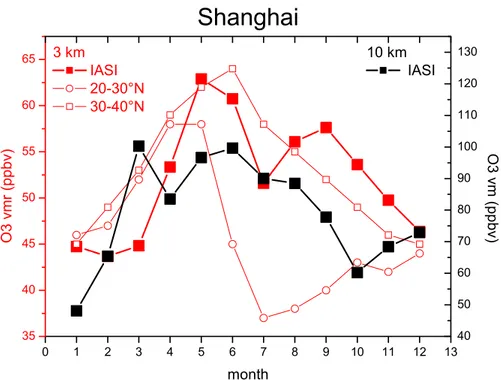
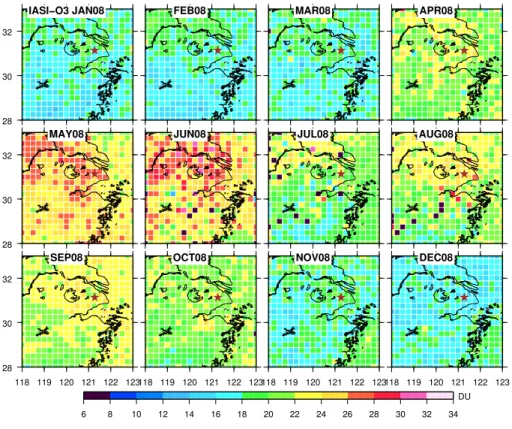
IASI observations of tropospheric ozone over the Beijing, Shanghai and Hong Kong areas during one year (2008) have been analysed, demonstrating the capability of space-borne
Melt No.. It allowed for the assessment of the influence of aluminium added in the quantity falling into the concerned range on both the graphitization of cast iron
The top-down emissions increase the simulation of lower tropospheric ozone by 5– 20 ppbv, improving the simulation versus MOZAIC in situ measurements, mainly over Africa where O 3
Due to the reduced photolysis rates in the troposphere associated with the strato- sphere ozone recovery, the global tropospheric ozone burden is calculated to
For instance, the results of the diurnal cycles of the ozone mixing ratios associated with the cleanest background clusters for coastal Eastern Canada estimated for the MAM, JJA,
On average for all the years in the time series below, the IASI limits of confidence are 1.9, 1.7, and 1.5 ppb for the Eastern Asia, Western US, and Europe ROI, respectively.. In
house gas concentrations, aerosol precursors, stratospheric and tropospheric ozone assumptions, as well as implementation of land-use change and natural forcings for the
