Overyielding in Grassland Species Mixtures
Gerlinde B. De Deyn1,2*, Helen Quirk1, Simon Oakley3, Nick J. Ostle3, Richard D. Bardgett1
1Soil and Ecosystem Ecology Laboratory, Lancaster Environment Centre, Lancaster University, Lancaster, United Kingdom,2Department of Soil Quality, Wageningen University, Wageningen, The Netherlands,3Plant-Soil Interactions Group, Centre for Ecology and Hydrology, Lancaster Environment Centre, Lancaster, United Kingdom
Abstract
Plant species richness and productivity often show a positive relationship, but the underlying mechanisms are not fully understood, especially at the plant species level. We examined how growing plants in species mixture influences intraspecific rates of short-term carbon (C-) translocation, and determined whether such short-term responses are reflected in biomass yields. We grew monocultures and mixtures of six common C3 grassland plant species in outdoor mesocosms, applied a13C-CO2 pulse in situ to trace assimilated C through plants, into the soil, and back to the atmosphere, and
quantified species-specific biomass. Pulse derived 13C enrichment was highest in the legumes Lotus corniculatus and Trifolium repens, and relocation (i.e. transport from the leaves to other plant parts) of the recently assimilated13C was most
rapid inT. repensgrown in 6-species mixtures. The grassAnthoxanthum odoratumalso showed high levels of13C enrichment
in 6-species mixtures, while13C enrichment was low inLolium perenne,Plantago lanceolataandAchillea millefolium. Rates of
C loss through respiration were highest in monocultures ofT. repens and relatively low in species mixtures, while the proportion of13C in the respired CO
2was similar in monocultures and mixtures. The grassA. odoratumand legumeT. repens
were most promoted in 6-species mixtures, and together withL. corniculatus, caused the net biomass increase in 6-species mixtures. These plant species also had highest rates of13C-label translocation, and forA. odoratumandT. repensthis effect
was greatest in plant individuals grown in species mixtures. Our study reveals that short-term plant C translocation can be accelerated in plant individuals of legume and C3 grass species when grown in mixtures, and that this is strongly positively related to overyielding. These results demonstrate a mechanistic coupling between changes in intraspecific plant carbon physiology and increased community level productivity in grassland systems.
Citation:De Deyn GB, Quirk H, Oakley S, Ostle NJ, Bardgett RD (2012) Increased Plant Carbon Translocation Linked to Overyielding in Grassland Species Mixtures. PLoS ONE 7(9): e45926. doi:10.1371/journal.pone.0045926
Editor:Andrew Hector, University of Zurich, Switzerland
ReceivedApril 14, 2012;AcceptedAugust 23, 2012;PublishedSeptember 25, 2012
Copyright:ß2012 De Deyn et al. This is an open-access article distributed under the terms of the Creative Commons Attribution License, which permits unrestricted use, distribution, and reproduction in any medium, provided the original author and source are credited.
Funding:This work was supported by funds from the BBSRC Agri-Food Committee, awarded to RDB and NJO. GBDD acknowledges the EU for support by a Marie Curie Intra European Fellowship within the 7th European Community Framework Programme. The funders had no role in study design, data collection and analysis, decision to publish, or preparation of the manuscript.
Competing Interests:The authors have declared that no competing interests exist.
* E-mail: gerlindede@gmail.com
Introduction
Primary production often increases with plant species richness, as demonstrated in a number of biodiversity experiments [1], [2]. Despite numerous studies on this topic, we still lack an understanding of the mechanisms that explain this positive plant biomass response to increased plant diversity. Several mechanisms have been proposed, involving both abiotic and biotic factors. For example, plant species grown in mixture can complement each other in their uptake of soil nutrients in time and/or space [3], [4], [5], and the chemical forms of soil nutrients that they access [6], [7], [8], and also dilution of plant species specific pathogens in species mixtures can contribute to positive diversity-productivity relationships [9]. It is generally recognised that legumes provide an additional nitrogen (N) input to soil by N2-fixation from the atmosphere. This provides legumes with a complementary N source as compared to non-legumes, and the subsequent decomposition of the N-rich roots enables higher productivity of non-legume species present within the plant community [10], [11], [12]. This in turn may benefit legume species through community level complementarity feedbacks to nutrient use efficiency, but the mechanisms involved remain poorly resolved.
species, as demonstrated in grass species in response to the presence or absence of shrubs [17], or for legumes in response to functional groups of soil biota [18]. Moreover, intraspecific diversity can be important for the strength of interactions between species, which illustrates that intraspecific variances deserve attention in the context of species diversity-ecosystem functioning relations [19]. However, whether and how individuals of different plant species change their C translocation traits in response to growing together in species mixtures, and how such intraspecific responses affect their contribution to overall plant production in species mixtures, has not yet been tested.
The overall aim of this study was to examine how growing in a mixture influences intraspecific rates of short-term C translocation in six temperate grassland plant species, and determine whether such short-term responses are reflected in overall biomass yields. Specifically, we hypothesised that plant species with the highest short-term C-translocation rates also yield most biomass, and that this effect is enhanced when plants are grown in mixtures. This would mean that individuals in plant species mixtures are larger C sinks than in monoculture, and this can only be true if the newly assimilated C is translocated from the leaves to other plant parts that support plant biomass production over longer timescales (days to weeks before the C investment to belowground plant parts is notable in aboveground yields), rather than being respired back to the atmosphere. To test our hypothesis we designed a field-based grassland mesocosm experiment using two grass, two forb and two legume species, and grew them all in monocultures and in 6-species mixtures starting from seedlings, so that individuals of each species could be investigated in both community settings at the same planting density. We used an in situ13
C-CO2 pulse chase approach [20] to trace recent assimilated C in plants and soil respiration, in order to compare intraspecific rates of C translocation, and measured plant biomass yields at the end of the experiment, to investigate species specific biomass, in species mixtures and monocultures.
Results
Vegetation Relative Yield
In mixed plant communities, all plant species, apart fromL. perenne, performed better than in monoculture, as indicated by their positive relative yield (RY) (Fig. 1A); together, this resulted in a relative yield total (RYT) of 2.160.2 (Confidence Interval CI 1.5 to 2.7, N = 4). Individual plant species differed in their RY (K-W H = 20.9, P,0.001, N = 4), withA. odoratumandT. repensattaining the highest RY (Fig. 1A). However, plant species with a high RY did not necessarily contribute most to biomass production in mixtures, as RY reflects a biomass ratio and does not account for absolute biomass production. The absolute biomass contribution of the different plant species to overyielding of the 6-species mixtures was quantified as their net effect. We found that the net effect differed between species (F5,15= 31.8, P,0.0001, N = 4), with A. odoratum, T. repens and L. corniculatus each contributing approximately one third (10 g per mesocosm) to the higher yield (Fig. 1B). Monoculture yield ofL. corniculatuswas higher than that of the 6-species mixtures, hence there was no transgressive overyielding. However, bothA. odoratumandT. repenshad much lower monoculture yields than the 6-species mixture, with their monoculture yield comparable to that of P. lanceolata and A. millefolium(Fig. 1C).
13C Enrichment in Vegetation and Soil
All species grown in monoculture and in the 6-species mixture were enriched in 13C at levels significantly above reference
‘background’ levels, as indicated by 13C atom % excess values (Fig. 2A–F; Fig. S1 A–F). The plant species with highest levels of enrichment were the legumesT. repensandL. corniculatus(Fig. 2A, B). For all species,13C enrichment declined significantly over time (P,0.05), which was independent of species richness for L. corniculatus,P. lanceolata,A. millefoliumand A. odoratum. In contrast, forT. repensthere was a significant interaction with species richness (time6species richness interaction F3,9= 4.69, P = 0.03, N = 4), with a faster decline in13C enrichment occurring in the species mixture than in monoculture (Fig. 2A). For A. odoratum, 13C enrichment exhibited higher levels of enrichment in the 6-species mixture than in monoculture (F1,3= 7.90, P = 0.067) (Fig. 2D). The %C in the vegetation was on average 41.260.2% (CI 40.8 to 41.5) across species and was not affected by whether species were grown in monoculture or 6-species mixture.
We found no statistically significant 13C enrichment in roots (averaged13
C ranged from225.260.7%(CI226.6 to223.9) to
224.160. 9%(CI226.0 to222.2) across sampling times), which was likely due to the dilution of the signal in mixed root samples with roots of varying age. We detected 13C enrichment of soil (Friedman Anova x2= 15.99, P
,0.05, N = 4) and enrichment levels were higher immediately and one day after the pulse labelling than at two and eight days after the pulse. Soil 13C enrichment levels were low (averaged13
C ranged from225.860.1 %(CI226.0 to225.5) at 24 h after the pulse to226.1360.08% (CI 226.3 to 226.0) at 48 hours after the pulse) and were unaffected by plant treatments.
13CO
2and Total CO2Ecosystem Respiration
The rate of13C loss through ecosystem respiration, in terms of enrichment of the atmosphere with13C, declined strongly over time (F4,72= 90.04, P,0.0001, N = 24), and showed an interaction with plant treatments (time 6 species richness interaction F24,72= 2.03, P = 0.01, N = 4) (Fig. 3). This interactive effect was due to different rates of13C respiration loss between the first two sampling points (2 h and 24 h after the pulse). Post-hoc tests revealed that monocultures ofL. corniculatus,T. repensandL. perenne and 6-species mixtures had higher rates of 13C loss through respiration in terms of atmosphere enrichment with 13C than monocultures ofA. odoratumat two hours after the pulse, while at subsequent sampling times the rate of13C loss converged across all treatments. Total rates of ecosystem CO2 respiration differed significantly between the plant communities, being greatest in monocultures ofT. repenscompared to all other plant communities (Table 1). These differences were even more pronounced when expressed on a per unit aboveground dry weight biomass of the plant communities, withT. repens monocultures losing C through respiration at almost four times higher rates than 6-species mixtures.
Soil Nitrogen and pH
The availability of inorganic N at harvest was strongly affected by the plant treatments (F6,18= 28.88, P,0.0001, N = 4; Fig. 4A). The highest concentration of inorganic N was found in soil ofT. repensmonocultures, intermediate values were found in soil ofA. odoratum,L. perenneandL. corniculatusmonocultures, and the lowest values in 6-species mixtures and monocultures ofP. lanceolataand A. millefolium(Fig. 4A). Rates of potential N mineralisation were also strongly dependent on plant species treatments (F6,18= 11.78, P,0.0001, N = 4; Fig. 4B). The highest rate of potential soil N mineralisation was found in monocultures of T. repens, the 6-species mixtures and monocultures ofL. corniculatusandL. perenne, and lowest in soil taken from monocultures ofA. odoratumandA. millefolium(Fig. 4B).
Figure 1. Plant species specific performance in species mixture and total biomass of monocultures and species mixtures. Relative yield (A), net effect (B) and average shoot biomass (C) per mesocosm (38638 cm) of each of the six species grown in monoculture and 6-species mixtures.Bars are means 61 SE (N = 4); the horizontal dotted line in panel A indicates 1/6thof the yield. Species names are
Soil pH differed significantly between plant species monocul-tures and 6-species mixmonocul-tures (F6,18= 18.28, P,0.0001, N = 4). Soils from the legumesT. repensand L. corniculatushad the lowest pH (5.6660.06;T. repensCI 5.55 to 5.86 and forL. corniculatusCI 5.39 to 5.85), the grassA. odoratumthe highest (6.5760.14, CI 6.11 to 7.02), and 6-species mixtures had intermediate (5.8860.03, CI 5.77 to 5.86) soil pH values.
Vegetation C/N Ratio and NUE
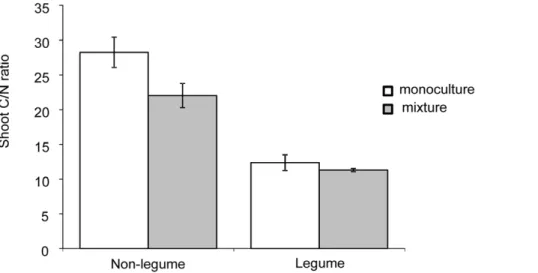
The average shoot C/N ratio (measured in the top 2 cm of plant shoots) of non-legume species was significantly lower when plants were grown in the 6-species mixture compared to when grown in monoculture (F1,23= 6.6, P,0.05; in mixture CI 18.63 to 25.37 and in monoculture CI 24.75 to 31.75). In contrast, the C/ N ratio of the legume species did not differ between monocultures or 6-species mixtures (F1,11= 0.5, P.0.05; in mixture CI 10.14 to 12.44 and in monoculture CI 9.07 to 15.63), and was on average much lower than in the non-legume species (Fig. 5). We also found
that the amount of aboveground biomass produced per unit of N in that plant material (i.e. their nutrient use efficiency NUE) differed significantly between assembled plant communities (Table 2). The NUE was lowest in monocultures of T. repens, intermediate in six species mixtures and monocultures of L. corniculatusand highest in monocultures ofA. odoratum,A. millefolium andP. lanceolata.
Discussion
In this study, we examined how intraspecific variation in short-term C translocation in grassland plant species is affected by being grown in mixed communities, and how this contributes to overyielding. We found that all plant species, with the exception ofL. perenne, yielded more when grown in a six species mixture, but T. repensandA. odoratumbenefitted most, with RY values of over 0.5. For these two plant species we also found that the13C tracer enrichment in leaves and its translocation over time, was higher in plant individuals grown in 6-species mixture as opposed to when
Figure 2. Enrichment of shoot tissue with13C in individuals grown in monoculture (mono) or 6-species mixture (mix) at 2 h, 24 h, 48 h and 8 days after the13C pulse.Species names are (A) Tr =Trifolium repens, (B) Lc =Lotus corniculatus, (C) Pl =Plantago lanceolata, (D) Ao =Anthoxanthum odoratum, (E) Am =Achillea millefolium, (F) Lp =Lolium perenne.
doi:10.1371/journal.pone.0045926.g002
grown in monoculture. In particular, we found that the grassA. odoratum had higher levels of 13C enrichment following the application of the13C pulse, while the legumeT. repensshowed a faster translocation of recently assimilated13C; both these findings indicate faster C uptake and translocation in 6-species mixtures than in monocultures. Moreover, the release of recently assimi-lated 13C through respiration in terms of enrichment of the atmosphere with 13C from respiration was generally similar in monocultures and the 6-species mixture, while total standing biomass was higher in 6-species mixtures, suggesting higher C retention of assimilated C per unit biomass in species mixture. This idea is supported by the overall high rates of total CO2 respiration from T. repens monocultures which had low above-ground biomass and the low rates of total CO2 respiration loss from 6-species mixtures relative to their plant biomass.
The species with the greatest short-term 13C enrichment (A. odoratum) and 13C translocation from its leaves (T. repens) when grown in mixture relative to monoculture also benefited most from growing in species mixtures (high RY), and together contributed
2/3 of the absolute biomass increase in species mixtures (net effect). The other legume species used, L. corniculatus, also contributed significantly to the net effect on yield and had a high RY, indicating that it also benefited from growing in mixtures. However, we did not detect any effect of being grown in a mixture on leaf13C enrichment or13C translocation rates inL. corniculatus. This indicates that other mechanisms are at play for this species, with a larger investment in stems (with low N content) rather than in leaves being one potential reason [16].
In grassland biodiversity experiments, the commonly observed increase of plant community biomass with species richness is usually strongly and positively related to the presence of legumes [11], [12], [21]. In these studies, the role of individual plants and species could not be addressed given their set-up with treatments using broad functional groups rather than individual species. In our experiment, legumes clearly played an important role in influencing non-legume species, with non-legume species having significantly lower shoot C/N ratios, i.e. containing relatively more N, when grown in 6-species mixtures than when grown in
Figure 3. Enrichment of respired CO2with13C in monocultures and 6-species mixture (6sp) at 2 h, 24 h, 48 h, 8 and 30 days after the13C pulse.Data points are means
61 SE (N = 4). Communities with different symbols are significantly different at sampling time 2 h after the pulse. For species monoculture names see Fig. 1.
doi:10.1371/journal.pone.0045926.g003
Table 1.Rates of total ecosystem CO2respiration per m2and per aboveground biomass per m2basis across the plant species
monocultures and six species mixture.
Plant community mean mg CO2-C/h/m2 295% CI +95% CI mean mg CO2-C/h/m2/g dw 295% CI +95% CI
Tr 61.7 50.4 73.0 2.3 1.8 2.7
Lc 39.7 28.4 51.1 0.5 0.3 0.6
Lp 33.2 22.0 44.6 2.3 1.5 3.1
Am 25.5 14.1 36.8 1.6 0.9 2.3
Pl 24.3 13.1 35.7 1.5 0.8 2.1
Ao 20.6 9.2 32.0 1.3 0.6 2.0
6 sp 33.4 22.2 44.8 0.6 0.4 0.8
Means (in mg CO2-C/h/m2and in mg CO2-C/h/m2/g aboveground dry weight)
695% CI. Tr =Trifolium repens, Lc =Lotus corniculatus, Lp =Lolium perenne, Am =Achilea millefolium, Pl =Plantago lanceolata, Ao =Anthoxanthum odoratum, 6sp = mixture of the six species.
monoculture. We found larger plant biomass and higher leaf N concentrations in the 6-species mixtures; hence, our results support earlier findings that plants use a larger total soil N pool when in mixtures with legume species than when alone in monoculture [12,15]. As a consequence, our results appear to be in contrast to other findings of higher N use efficiency, as indicated by lower C/ N ratio of plant tissues and lower NUE at plant community level in species mixtures [12], [13]. The faster rate of C translocation in the grass species A. odoratumwhen grown in the species mixture
with legumes may be explained by the higher N availability in soil and consequent improved total plant C assimilation and translo-cation activity.
Additional N input from N-fixers and resource use comple-mentarity have been proposed as mechanisms underlying species richness-plant productivity relationships [1], [10], [11]. In our experiment, both legume species, L. corniculatus and T. repens, appeared to be very active in assimilating C, as indicated by high levels of13C enrichment, which is known to promote atmospheric
Figure 4. Soil mineral nitrogen status. Total plant available inorganic N (A) and potential N mineralisation rate inmg per g soil dry weight per day (B) of soil from monocultures and 6-species mixtures (6 sp).Bars are means61 SE (N = 4), for monoculture names see Fig. 1.
doi:10.1371/journal.pone.0045926.g004
N fixation by legumes because N-fixing bacteria are fuelled by photosyntates [22]. Moreover, C translocation in T. repens, measured as change in 13C enrichment in its leaves over time, was greater in the mixture, suggesting enhanced C allocation to roots, although our13C signal in roots was not strong enough to quantify this. It is unlikely that the faster13C translocation was lost to respiration as theT. repensmonocultures respired CO2at much faster rate than plant species mixtures. Given that aboveground biomass in 6-species mixture was basically composed of 1/3rdof eachT. repens,A. odoratumandL. corniculatus, as determined at final harvest, one could expect respiratory loss on a per unit aboveground biomass basis in the species mixture being the sum of 1/3rd of the C respiration loss rates per unit aboveground biomass of T. repens, A. odoratum and L. corniculatus. However, in species mixture the measured C respiration loss rate per unit aboveground biomass was less than half the expected loss rate, suggesting enhanced carbon use efficiency in plant species mixtures. In addition to larger N input, the mesocosms with 6-species mixture lost less N through leaching compared to monocultures [23]. Previous studies have reported complemen-tarity between legumes and C4 grasses [12], and between legumes
and tall herbs [24], whereas our results suggest complementarity between legumes and C3 grasses. The explanation of the observation that in the different studies legumes were comple-mentary to different plant groups (i.e. to C4 grasses, or to tall herbs, or to C3 grasses) may be different overruling underlying mechanisms. For example in mixtures where legumes and C4 grasses are combined complementarity in peak growing season may be the overruling factor in overyielding, which may be less at play when legumes and C3 grasses are combined [4], [12].
The reason why the legume species had faster C translocation and benefited from growing in mixtures is not clear, but may be related to soil pH, which was lowest in the legume monocultures and may have suppressed N fixation rates [25]. Also the lower soil mineral N availability in species mixtures as compared to in monocultures ofT. repensmay have promoted N fixation rates, and with it associated high rates of C allocation to roots inT. repens grown in plant species mixtures [26]. The faster rate of translocation of C inT. repensin species mixtures indeed suggests a potential change in C sink strength of plant roots in species mixtures. Apart from root inhabiting rhizobia also arbuscular mycorrhizal fungi (AMF) may have facilitated faster13C translo-cation in T. repens leaves to belowground in species mixtures as mycorrhiza can stimulate the C sink strength and rates of N fixation in legume roots [22]. In our plant communities, we found that plant species richness and A. odoratum presence related positively to the abundance of AMF in soil [27]. If A. odoratum stimulates C sink strength in roots ofT. repensthrough a common AMF network, and if AMF promote N uptake inA. odoratum, this might explain whyA. odoratumandT. repensperformed especially well in species mixtures i.e. by indirect, soil biota mediated, reciprocal benefit. In an earlier experiment, using the samein situ labelling approach, we found that AMF are a strong C sink and show significant 13C enrichment 24 h after labelling, which indicates that they act at timescales that correspond with the rate of decrease of the13C tracer in plant shoots [28].
The higher leaf C/N ratios measured in monocultures compared with the 6-species mixture, indicate that N limitation of non-legume species in monocultures was an important factor in their lower yielding. The overall low yield ofL. perenne,P. lanceolata andA. millefoliumin monoculture and mixture may be due to the combination of factors, such as low soil nutrient availability, soil
Figure 5. Average leaf C/N ration of non-legume and legume plant species grown in monoculture (white bars) and 6-species mixture (grey bars).Bars are means61 SE (N = 16 for Non-legume and N = 8 for Legume).
doi:10.1371/journal.pone.0045926.g005
Table 2.Nitrogen use efficiency at the community level (in aboveground biomass) across the plant species monocultures and six species mixture.
Plant community NUE mean 295% CI +95% CI
Tr 25.0 23.4 26.7
Lc 49.7 41.8 57.7
Lp 85.8 37.1 134.6
Am 84.4 66.8 101.9
Pl 91.7 67.6 115.7
Ao 95.1 80.4 109.7
6 sp 42.6 38.7 46.6
pathogens and competition, so that C loss to pathogens and herbivores was not compensated for [29], [30].
By tracing C from the atmosphere into individual plant species within plant species grown in monoculture and 6-species mixture, we found that short-term plant C translocation is accelerated in plant individuals of legume and C3 grass species when plants are grown in mixtures, potentially through interaction with soil biota. Moreover this short-term response was strongly positive related to overyielding in species mixtures measured at longer-term. These results show a mechanistic coupling between intraspecific plant carbon cycling and community level productivity.
Materials and Methods
Experimental Design
Plant communities were established in outdoor mesocosms in August 2006. The mesocosms (38 6 38 cm, 30 cm deep) comprised high-density polypropylene pots with a 10-cm bottom layer of limestone chippings, filled with 20 cm of soil and placed on a polypropylene saucer [23]. Soil was taken from a permanent grassland with a history of fertiliser application, at the University of Newcastle-upon-Tyne Farm, Nafferton, Northumberland, UK (54u19 N, 0u239 W). The soil was collected from the top 20 cm layer after stripping off the vegetation. Prior to filling mesocosms, all stones and visible roots were removed by hand and the soil was mixed [23]. The soil was a free-draining alluvial sandy loam soil (3% clay, 42% loam, 55% sand), as determined using a particle size analyzer (Mastersizer 2000, Malvern Instruments Ltd, Malvern, UK). At the start of the experiment, total available inorganic N (KCl extract) was 16.560.4 mg kg21soil dry weight, organic matter content 4.360.1% as determined by loss on ignition at 550uC, and soil was pH 5.860.1 [21].
The experiment was set up at the Lancaster University Hazelrigg Field Station (54u19 N, 2u469 W; mean annual temperature 9uC and mean annual precipitation 1050 mm) in a complete random block design. The experiment comprised four blocks, each containing one monoculture of each of the six plant species and a mixture of the six species all grown together, totalling 7 communities64 reps = 28 mesocosms. Plants were planted in mesocosms at a constant total plant density of 36 individuals per mesocosm, with 6 individuals per species planted in the mixtures so that individuals of each species were neighboured by individuals of other species. Plants were planted in six rows with in each row six individuals, one of each plant species in the case of plant species mixtures. Our species pool consisted of common British grassland plants: two grassesLolium perenneL. (Lp) andAnthoxanthum odoratum L. (Ao), two forbsPlantago lanceolataL. (Pl) andAchillea millefoliumL. (Am), and two legume species Trifolium repens L. (Tr) and Lotus corniculatusL. (Lc) [31], [32]. All plants were grown from seed by germinating surface-sterilized seeds (using diluted sodium hypo-chlorite) in Petri dishes with filter paper soaked in de-mineralised water at room temperature. Germinated seeds were transferred to plug trays with autoclaved sterilized soil and grown in a glasshouse for eight weeks. Seedlings were subsequently acclimatised outside for one week and then planted in the mesocosms. After one year in August 2007, above-ground vegetation was clipped to 2 cm above the soil surface, and plant communities were left to re-grow. In order to maintain the original species composition, mesocosms were weeded of unwanted species. Mesocosms received no fertiliser throughout the experiment and were watered during summer months as required.
13CO
2Pulse Labelling
To investigate the fate of recently plant assimilated C, a13CO2 pulse-chase assay was performed according to the method of Ostle et al. [20], [33], and as used by De Deyn et al. [28]. The vegetation was subjected to a13C-CO2pulse-chase treatment in July 2008, followed by sampling of individual plant species. In brief, in each mesocosm vegetation was exposed to an air stream to which13C labelled CO2(99 atom %13C enriched) was added and passed through a 19 l transparent acrylic chamber (30 cm diameter, 35 cm height) at flow rates of 3 l per minute at a concentration of 500 ppm CO2. The pulse labelling system simultaneously provided 14 chambers with 13C enriched CO2. Therefore we pulsed 14 of the 28 mesocosms across the four blocks (i.e. half of all the mesocosms in each block) during 30 minutes, then moved the pulse chambers to the other half of the mesocosms in each block for 30 minutes. We repeated this cycle five times so that each mesocosm was exposed to an equal13CO
2pulse for 2.5 hours between 11 am and 4 pm on 16th July 2008. Average air temperature during pulsing was 15uC, soil temperature 16uC and PAR was 6706130mmol m22s21.
Plant, Soil and Respired CO2Sampling
Plant and soil matter was sampled immediately before13CO2 labelling and at 2, 24 and 48 hours, and 8 days after labelling. At each sampling, shoot material from each of the six plant species was sampled across all mesocosms. Vegetation was sampled by snipping 2 cm long leaf tips from undamaged plants or a leaflet of 3 sub-leaves forT. repens. Samples of each plant species from each mesocosm were put in individual eppendorf tubes and were immediately frozen at 220uC. Soil samples were collected for root, inorganic and mineralisable N measurements from the rhizosphere by taking a single core (3.4 cm diameter, 10 cm deep). Soil cores and vegetation samples were taken from a different quarter of the labelled area within each mesocosm at each sampling. All plant species sampled were present in all quarters of the labelled area, with the labelled area being the central area of diameter 30 cm (i.e. chamber diameter) within the square pot area. Release of recent assimilated 13C through ecosystem CO2 respiration (soil, root and shoot) was assessed by covering the vegetation with dark chambers and head space samples were collected immediately after covering and after 30 minutes and 1 hour through a septum (Suba Seal) fitted in the chamber wall prior to covering the vegetation with the chamber. Samples were stored in 12 ml exetainers (labco Ltd UK) at sampling temperature.
Total above-ground vegetation was harvested from each mesocosm at the end of August 2008 by clipping all shoot material above the soil surface. Vegetation was dried at 70uC for 48 h and weighed per species and per mesocosm. Relative yield (RY) of each species was calculated within each block as the species biomass in mixture divided by the species biomass in monoculture (for species i: RYi= Yi/Mi), and relative yield total (RYT) by summing the RY of all species in the mixed plant community whereby RYT.1 was qualified as overyielding [10], [34]. The net effect or net yield (net Y) of each species quantifies the biomass contribution of each plant species to the extra biomass in the species mixture as compared to the average monoculture biomass. We calculated the net Y within each block as the observed yield (YO) in the species mixture minus the expected yield (YE), with the expected yield being the monoculture yield of the species divided by the number of species in the mixture (net Yi= YOi2YEi= YOi2(Mi/6)) [35].
Stable Isotope Analyses and Plant C and N Concentration Enrichment of13C in plant tissues (leaf and root) and soil was determined using freeze-dried (Gilchrist, Germany) and finely ground sample material (,50mm). Sample was weighed into tin cups, and analysed for total C,13C/12C isotopic ratio, % C and % N using a Flash EA 1112 Series elemental analyser (Thermo Electron Corporation, Bremen, Germany) coupled with a Deltaplus Advantage isotope ratio mass spectrometer (IRMS, Thermo Finnigan, Bremen, Germany). Enrichment of 13C is expressed as13C atom % excess according to Boutton [36] with atom % excess = atom % enriched sample – atom % background sample (i.e. before labelling), in which atom % = [Rsample/(Rsample +1)]6 100 and Rsample=
13
C/12C ratio measured by IRMS. 13
C/12C isotopic ratios of respiration samples were also deter-mined using a Gas-bench II connected to a Deltaplus Advantage isotope ratio mass spectrometer (both Thermo Finnigan, Bremen, Germany) and CO2concentrations determined by Gas Chroma-tography (Agilent, Autosystem xl).
Soil Nitrogen, Potential Nitrogen Mineralisation Rate and pH
Total plant available inorganic N concentrations (NH4+ + NO32) and rates of potential N mineralisation were determined on soil samples collected immediately after harvesting all the vegetation. Total available inorganic N was determined in KCl extracts of subsamples of 10 g of fresh sieved soil using standard colorimetric autoanalyser procedures [37] on a continuous flow autoanalyser (Bran and Luebbe, Northampton, UK). To evaluate potential rates of N mineralisation, inorganic N (NH4++NO32) was also determined after incubation of 10 g subsamples of fresh soil at 20uC for 14 days and the potential mineralisation rate was calculated as inorganic N concentration after incubation, minus that at the start, divided by the number of days of incubation. Soil pH was determined on water extracts using a 12.5 gram fresh sieved soil subsample in 50 ml of demineralised water and a pH meter.
Data Analysis
We tested for the effects of plant species identity on biomass yield in the 6-species mixtures using Generalised Linear Mixed Model (GL Mixed Model), with block as a random factor and species identity as fixed factor. We used Repeated Measures Analysis of Variance (ANOVA) to test the effect of plant species richness on13C enrichment, on CO2respiration rate and on %C
in vegetation for each species, with block as a random factor and species richness (1 or 6) as fixed, and sampling time as a repeat factor. In a similar way, we tested the effect of plant composition (monoculture identity and 6-species mixture) on 13C respiration loss using Repeated Measures ANOVA with plant treatment as a fixed factor, block as a random factor, and sampling time as a repeat factor. Plant treatment effects on soil inorganic N, potential N mineralisation rate, shoot biomass, shoot C/N ratio of non-legume and non-legume species and soil pH were tested using a GL Mixed Model with block as random and plant community composition (the six monocultures and 6-species mixtures) as fixed factor. Differences between treatment levels were tested using Tukey HSD post-hoc test. Enrichment with13C and shoot C/N in L. perennein mixtures could not be determined due to the very low abundance of this species in mixtures. Species identity effects on relative yield and plant community composition on13C enrich-ment in soil were tested using non-parametric Kruskal-Wallis and Mann-Whitney U tests, and time effects on soil13C enrichment were tested using Friedmann ANOVA for multiple dependent samples. Prior to statistical analysis, data of 13C enrichment in plants and air and shoot C/N ratios were log transformed, and total inorganic N data were square root transformed. We used the software STATISTICA for our statistical analysis.
Supporting Information
Figure S1 Enrichment of shoot tissue with 13C in individuals grown in monoculture (mono) or 6-species mixture (mix) at 2 h, 24 h, 48 h and 8 days after the13C pulse with test statistics per plant species.Species names are (A) Tr =Trifolium repens, (B) Lc =Lotus corniculatus, (C) Pl =Plantago lanceolata, (D) Ao =Anthoxanthum odoratum, (E) Am = A-chillea millefolium, (F) Lp =Lolium perenne.
(TIF)
Acknowledgments
We are thankful to William Taylor for collection of the soil and Kate Harrison and Will Mallott for help with setting up the experiment.
Author Contributions
Conceived and designed the experiments: RDB NJO GBDD. Performed the experiments: HQ SO GBDD. Analyzed the data: GBDD. Contributed reagents/materials/analysis tools: RDB NJO. Wrote the paper: GBDD RDB NJO.
References
1. Hooper DU, Chapin FS, Ewel JJ, Hector A, Inchausti P, et al. (2005) Effects of biodiversity on ecosystem functioning: A consensus of current knowledge. Ecol Monographs 75: 3–35.
2. Cardinale BJ, Wright JP, Cadotte MW, Carroll IT, Hector A, et al. (2007) Impacts of plant diversity on biomass production increase through time because of species complementarity. Proc Natl Acad Sci U S A 104: 18123–18128. 3. Berendse F (1983) Interspecific competition and niche differentiation between
Plantago lanceolataandAnthoxanthum odoratumin a natural hayfield. J Ecol 71: 379– 390.
4. Hooper DU, Vitousek PM (1998) Effects of plant composition and diversity on nutrient cycling. Ecol Monographs 68: 121–149.
5. Spehn EM, Joshi J, Schmid B, Diemer M, Korner C (2000) Above-ground resource use increases with plant species richness in experimental grassland ecosystems. Funct Ecol 14: 326–337.
6. Weigelt A, Bol R, Bardgett RD (2005) Preferential uptake of soil nitrogen forms by grassland plant species. Oecologia 142: 627–635.
7. Harrison KA, Bol R, Bardgett RD (2007) Preferences for different nitrogen forms by coexisting plant species and soil microbes. Ecology 88: 989–999. 8. von Felten S, Hector A, Buhmann N, Niklaus PA, Schmid B, et al. (2009)
Belowground nitrogen partitioning in experimental plant communities of varying species richness. Ecology 90: 1389–1399.
9. Schnitzer SA, Klironomos JN, HilleRisLambers J, Kinkel LL, Reich PB, et al. (2011) Soil microbes drive the classic plant diversity-productivity pattern. Ecology 92: 296–303.
10. Fridley JD (2001) The influence of species diversity on ecosystem productivity: how, where, why and when? Oikos 93: 514–526.
11. HilleRisLambers J, Harpole WS, Tilman D, Knops J, Reich PB (2004) Mechanisms responsible for the positive diversity-productivity relationship in Minnesota grasslands. Ecol Letters 7: 661–668.
12. Fargione J, Tilman D, Dybzinski R, HilleRisLambers J, Clark C, et al. (2007) From selection to complementarity: shifts in the causes of biodiversity-productivity relationships in a long-term biodiversity experiment. Proc Roy Soc B Biol Sci 274: 871–876.
13. van Ruijven J, Berendse F (2005) Diversity-productivity relationships: Initial effects, long-term patterns, and underlying mechanisms. Proc Natl Acad Sci U S A 102: 695–700.
14. Marquard E, Weigelt A, Roscher C, Gubsch M, Lipowsky A, et al. (2009a) Positive biodiversity-productivity relationship due to increased plant density. J Ecol 97: 696–704.
16. Roscher C, Schmid B, Buchmann N, Weigelt A, Schulze ED (2011) Legume species differ in the responses of their functional traits to plant diversity. Oecologia 165: 437–452.
17. Ward SE, Bardgett RD, McNamara NP, Ostle NJ (2009) Plant functional group identity influences short-term peatland ecosystem carbon flux: evidence from a plant removal experiment. Funct Ecol 23: 454–462.
18. Harris D, Pacovsky RS, Paul EA (1985) Carbon economy of soybean-Rhizobium-Glomus associations. New Phytologist 101: 427–440.
19. Fridley JD, Grime JP (2010) Community and ecosystem effects of intraspecific genetic diversity in grassland microcosms of varying species diversity. Ecology 91: 2272–2283.
20. Ostle N, Whiteley AS, Bailey MJ, Sleep D, Ineson P, et al. (2003) Active microbial RNA turnover in a grassland soil estimated using a13CO2spike. Soil Biol Biochem 35: 877–885.
21. Tilman D, Reich PB, Knops J, Wedin D, Mielke T, et al. (2001) Diversity and productivity in a long-term grassland experiment. Science 294: 843–845. 22. Kaschuk G, Kuyper TW, Leffelaar PA, Hungria M, Giller KE (2009) Are the
rates of photosynthesis stimulated by the carbon sink strength of rhizobial and arbuscular mycorrhizal symbioses? Soil Biol Biochem 41: 1233–1244. 23. De Deyn GB, Quirk H, Yi Z, Oakley S, Ostle NJ, et al. (2009) Vegetation
composition promotes carbon and nitrogen storage in model grassland communities of contrasting soil fertility. J Ecol 97: 864–875.
24. Marquard E, Weigelt A, Temperton VM, Roscher C, Schumacher J, et al. (2009b) Plant species richness and functional composition drive overyielding in a six-year grassland experiment. Ecology 90: 3290–3302.
25. Zahran HH (1999) Rhizobium-legume symbiosis and nitrogen fixation under severe conditions and in an arid climate. Microbiol Molecular Biol Rev 63: 968– 989.
26. Hartwig UA (1998) The regulation of symbiotic N2 fixation: a conceptual model of N feedback from the ecosystem to the gene expression level. Perspectives Plant Ecol Evol Syst 1: 92–120.
27. De Deyn GB, Quirk H, Bardgett RD (2011) Plant species richness, identity and productivity differentially influence key groups of microbes in grassland soils of contrasting fertility. Biol Letters 7: 75–78.
28. De Deyn GB, Quirk H, Oakley S, Ostle NJ, Bardgett RD (2011) Rapid transfer of photosynthetic carbon through the plant-soil system in differently managed species-rich grasslands. Biogeosci 8: 1131–1139.
29. Petermann JS, Fergus AJF, Turnbull LA, Schmid B (2008) Janzen-Connell effects are widespread and strong enough to maintain diversity in grasslands. Ecology 89: 2399–2406.
30. De Deyn GB, Raaijmakers CE, van der Putten WH (2004) Plant community development is affected by nutrients and soil biota. J Ecol 92: 824–834. 31. Grime JP, Hunt R (1975) Relative growth-rate – its range and adaptive
significance in a local flora. J Ecol 63: 393–422.
32. Rodwell JS (1992) British plant communities: grasslands and montane communities. Cambridge University Press, Cambridge, UK.
33. Ostle N, Briones MJI, Ineson P, Cole L, Staddon P, et al. (2007) Isotopic detection of recent photosynthate carbon flow into grassland rhizosphere fauna. Soil Biol Biochem 39: 768–777.
34. de Wit CT, van den Bergh JP (1965) Competition between herbage plants. Netherlands J Agric Sci 13: 212–221.
35. Loreau M, Hector A (2001) Partitioning selection and complementarity in biodiversity experiments. Nature 412: 72–76.
36. Boutton TW (1991) Stable carbon isotope ratios of natural materials:1. Sample preparation and mass spectrometric analysis. In: Coleman DC editor. Carbon Isotope Techniques. Academic press Ltd, London. 155–186.
37. Ross DJ (1992) Influence of sieve mesh size on estimates of microbial carbon and nitrogen by fumigation-extraction procedures in soils under pasture. Soil Biol Biochem 24: 343–350.