Submitted 18 December 2014 Accepted 19 June 2015 Published23 July 2015
Corresponding author
DVM Bishop,
Academic editor
Claire Fletcher-Flinn
Additional Information and Declarations can be found on page 10
DOI10.7717/peerj.1098
Copyright
2015 Duffet al.
Distributed under
Creative Commons CC-BY 4.0
OPEN ACCESS
Early prediction of language and literacy
problems: is 18 months too early?
Fiona J. Duff, Kate Nation, Kim Plunkett and DVM Bishop Department of Experimental Psychology, University of Oxford, UK
ABSTRACT
There is a lack of stability in language difficulties across early childhood: most late talkers (LTs) resolve their difficulties by pre-school; and a significant number of children who were not LTs subsequently manifest language difficulties. Greater reliability in predicting individual outcomes is needed, which might be achieved by waiting until later in development when language is more stable. At 18 months, productive vocabulary scores on the Oxford Communicative Developmental Inventory were used to classify children as LTs or average talkers (ATs). Thirty matched-pairs of LTs and ATs were followed up at school-age (average age 7 years), when language and literacy outcomes were assessed. For 18 children, intermediate testing at age 4 had classified them as showing typical development (TD) or specific language impairment (SLI). After correcting for multiple comparisons, there were no significant differences between the LTs and ATs on any outcome measure, and the LTs were performing in the average range. However, there were large-sized effects on all outcomes when comparing the TD and SLI groups. LT status on its own is not determinative of language and literacy difficulties. It would therefore not be appropriate to use expressive vocabulary measures alone to screen for language difficulties at 18 months. However, children with language impairment at age 4 are at risk of enduring difficulties.
Subjects Child Development, Psychology
Keywords Late talkers, Specific language impairment, Language, Literacy
The term ‘late talkers’ (LTs) generally refers to young children aged 18- to 35-months who are slow to develop spoken language in the absence of any known primary cause (Rescorla, 2011). Prevalence rates for LTs differ according to the inclusion criteria and the population sampled, but a recent study of a large community sample suggested that as many as 20% of young children can be classified as LTs (Reilly et al., 2007). A key question is whether LTs should be a cause for concern; here there can be a mismatch between views of academic researchers and those concerned with policy.
It is also important to consider the longer-term outcomes of LTs, given the proposal that children whose language skills appear to have normalised will in fact manifest language and literacy difficulties later in development—so called illusory recovery (Scarborough & Dobrich, 1990; but seeDale et al., 2014). In fact, the majority of LTs perform in the average range on language and literacy measures in the later primary school years and beyond, though often at a level significantly below that of their unaffected peers (e.g.,Dale & Hayiou-Thomas, 2013;Paul et al., 1997;Rescorla, 2002;Rescorla, 2005;Rescorla, 2009;
Rice, Taylor & Zubrick, 2008). In the main, then, the language difficulties of most LTs are short-lived.
Nevertheless, outside of academia there are those who claim that LTs should be identified and supported early on. The logic is that by intervening early, there is a better chance of avoiding the worst outcomes and of making effective changes while the brain is still plastic. This viewpoint is articulated by theC4EO Early Intervention Expert Group (2010), who note that many children with language delay catch up with their peers, but assert that this is because they have had “the right support.” This is rather misleading, since most studies report good outcomes despite lack of intervention. This is a critical point, because if there is spontaneous improvement in LTs, then early intervention is not warranted, especially if it takes funds from other deserving causes. Unfortunately, spontaneous improvement can also reinforce the misapprehension surrounding outcomes of LTs: if these children are identified and provided with intervention, they then improve, and the improvement is attributed to the intervention. The lack of treatment effect is only evident if one studies an untreated group of LTs, as was done in the study byWake et al. (2011). Nevertheless, the view remains among some of those influencing policy that a child’s vocabulary level at or before 2 years of age can be used to predict language and pre-literacy skills at school entry (e.g.,Roulstone et al., 2011).
METHOD
Participants
Children in the present study were all part of a broader research programme investigating language and literacy development (Duffet al., 2015). Informed written parental consent was given for all participants, and ethical approval was granted by the University of Oxford’s Central University Research Ethics Committee (MSD/IDREC/C1/2012/56). For the main project, 300 children whose vocabularies had been measured in infancy (between 16 and 24 months) were followed-up at school-age, when they were aged between 4 and 9 years old. Though age was allowed to vary at both test points, it was accounted for in the statistical analyses.
In the present report, we followed earlier investigations (e.g.,Bishop et al., 2012) by focusing on those children whose vocabulary was measured at 18–19 months (N=153).
These children were subsequently classified either as ‘late talkers’ (LTs) or ‘average talkers’ (ATs). Classification procedures followed that ofBishop et al. (2012)and used data from theOxford Communicative Development Inventory(OCDI;Hamilton, Plunkett & Schafer, 2000). This Anglicised adaptation of the American CDI (Fenson et al., 1994) comprises 416 words, and parents were required to indicate which of these words their child was able to understand (comprehension) and understand and say (production). The first 12 items, which are instances of onomatopoeia, were excluded from analyses leaving a total of 404 items. Children were categorised as LTs if their raw OCDI productive vocabulary score at 18 or 19 months of age (t1) was 10 words or fewer. In the sample used byBishop et al. (2012)this equated to performance levels at least 1 SD below the mean (seehttps://osf. io/t35af/). However, for the current, slightly younger sample, this cut-offcorresponded to the 25th centile for the norms ofHamilton, Plunkett & Schafer (2000), whereas a cut-off
of six words or less corresponded to the 16th centile (i.e., equivalent to one SD below the mean). We used the more liberal criterion of 10 words or fewer for this study, but in the analysis, we consider the extent to which the inclusion of children with only mild delays affects the findings. Thirty (22 boys) of the 153 children were classified as LTs (20%) using the 10-word cut-off, and twenty of these met the more stringent cut-offof six words or fewer. FollowingBishop et al. (2012), ATs were those children whose OCDI production raw scores fell between 14 and 65 out of 404; this corresponds to the 31st to 73rd centile on the norms for 18- to 19-month-olds fromHamilton, Plunkett & Schafer (2000). This yielded 66 children, of whom 30 were matched pairwise to the LTs, based on gender and age att2 (average absolute difference in age=1.33 months, range=0–3 months).
Table 1 Comparison of average talkers (ATs) and late talkers (LTs) on vocabulary knowledge att1, and demographic factors att1 andt2, with strict and lax definition of LTs.
Measure LT definition N AT mean (SD) LT mean (SD) t p d
OCDI Comprehensiont1 ≤10 words 30 174.7 (65.74) 147.0 (7.72) 1.38 .178 0.41
≤6 words 20 190.6 (61.65) 147.1 (65.29) 1.87 .077 0.68
OCDI Productiont1a ≤10 words 30 34.77 (13.38) 5.20 (3.21) – – 3.04
≤6 words 20 33.30 (11.55) 3.45 (2.33) – – 3.58
Aget1 (months) ≤10 words 30 18.30 (0.47) 18.23 (0.43) 0.70 .489 0.16
≤6 words 20 18.25 (0.44) 18.15 (0.37) 1.00 .330 0.25
IMD Indext1 ≤10 words 26 24,900 (4,911) 24,985 (6,181) −0.06 .954 −0.02
≤6 words 17 24,914 (5,309) 25,692 (4,805) −0.62 .546 −0.15
Aget2 (years; months)b ≤10 words 30 7;01 (1;05) 7;01 (1;04) – – 0.02
≤6 words 20 6;11 (1;03) 6;11 (1;04) – – 0.01
IMD Indext2 ≤10 words 27 24,288 (5,910) 22,117 (7,779) 1.12 .272 0.31
≤6 words 18 24,620 (6,388) 23,322 (7,584) 0.59 .566 0.19
Notes.
aVariable used to define non-overlapping LT and AT groups. bVariable used to match groups.
Multiple Deprivation (IMD) was calculated based on postcode data to give an indication of socioeconomic status (SES). The IMD returns rank-ordered data, ranging from 1 (high deprivation) to 32,482 (low deprivation). Both groups have IMD scores higher than the national average (16,241) but similar to the average for their local county of Oxfordshire (21,809) (Department for Communities and Local Government, 2011). IMD did not differ significantly between the two groups at either time point.
Of the 30 matched AT/LT pairs in the present study, 9 had previously been assessed at age 4 as part of a separate study byBishop et al. (2012). At that time point, children were categorised according to whether or not they reached criteria for Specific Language Impairment (SLI). Full details are given inBishop et al. (2012). Briefly, children were identified as having SLI if their performance was impaired on at least two language measures, but their nonverbal IQ was in the average range (≥85). Children were classified
as having typical development (TD) if no more than one language measure was impaired, and their nonverbal IQ was in the average range. In both the AT and LT groups, 3 children were classified as having SLI and 6 children as TD.1
1The rate of ATs with SLI in the current study is higher than expected, possibly due to sampling bias, if parents whose children had language problems were more willing to consent to the follow-up. In the original study with a larger sample, the rates were 29% of LTs and 14% of ATs (seeBishop et al., 2012).
Measures
Vocabulary knowledge
TheReceptiveandExpressive One Word Picture Vocabulary Tests(Brownell, 2000) were administered. To assess receptive vocabulary, children heard a series of graded words, and were asked to select the corresponding picture from four alternatives for each word (test/re-test reliability=.78 to .93). For expressive vocabulary, children were required to
Phonological short-term memory
Measures of nonword and sentence repetition tapped short-term memory for verbal information. On theChildren’s Test of Nonword Repetition(Gathercole & Baddeley, 1996), children repeated aloud 40 individual nonwords, ranging from two to five syllables in length (test/re-test reliability=.72). For theRecalling Sentencessubtest of theClinical
Evaluation of Language Fundamentals(CELF-III UK–Semel, Wiig & Secord, 2000), children were required to repeat orally presented sentences of increasing length and grammatical complexity (test/re-test reliability=.93 to .94).
Phonological awareness
TheElisionsubtest of theComprehensive Test of Phonological Processing(Wagner, Torgesen & Rashotte, 1999) was administered. For each orally presented word, children were asked to delete a sublexical unit (syllable or phoneme) and supply the word that remained (test/re-test reliability=.79 to .88).
Reading accuracy
For theDiagnostic Test of Word Reading Processes(Forum for Research into Language and Literacy, 2012), children read aloud lists of graded nonwords, regular words and exception words (reliability,α=.99).
Reading comprehension
Passage reading comprehension was assessed in children aged 5 upwards via theYork Assessment of Reading Comprehension(Snowling et al., 2009). Children read aloud two short stories and after each story answered a series of eight related questions (reliability,
α=.48 to .77).
Nonverbal ability
Nonverbal reasoning was assessed via theMatricessubtest of theBritish Abilities Scale II(Elliot, Smith & McCulloch, 1997). Children were presented with an incomplete matrix of abstract figures and were instructed to choose the correct shape from an array of six to complete the matrix (test/re-test reliability=.64).
Procedure
For the follow-up assessments att2, children were seen individually by a member of the research team. Assessment sessions lasted approximately 1 h and were conducted at school, home, or the Department of Experimental Psychology, University of Oxford.
RESULTS
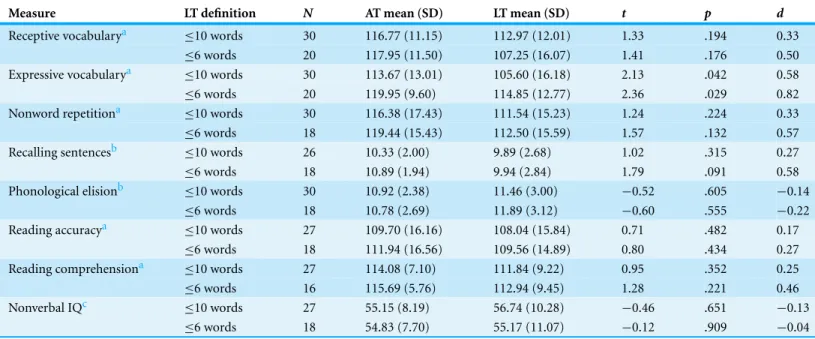
Table 2 Language, literacy and nonverbal measures att2 for full sample of Average Talkers (ATs) and Late Talkers (LTs), with strict and lax definitions of LT.
Measure LT definition N AT mean (SD) LT mean (SD) t p d
Receptive vocabularya ≤10 words 30 116.77 (11.15) 112.97 (12.01) 1.33 .194 0.33
≤6 words 20 117.95 (11.50) 107.25 (16.07) 1.41 .176 0.50
Expressive vocabularya ≤10 words 30 113.67 (13.01) 105.60 (16.18) 2.13 .042 0.58
≤6 words 20 119.95 (9.60) 114.85 (12.77) 2.36 .029 0.82
Nonword repetitiona ≤10 words 30 116.38 (17.43) 111.54 (15.23) 1.24 .224 0.33
≤6 words 18 119.44 (15.43) 112.50 (15.59) 1.57 .132 0.57
Recalling sentencesb ≤10 words 26 10.33 (2.00) 9.89 (2.68) 1.02 .315 0.27
≤6 words 18 10.89 (1.94) 9.94 (2.84) 1.79 .091 0.58
Phonological elisionb ≤10 words 30 10.92 (2.38) 11.46 (3.00) −0.52 .605 −0.14
≤6 words 18 10.78 (2.69) 11.89 (3.12) −0.60 .555 −0.22
Reading accuracya ≤10 words 27 109.70 (16.16) 108.04 (15.84) 0.71 .482 0.17
≤6 words 18 111.94 (16.56) 109.56 (14.89) 0.80 .434 0.27
Reading comprehensiona ≤10 words 27 114.08 (7.10) 111.84 (9.22) 0.95 .352 0.25
≤6 words 16 115.69 (5.76) 112.94 (9.45) 1.28 .221 0.46
Nonverbal IQc ≤10 words 27 55.15 (8.19) 56.74 (10.28) −0.46 .651 −0.13
≤6 words 18 54.83 (7.70) 55.17 (11.07) −0.12 .909 −0.04
Notes.
Standardised score means shown here to allow comparison with norms;t-tests were performed on age-residualised raw scores (see text). aStandardised scores are standard scores (M=100, SD=15).
bStandardised scores are scaled scores (M=10, SD=3). cStandardised scores areTscores (M=50, SD=10).
dataset ofN=300 fromDuffet al., 2015). This gives scores that are highly correlated with
the standardised scores but with greater precision. (To facilitate readability ofTable 2, these means are not included; the data are available inSupplemental Information).
There is a trend for the LTs to have lower scores on most measures (apart from phonological elision and nonverbal IQ). Matched-pairst-tests were performed on the age-regressed scores to assess whether there were any significant differences between the groups. Effect sizes (Cohen’sd) were calculated for each contrast by dividing the difference in group means by the pooled standard deviation;ds of 0.2, 0.5 and 0.8 represent small, medium and large effects, respectively (Cohen, 1992). Concerning the sample of 30 LTs and their matched ATs, there was a significant medium-sized effect on expressive vocabulary. However, after correcting for multiple comparisons using the Benjamini–Hochberg procedure (Benjamini & Hochberg, 1995), this difference was no longer significant. There was no effect of group on any of the remaining language, literacy, or nonverbal measures.
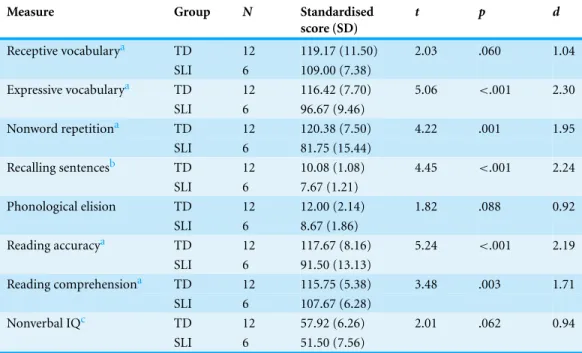
Table 3 Language, literacy and nonverbal scores att2 for the subsample, grouped by language status at 4 years of age (Typical Development (TD) vs. Specific Language Impairment (SLI)).
Measure Group N Standardised
score (SD)
t p d
Receptive vocabularya TD 12 119.17 (11.50) 2.03 .060 1.04
SLI 6 109.00 (7.38)
Expressive vocabularya TD 12 116.42 (7.70) 5.06 <.001 2.30
SLI 6 96.67 (9.46)
Nonword repetitiona TD 12 120.38 (7.50) 4.22 .001 1.95
SLI 6 81.75 (15.44)
Recalling sentencesb TD 12 10.08 (1.08) 4.45 <.001 2.24
SLI 6 7.67 (1.21)
Phonological elision TD 12 12.00 (2.14) 1.82 .088 0.92
SLI 6 8.67 (1.86)
Reading accuracya TD 12 117.67 (8.16) 5.24 <.001 2.19
SLI 6 91.50 (13.13)
Reading comprehensiona TD 12 115.75 (5.38) 3.48 .003 1.71
SLI 6 107.67 (6.28)
Nonverbal IQc TD 12 57.92 (6.26) 2.01 .062 0.94
SLI 6 51.50 (7.56)
Notes.
Raw scores were corrected for age att2;t-tests were performed on the age-regressed scores. aStandardised scores are standard scores (M=100, SD=15).
bStandardised scores are scaled scores (M=10, SD=3). cStandardised scores areTscores (M=50, SD=10).
Pearson correlations were computed between thet1 OCDI production score of the LT member of a pair and the difference between pair members on each of thet2 variables from
Table 2. None of the correlations was significant at the .05 level.
We turn now to the subsample of 9 AT/LT matched pairs who had previously been assessed at age 4. Att2 in the present study, they were on average aged 8 years, 9 months (range=8;01 to 9;04). Contrasts between this subsample of ATs and LTs were similar to
those for the whole sample: there were no significant differences (allps>.20).
Table 3shows how LI status at 4 years relates to outcomes att2. The TD group performed in the average to above average range on all outcomes, while the SLI group performed in the below average to high-average range. Comparison of age-regressed scores across the two groups revealed large-sized effects on all outcome measures, favouring the TD group. According to independent samplest-tests, the group effect was significant (even after correcting for multiple comparisons) for expressive vocabulary, nonword repetition, recalling sentences, reading accuracy and reading comprehension. The group effect was not significant for receptive vocabulary, phonological elision, or nonverbal IQ.
DISCUSSION
us to test the hypotheses that the subsequent language and literacy skills of LTs would be in the average range for their age, but fall below the level of their unaffected peers (ATs); and that language status at 4 years would be more indicative of outcomes than language status at 18 months.
Regarding the first hypothesis, the LT group performed comfortably in the average range on all language, literacy and nonverbal measures—with very few individuals reaching criterion for an impairment. In fact, there were no statistically significant differences between the LTs and ATs on any of the outcomes, and all contrasts reflected small effect sizes—except on expressive vocabulary where there was a medium-sized effect in favour of the ATs. Overall, then, we found no evidence for subclinical problems in this group of LTs. We considered whether this null result might be due to use of a lax cut-offfor LTs of 10 words or fewer on OCDI Production. However, results were virtually identical when analysis was confined to the 20 LTs with more serious expressive delays, with six words or fewer att1. Furthermore, the severity of vocabulary delay att1 was unrelated to the size of difference between LTs and their matched AT controls att2. Note, however, that we did not include a measure of grammatical ability att2; thus, it remains possible that weaknesses may have been detected in this area of language.
the age at which the child starts to rapidly acquire words. There appears to be a wide range of normal variation in the latter process which can be seen as part of maturation rather than reflective of any disorder. The older a child is, the lower the probability that poor language is just due to normal maturational variation.
A question of interest concerns the optimal age to identify children at risk for persistent language difficulties: given that prediction is poor at 18 months and good at 4 years, we may ask whether there is a step change in predictive utility of language assessment.
Dollaghan & Campbell (2009)found that children with a vocabulary deficit at 4 years had a significantly increased risk for manifesting a vocabulary deficit at 6 years, while a deficit at 3 years was not associated with a later impairment. This provides some indication that prediction of outcomes improves after age 3; however, the authors were cautious about their results, as a slight change to the criterion for a vocabulary deficit rendered the elevated risk of persistent deficits from 4 to 6 years nonsignificant. A recent study by
Dale & Hayiou-Thomas (2013)showed that the odds of having a language or literacy difficulty at age 12 were higher for LTs identified at age 3 rather than at age 2. However, these difficulties were still only apparent in a minority of children, and the ability to predict which of the LTs at age 3 would subsequently manifest an impairment was poor. This suggests that even prediction of outcomes from age 3 is not sufficiently reliable (see also
Zambrana et al., 2014).
ADDITIONAL INFORMATION AND DECLARATIONS
Funding
This research was funded by the Nuffield Foundation (grant number EDU/40062 awarded to K Nation and K Plunkett). DVM Bishop is supported by the Wellcome Trust Programme grant 082498/Z/07/Z. The funders had no role in study design, data collection and analysis, decision to publish, or preparation of the manuscript.
Grant Disclosures
The following grant information was disclosed by the authors: Nuffield Foundation: EDU/40062.
Wellcome Trust Programme: 082498/Z/07/Z.
Competing Interests
The authors declare there are no competing interests.
Author Contributions
• Fiona J. Duffconceived and designed the study, collected the data, analyzed the data,
wrote the paper, prepared figures and/or tables, reviewed drafts of the paper.
• Kate Nation conceived and designed the study, reviewed drafts of the paper.
• Kim Plunkett provided access to the time 1 data and to norms for OCDI, and reviewed
drafts of the paper.
• DVM Bishop analyzed the data, wrote the paper, reviewed drafts of the paper.
Human Ethics
The following information was supplied relating to ethical approvals (i.e., approving body and any reference numbers):
Informed parental consent was given for all participants, and ethical approval was granted by the University of Oxford’s Central University Research Ethics Committee, as part of a broader and related research project.
Reference number: MSD/IDREC/C1/2012/56.
Data Deposition
The following information was supplied regarding the deposition of related data: Open Science Framework:https://osf.io/t35af/.
Supplemental Information
Supplemental information for this article can be found online athttp://dx.doi.org/ 10.7717/peerj.1098#supplemental-information.
REFERENCES
Bishop DVM, Holt G, Line E, McDonald D, McDonald S, Watt H. 2012.Parental phonological memory contributes to prediction of outcome of late talkers from 20 months to 4 years: a longitudinal study of precursors of specific language impairment.Journal of Neurodevelopmental
Disorders4:3DOI 10.1186/1866-1955-4-3.
Brownell R. 2000.Expressive and receptive one word picture vocabulary tests. 2nd edition. Novato: Academic Therapy Publications.
C4EO Early Intervention Expert Group. 2010.Grasping the nettle: early intervention for children,
families and communities. London: C4EO.
Cohen J. 1992.A power primer.Psychological Bulletin112:155–159 DOI 10.1037/0033-2909.112.1.155.
Dale PS, Hayiou-Thomas ME. 2013.Outcomes for late talkers. In: Rescorla LA, Dale PS, eds.
Late talkers: language development, interventions, and outcomes. Baltimore: Brookes Publishing,
241–257.
Dale PS, McMillan AJ, Hayiou-Thomas ME, Plomin R. 2014.Illusory recovery: are recovered
children with early language delay at continuing elevated risk? American Journal of
Speech-Language Pathology23:437–447DOI 10.1044/2014 AJSLP-13-0116.
Dale PS, Price TS, Bishop DVM, Plomin R. 2003.Outcomes of early language delay 1. Predicting
persistent and transient language difficulties at 3 and 4 years.Journal of Speech, Language, and
Hearing Research46:544–560DOI 10.1044/1092-4388(2003/044).
Department for Communities and Local Government. 2011.English indices of deprivation 2010:
overall.Available at https://www.gov.uk/government/publications/english-indices-of-deprivation-2010(accessed 20 August 2014).
Dollaghan CA, Campbell TF. 2009.How well do poor language scores at ages 3 and 4 predict
poor language scores at age 6?International Journal of Speech-Language Pathology11:358–365 DOI 10.1080/17549500903030824.
DuffFJ, Reen G, Plunkett K, Nation K. 2015.Do infant vocabulary skills predict school-age language and literacy outcomes?Journal of Child Psychology and Psychiatry56(8):848–856 DOI 10.1111/jcpp.12378.
Elliot CD, Smith P, McCulloch K. 1997.British ability scales II. Windsor: NFER Nelson.
Fenson L, Dale PS, Reznick JS, Bates E, Thal D, J, Pethick SJ. 1994.Variability in early communicative development.Monographs for the Society for Research in Child Development
59:1–185DOI 10.2307/1166093.
Forum for Research into Language and Literacy. 2012.Diagnostic test of word reading processes. London: GL Assessment.
Gathercole SE, Baddeley AD. 1996.The children’s test of nonword repetition. London: Psychological Corporation.
Ghassabian A, Rescorla L, Henrichs J, Jaddoe VW, Verhulst FC, Tiemeier H. 2013.Early lexical
development and risk of verbal and nonverbal cognitive delay at school age.Acta Paediatrica
103:70–80DOI 10.1111/apa.12449.
Hamilton A, Plunkett K, Schafer G. 2000.Infant vocabulary development assessed with a
British communicative development inventory.Journal of Child Language27:689–705 DOI 10.1017/S0305000900004414.
Henrichs J, Rescorla L, Schenk JJ, Schmidt HG, Jadooe VWV, Hofman A, Raat H, Verhulst FC,
Tiemeier H. 2011.Examining continuity of early expressive vocabulary development:
Law J, Rush R, Anandan C, Cox M, Wood R. 2012. Predicting language change between 3 and 5 years and its implications for early identification. Pediatrics130:E132–E137 DOI 10.1542/peds.2011-1673.
Paul R, Murray C, Clancy K, Andrews D. 1997.Reading and metaphonological outcomes
in late talkers. Journal of Speech, Language, and Hearing Research40(5):1037–1047 DOI 10.1044/jslhr.4005.1037.
Reilly S, Wake M, Bavin EL, Prior M, Williams J, Bretherton L, Eadie P, Barrett Y,
Ukomunne OC. 2007.Predicting language at 2 years of age: a prospective community study.
Pediatrics120:e1441–e1449DOI 10.1542/peds.2007-0045.
Reilly S, Wake M, Ukoumunne OC, Bavin E, Prior M, Cini E, Conway L, Eadie P, Bretherton L. 2010.Predicting language outcomes at 4 years of age: findings from early language in Victoria study.Pediatrics126:e1530–e1537DOI 10.1542/peds.2010-0254.
Rescorla L. 2002.Language and reading outcomes to age 9 in late-talking toddlers.Journal of
Speech, Language, and Hearing Research45:360–371DOI 10.1044/1092-4388(2002/028).
Rescorla L. 2005.Age 13 language and reading outcomes in late-talking toddlers.Journal of Speech,
Language, and Hearing Research48:459–472DOI 10.1044/1092-4388(2005/031).
Rescorla L. 2009.Age 17 language and reading outcomes in late-talking toddlers: support for a dimensional perspective on language delay.Journal of Speech, Language, and Hearing Research
52:16–30DOI 10.1044/1092-4388(2008/07-0171).
Rescorla L. 2011.Late talkers: do good predictors of outcome exist?Developmental Disabilities
Research Reviews17:141–150DOI 10.1002/ddrr.1108.
Rice ML, Taylor CL, Zubrick SR. 2008.Language outcomes of 7-year-old children with or without
a history of late language emergence at 24 months.Journal of Speech, Language, and Hearing
Research51:394–407DOI 10.1044/1092-4388(2008/029).
Roulstone S, Law J, Rush R, Clegg J, Peters T. 2011.Investigating the role of language in children’s early educational outcomes: an analysis of data from the Avon Longitudinal Study of Parents and
Children (ALSPAC). Nottingham: Department of Education.
Scarborough HS, Dobrich W. 1990.Development of children with early language delay.Journal of
Speech and Hearing Research33:70–83DOI 10.1044/jshr.3301.70.
Semel E, Wiig E, Secord W. 2000.Clinical evaluation of language fundamentals (CELF-III UK). London: Psychological Corporation.
Snowling MJ, Stothard SE, Clarke P, Bowyer-Crane C, Harrington A, Truelove E, Nation K, Hulme C. 2009.York assessment of reading for comprehension. London: GL Assessment.
Wagner R, Torgesen JK, Rashotte CA. 1999.Comprehensive test of phonological processes. Austin: Pro-Ed.
Wake M, Tobin S, Girolametto L, Ukomunne OC, Gold L, Levickis P, Sheehan J, Goldfeld S,
Reilly S. 2011.Outcomes of population based language promotion for slow to talk toddlers
at ages 2 and 3 years: Let’s Learn Language cluster randomised controlled trial.British Medical
Journal343:d4741DOI 10.1136/bmj.d4741.
Zambrana IM, Pons F, Eadie P, Ystrom E. 2014.Trajectories of language delay from age 3 to
5: persistence, recovery and late onset.International Journal of Language and Communication