THE NEW U.S. INITIATIVE IN CHILDHOOD IMMUNIZATION’
Alan R. I&man’
In 1977 the United States launched a major domestic campaign to promote childhood immunization. This presentation describes the nature of that campaign, current U.S. childhood immunization levels, and future plans.
On 6 April 1977 the United States Secre- tary of Health, Education, and Welfare announced a national childhood immuni- zation initiative. This undertaking had two goals: (1) attainment of immunization levels of 90 per cent in our nation’s chil- dren by October 1979; and (2) establish- ment of a permanent system to provide comprehensive immunization services to the 3 million U.S. children born each year.
In making his announcement, the Sec- retary cited figures from the 1976 U.S. Immigration Survey showing that in order for children l-4 years of age to be ade- quately protected:
l more than one-fourth needed at least
one DTP shot
l more than one-third needed at least
one dose of oral polio vaccine
l more than one-third needed their
measles shot
l more than one-third needed their
rubella shot
l more than one-third needed their
mumps shot.
According to the survey, nearly 20 million U.S. children needed at least one dose of one vaccine in order to be fully protected. The poor and the nonwhite
‘Based on a paper presented on 17 April 19’78 at the XXXVI Annual Meeting of the U.S.-Mexico Border Health Association held at Reynosa, Tamaulipas, Mexico.
‘Director, Immunization Division, Bureau of State Services, United States Center for Disease Control, Atlanta, Georgia, U.S.A.
were disproportionately represented among those in need.
Stating that “our national failure to pro- tect our young from preventable diseases is shocking” and a “national disgrace,‘.’ the Secretary qutlined a broad-based program including increased federal support for im- munizations, increased involvement of volunteers in all aspects of immunization activities, increased public awareness and public education activities, and increased cooperation between government agencies.
Since the-secretary’s announcement, a lot of work has been devoted to the initiative. Most efforts to date have related to the first of the two goals: that of reducing the back- log of incompletely immunized children. I should therefore like to summarize here the progress made in 1977. This presentation will deal first with the general program components outlined by the Secretary and then with the subjects of disease incidence, program activities, and evaluation.
Elements Contributing to the Initiative
Increased Federal Su@ort
Federal support for immunization activ- ities has increased substantially, with US$23 million being appropriated for grant support in fiscal year (FY) 1978, as com- pared to $17 million in FY 1977 and only $4.9 million in FY 1976. For the next fiscal year, $35 million in project grant support has been requested. In addition to this cate- gorical support, other federal agencies have been increasing the level of their support
for immunization activities, although pre- cise dollar figures are not currently available.
Increased Use
of Volunteers
Nearly all the states have identified lead volunteer agencies and have begun develop- ing specific plans for the use of volunteers. Some have progressed even further. Arkan- sas continues in the forefront in this regard with a unique mixture of paid employees, employees placed on a “free time” status by their employers, and volunteers involved in all aspects of program work.
Increased
Public
Information andPublic
Education Activities
A pamphlet entitled
Parent’s Guide to
Childhood Immunizations
has been pre-pared and distributed nationally. A series of mass media materials, including TV and radio spot announcements, and press re- leases, have been developed and are now
being distributed. A coloring book has been composed and is available for distribution. Romper Room has completed taping a series of puppet skits about immunizations that was played to its audience of 1.5 million preschool children.
Increased
Interagency Cooperation
An Immunization Initiative Project Office has been established in the Office of the Assistant Secretary for Health in Wash- ington. This office is charged with overall management of the initiative; it is particu- larly concerned with cooperation between agencies within the Department of Health, Education, and Welfare and between other cabinet-level departments.
Disease Incidence
Reduced occurrence of vaccine-prevent- able diseases is the single most important indicator of success. Hence I should like to
make a few comments about the incidence of the seven diseases preventable by routine childhood vaccination.
Measles
A provisional total of 55,974 measles cases was reported for 1977, representing an increase of 37.8 per cent over 1976. Nevertheless, this increase was only ap- parent during the early part of the year; on entering a new season in October, a substan- tial reduction in weekly incidence was ob- served-as compared with both the preced- ing year and the 5-year average (Figure 1). This trend continued into 1978.
Many factors are doubtless involved in this recent, encouraging decline. These include the natural periodicity of measles, a reduction in the pool of susceptibles through natural infection, and a striking increase in the administration of measles vaccine within the United States. At this point it is impossible to say which of these factors is most important,
Rubella
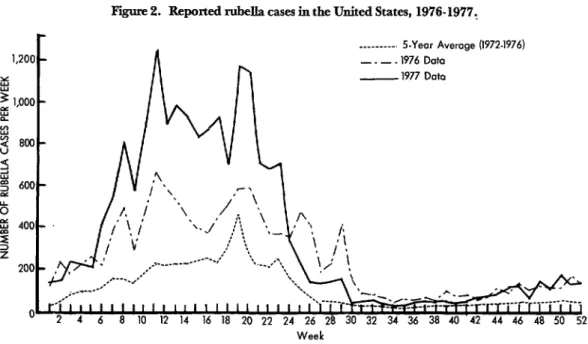
Rubella incidence was also up in 1977, with a provisional total of 20,135 cases re- ported-a 64.5 per cent increase over 1976. To a lesser extent than measles, the weekly incidence of rubella-relative to previous years-declined as we entered the “low” season (Figure 2).
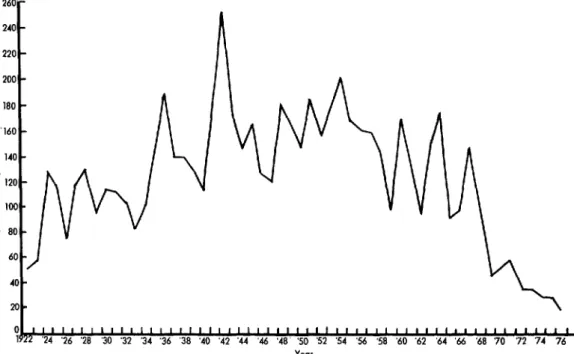
Mumps
The incidence of this disease has con- tinued its downward trend (Figure 3). The provisional total of reported cases was only 21,337 for 1977, a decrease of 45.3 per cent over 1976.
Poliomyelitis
Continuing at a very low level (Figure 4), the incidence of poliomyelitis showed an increase in 1977 over 1976, there being 17 cases provisionally reported for 1977, as compared to 12 cases for 1976.
Figure 2. Reported rubella cases in the United States, 1976-1977,
Figure 3. Reported mumps cases in the United States, 1922-1977.
260’
240
Figme 4. Paralytic and overall poliomyelitis cases estimated and reported in the United States, 1941-1977.*
f
:: tnactivoted
::
I ! Vaccine
No. of No. af
Cares .%t*r
195? 21.269 48
1960 2.525 40
1970 31 7
1976 E I1
1977; 9
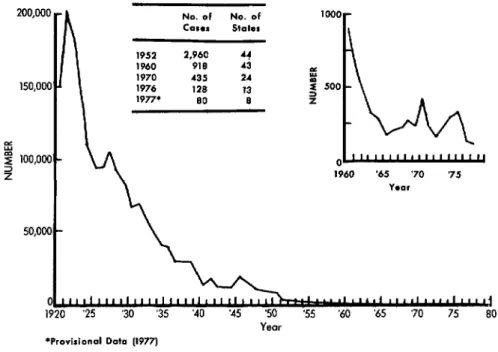
Figure 5. Reported diphtheria cases in the United States, 1920-1977.
No. of No. of
COWS states
1970 435 24
1976 128 13
I 1977* SO 8 1
E
z 100,000 2 2
50,000 '
1960 ‘65 ‘70 ‘75
YeOr
1920 ‘25 ‘30 ‘35
*Provisional Data (1977)
‘50 Yeor
‘55 ‘60 ‘65 ‘70 75 80
Diphtheria and Tetaizus
The occurrence of diphtheria (Figure 5) was at an all-time low in 1977, with a provi- sional total of only 84 cases reported from eight states. A similarly gratifying decline was seen in the number of tetanus cases (Figure 6), which reached an all-time low of 70 cases reported from 26 states.
Pertussis
Pertussis incidence, on the other hand, proved mystifying. Although the level of pertussis reported in 1977 was considerably below that reported as recently as 1970, there was a substantial increase in 1977 as compared to 1976 (Figure 7); nor did the incidence curve follow its usual pattern by remaining fairly flat throughout the year. Instead there was a substantial and sustained increase in reported cases during the second half of the year. The reasons for this increase are not clear but could relate to
Figure 6. Reported tetanus cases in the United States, 1947-1977.
100 -
80 -
20 -
Figure 7. Reported pertussis cases in the United States, 19761977.
No. of No. of
CCISOS states
- 1952 1940 1970 1976 1977
45,030 48
14,809 48
4,249 46
1,010 45
* 1,890 41
cm---s 5sYear Awrnm 11977.197d I
--- - 1976 Da
7-77 m-
01 ““r’rrr”t”“““““’ 2 4 6 8 10 12 14 16 18 20 22 24 26 28 30 32 34 36 38 40 42 44 46 48 50 52 c
l Provitionof Data Week
breaks appeared in the Center for Disease these observed increases partly reflects Control’s
Morbidity and Mortality Weekly
diminished activity at the end of 1976, but itReport
in weeks 31 and 37. The increase is clear that there has also been a significant seen in the latter part of 1977 has continued rise in activity compared to previous levels.into 1978. ’ The relatively small increase in polio
vaccine administration was probably due to
program Activities a change in the number of recommended
doses and the (temporary) shortages of polio One result of the increased financial vaccine suffered during the winter of 1976- support mentioned earlier has been a sub- 1977.
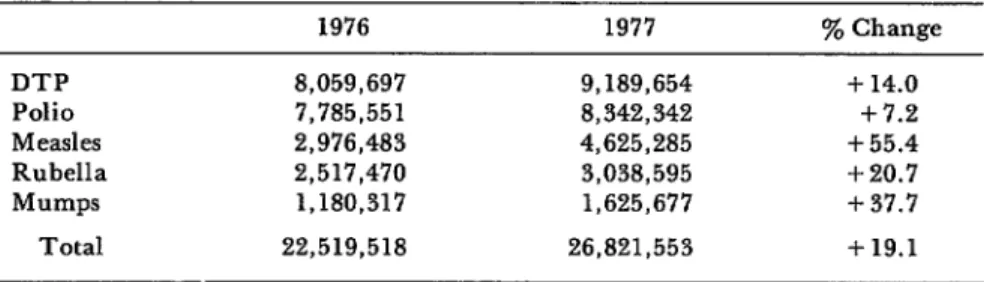
stantial upswing in vaccine administration One major change in the procedure for in the public sector. Immunizations are delivering immunizations in the public being given at a wider variety of times and sector has resulted from the development of places than in the past, and the number of a series of forms explaining vaccination vaccine doses administered has increased risks and benefits and from the require- substantially (Table 1). The magnitude of ments that these forms be used with all
Table 1. Number of vaccine doses administered under the auspices of public programs in the United States, 1976 and 1977.
DTP Polio Measles Rubella Mumps
Total
1976 1977 ‘% Change
8,059,697 9,189,654 + 14.0
7,785,551 8,342,342 + 7.2
2,976,483 4,625,285 + 55.4
2,517,470 3,038,595 +20.7
1,180,317 1,625,677 + 37.7
federally supplied vaccines administered in settings other than a private physician’s office. It is also required that the forms be signed, to show that efforts have been made to inform the participants. This new ap- proach stems from two related factors: (1) a Departmental commitment to ensure that participants understand the benefits and risks of health procedures, and (2) a con- tractual assumption by the Department of the manufacturer’s “duty to warn” the pro- spective vaccine recipient about the benefits and risks of vaccination. Although there has been concern that the presentation of risk information might scare people away, or that use of the forms might cause major administrative problems and thus impede service delivery, these have not been major problems to date.
A second substantial change-develop- ment of a nationwide vaccine reaction surveillance system-has not yet been fully implemented. This system is designed to detect serious medical events that might be related to vaccination. The trigger for re- porting such events is the statement on each vaccine information form that “If the person who received the vaccine gets sick and visits a doctor, hospital, or clinic in the four weeks after vaccination, please report
it to: .” The local
health department is responsible for identi- fying the person or place to which such events are to be reported. Information will then be forwarded to the national level using a standard format. A somewhat simi- lar system was used during the swine influenza immunization program and was partly responsible for identifying the asso- ciation between influenza vaccine and Guillain-Barr& syndrome.
During the next two years, all states will review the immunization status of children in all grades of all schools. Some states have already completed this review. (In Missouri, for example, this assessment has already entailed review of the immunization status of more than 1 million children.)
Evaluation
One of the most challenging and frustrat- ing parts of the whole program is evalua- tion. While the occurrence of disease is clearly an important evaluative tool, so many variables are involved that one must be careful in inferring cause and effect re- lationships between morbidity levels and program operations.
Surveys are an important means of eval- uating immunization status. Each state has had experience with immunization status surveys of students at the time of school entry, and most have had experience with surveys of two-year-olds. Two-year-old sur- veys are typically carried out using birth certificates to construct the sample, and have customarily included questions relat- ing to the number and type of immuniza- tions received.
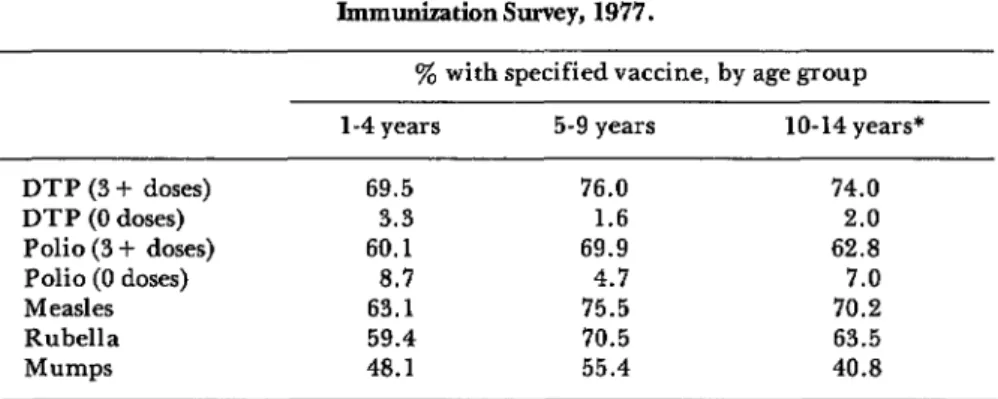
In addition, one of the most important tools available for evaluation work has tra- ditionally been the U .S. Immunization Sur- vey carried out by the Bureau of the Census each September. Summary results of the 1977 survey are presented in Table 2. Im- munization levels (all antigens) in the 1 to 4 year age group declined slightly between September 1976 and September 1977. For the 5 to 9 year age group there was a slight decline in polio and DTP immunization levels, a slight increase in measles and rubella levels, and a substantial increase (4.7 per cent) in mumps levels.
Table 2. Reported childhood immunization levels, U.S. Immunization Survey, 1977.
% with specified vaccine, by age group
l-4 years 5-9 years lo-14 years*
DTP (3 + doses) 69.5 76.0 74.0
DTP (0 doses) 3.3 1.6 2.0
Polio (3 + doses) 60.1 69.9 62.8
Polio (0 doses) 8.7 4.7 7.0
Measles 63.1 75.5 70.2
Rubella 59.4 70.5 63.5
Mumps 48.1 55.4 40.8
*Polio: lo-14 years; DTP, measles, mumps: 10-13: rubella: 10-12.
immunizations, and it took a while to catch up again.
As mentioned at the beginning of this presentation, most efforts of the first year of the initiative have been directed at reducing the backlog of unimmunized children. Now that we are well on our way toward that objective, we are turning our attention to the specific requirements of the initiative’s second goal-to ensure that appropriate im- munization levels will be maintained.
Clearly, immunizations are only one part
of the preventive health services needed by all our citizens. They are, however, among the easiest services to deliver and to measure. Consequently, the current unsat- isfactory levels of immunization are a clear indication of how much needs to be done in this country to improve overall health status. Improvement of immunization levels is thus only a start toward ensuring that everyone receives the kind of preventive services that he or she needs, wants, and de- serves, and that we, as a nation, can afford.
SUMMARY
In April 1977 the United States Government launched a major campaign to promote child- hood immunization. Directed at seven diseases (diphtheria, tetanus, pertussis, measles, rubella, mumps, and poliomyelitis), the program has two goals: to immunize 90 per cent of all U.S. chil- dren against these diseases by October 1979; and to establish a permanent system providing com- prehensive immunization services to the 3 mil- lion children born in the U.S. each year.
Disease incidence figures for 1977 have not shown any clear downward trend. Overall, the numbers of measles, rubella, pertussis, and poliomyelitis cases reported for 1977 exceeded the numbers reported for 1976, while declines were observed in the incidences of diphtheria,