This study presents a methodology for evaluating shotcrete compressive strength. Because of the high surface roughness and low thickness of the concrete layer observed in shotcrete structures, the proposed methodology is based on the probe penetration test. In a irst phase, the variability of the probe penetration test was investigated to deine the number of tests that are required to characterise the test correlation curve. Then, a procedure that can be applied to deine the correlation curve was described. This procedure includes the moulding of shotcrete plates in loco, the control of the discharge energy of the pins, the extraction of the plates’ samples to determine the concrete compressive strength, and statistical analysis. With the test correlation curve, an evaluation of the structure and data analysis can be performed. To verify the applicability of the pro-posed methodology, the structure of a shotcrete tunnel in a small hydropower plant was investigated. In the analysed structure, strength results that were non-compliant with the project speciications and a lack of concrete homogeneity were observed. Since the analysed methodology al -lowed for the characterisation of the considered structure conditions, the proposed solution is adequate for evaluating the compression strength of shotcrete structures.
Keywords: non-destructive testing, shotcrete, probe penetration test.
Este trabalho visa apresentar uma metodologia de avaliação da resistência à compressão de concreto projetado. Em função da elevada rugosi-dade supericial e da baixa espessura da camada de concreto, observada em estruturas de concreto projetado, a metodologia proposta tem por base o ensaio de penetração de pinos. Em uma primeira etapa, a variabilidade do ensaio de penetração de pinos foi investigada de modo a deinir a quantidade de ensaios necessários para a deinição da curva de correlação do ensaio. Em seguida, o procedimento empregado na deinição da curva de correlação foi deinido. Tal procedimento inclui a moldagem de placas de concreto projetado in loco; o controle da energia de disparo dos pinos; a extração de testemunhos das placas para determinação da resistência à compressão do concreto; e a análise estatística dos dados. De posse da curva de correlação do ensaio, procede-se com a avaliação da estrutura e análise dos dados. De modo a veriicar a aplicabilidade da metodologia proposta, a estrutura de concreto projetado de um túnel em uma Pequena Usina Hidrelétrica foi investigada. Na estrutra em questão, foram observados resultados de resistência não-conformes com as especiicações de projeto e indícios de falta de homogeneidade do concreto. Uma vez que a metodologia em questão possibilitou a caracterização das condições da estrutura avaliada, pode-se airmar que a solução pro -posta neste trabalho é adequada para a avaliação da resistência à compressão de estruturas de concreto projetado.
Palavras-chave:ensaios não destrutivos, concreto projetado, ensaio de penetração de pinos.
Probe penetration test applied for evaluating shotcrete
compressive strength
Ensaio de penetração de pino aplicado na avaliação
da resistência à compressão de concreto projetado
W. R. L. da SiLva a [email protected]
L. R. PRudencio JR b [email protected]
a. L. de oLiveiRa c [email protected]
a Wilson Ricardo Leal da Silva ([email protected]) Czech Technical University in Prague. Wilson R. L. da Silva is a PhD student at the Czech
Technical University in Prague sponsored by EU Erasmus program.
b Luiz Roberto Prudencio Jr. ([email protected]) – Federal University of Santa Catarina. Luiz Roberto Prudencio Jr., Dr., is a Professor at the
Department of Civil Engineering at the Federal University of Santa Catarina, Brazil.
c Alexandre Lima de Oliveira ([email protected]) –Instituto Federal de Santa Catarina - Campus Florianopolis. Alexandre Lima de Oliveira, Dr., is a
Professor at Federal Institute of Santa Catarina.
Received: 18 Dec 2011 • Accepted: 18 Apr 2012 • Available Online: 26 Jun 2012
abstract
1. introduction
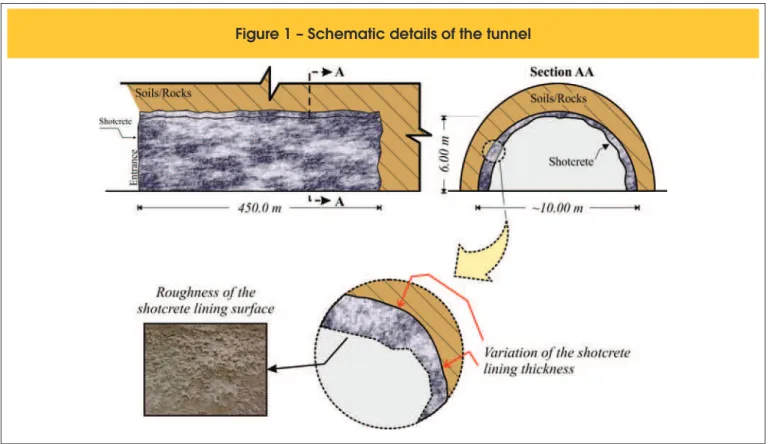
The use of shotcrete in tunnel linings is common practice. How-ever, correct measuring and projection techniques are not always employed. An example of a shotcrete structure that has demon -strated non-compliance with the mechanical properties of the con -crete was the water intake tunnel lining of a small hydroelectric plant (SHP) located at Santa Rosa de Lima, SC, Brazil.
In this structure, which is presented in Figure 1, part of the con -crete lining began displaying structural problems three weeks after the application of shotcrete onto the tunnel wall. These problems might have been originated from the projection process and/or the measuring process of the materials in the shotcrete. Therefore, this study was performed with the initial goal of deining a method-ology for the evaluation of shotcrete structures and then evaluating the compressive strength of the tunnel lining to verify the applica-bility and effectiveness of the proposed method.
Initially, the extraction of samples was considered as a method to determine the compressive strength of the concrete used in the tunnel. Nevertheless, this option was discarded because of the in-clination of the tunnel walls, the variation in the thickness of the concrete lining layer (detailed in Figure 1), and the high cost of sample extraction. Thus, the possibility of using a non-destructive test was considered. The proper type of non-destructive test had to be chosen based on the structure characteristics.
2. non-destructive tests used to assess
the structure
Several non-destructive tests are applicable in the evaluation of
concrete structures, [1,2], including the pullout test, the probe penetration test, the maturity method, the rebound hammer test, ultrasound, and impact-echo. In the present study, the relection rebound hammer test, the pin pullout test, and the probe penetra-tion test were considered. These measurements are related to technical, economic, and practical issues that will be discussed throughout this section.
The use of a rebound hammer test was the irst test possibility to be considered due to its simplicity and low cost. This test is based on the evaluation of a mass rebound after being ired against a surface at a standard energy. The rebound hammer test is widely used in evaluating inished structures. Examples of applications of this test are presented in [3], where the rebound hammer test is used to estimate the strength of reinforced concrete structures, and in [4], where the same test is considered as suitable for evaluating the uniformity of concrete structures. Regarding the assessment of tunnels, Bilgin et al., [5], presents a practical application of this test. However, the study is intended to evaluate the surface hardness of rocks with the intention of providing the energy required for blast-ing. The test could have been used in the assessment of the tunnel in question if the surface lining was regular.
The results of the rebound hammer test are affected by a number of factors, including I) the moisture conditions of the concrete sur-face, II) the presence of a surface layer of carbonated concrete, and III) the direction of the instrument, [6]. These factors, along with the construction characteristics of the tunnel, are mainly due to in-creases in the surface roughness and practically impede the use of relection sclerometry for the assessment of shotcrete structures. The use of a pullout test was also considered for the evaluation of the structure in question. The principle of this test is to mea -sure the shear stress required to pull out a pin that is embedded
ness and size of the coarse aggregate can affect the results of the test, [1,2].
As an example that is practical and directed towards the construc -tion of tunnels, the probe penetra-tion resistance test adjusted by a pneumatic system was employed by Iwaki, [8], for quality con -trol of the compressive strength of a shotcrete structure, in which a good correlation with strength values up to 30.0 MPa was ob -tained. The strength limit of 30.0 MPa is associated with the ki-netic energy level applied to the pneumatic system described by Iwaki, [8]. In the case of the Windsor test, the strength limit is as high as 40.0 MPa according to the same author.
The advantages of the probe penetration test include low cost; simplicity, as it can be easily performed by a trained technician; and speed when applying the test in structures that require a high number of tests. Based on the above considerations, the probe penetration test was chosen to evaluate the structure analysed in the present study. The energy application system of the probe penetration test used in this study consists of an adaptation of the gun used in the Windsor test.
After deining the type of non-destructive test to be used in as-sessing the shotcrete structure, the proposed methodology was deined, as presented in the following section.
3. Methodology used to assess
the shotcrete structure
The proposed methodology is divided into two stages. The irst stage consists of deining the correlation curve of the non-destruc-tive test, i.e., the relationship between the exposed length of the pin and the compressive strength of the concrete. The second stage involves in loco testing along the length of the tunnel. The com-bined results of these two stages were used to determine which parts of the structure had a compressive strength that was lower in concrete, [1]. Pullout tests, such as the Lok-test and CAPO,
are widely used to assess the quality of inished concrete struc-tures, [7].
Nonetheless, regarding shotcrete structures, pullout tests are commonly used to estimate the compressive strength of con-crete in its early stages, [8]. Moreover, Malhotra & Carino, [1], the pullout test requires a long testing time. Based on these con -siderations and the total length of the tunnel, the possibility of using the pin pullout test in evaluating the shotcrete structures was discarded.
Finally, the probe penetration test was considered. This test is based on the absorption of the initial kinetic energy of the pin by the concrete. In this case, a portion of the kinetic energy of the driven pin is absorbed by the friction between the pin and the concrete, and an additional portion of the energy is absorbed by the concrete fracture, [2].
Similar to the rebound hammer test, the probe penetration test is commonly used to evaluate the uniformity of the concrete structure, [9]. Nevertheless, when the probe penetration test is used to estimate the concrete strength, it is recommended to deined a correlation curve for the tests results for the particular concrete type to be investigated, [1,2,10].
One of the probe penetration tests reported in the literature is that proposed by Al-Manaseer and Nasser, [11], the test relies on a spring-loaded hammer similar to the one used in the rebound hammer test. However, the most recognised pen-etration test using a gun is the Windsor test, [6,12], which uses a powder-actuated tool to project pins into the concrete. The powder-actuated gun drives the steel-alloy probe (pin) into the hardened concrete, and the exposed length is then measured. In contrast to the rebound hammer test, the penetration test is not strongly affected by the surface conditions of the con-crete. Nonetheless, like the rebound hammer test, the
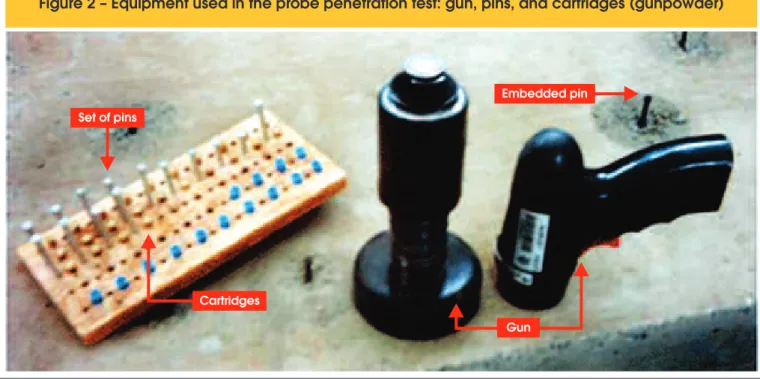
hard-Figure 2 – Equipment used in the probe penetration test: gun, pins, and cartridges (gunpowder)
Set of pins
Gun Cartridges
3.1
Determining the coeficient of variation
of the probe penetration test
3.1.1description of the experimental program
The tests that were used to determine the coeficient of variation of the probe penetration test were performed in shotcrete plates measuring 0.60×0.60×0.15 m (width x length x height) with a com -position identical to that used on-site. The dosage of the concrete used in the projection of the plates and in the tunnel is highlighted in Table 1. The plate mouldings were inclined at an angle of 60° (in the horizontal plane) and shaped during the projection of the con -crete in the tunnel. This measure aims not only to represent the conditions observed on site but also to prevent the incorporation of the material relected and the consequent formation of low strength concrete lenses.
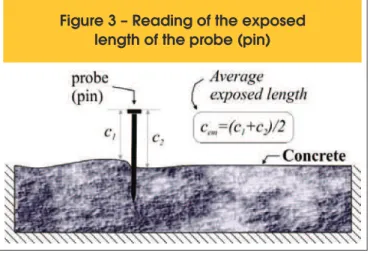
For the probe penetration test, it was initially considered to mea-sure the inclination angles and exposed lengths of the driven pins. Nonetheless, due to the lighting conditions of the tunnel and the high number of tests to be performed, the average length of the exposed probe was determined by averaging two measurements of the exposed length using a digital calliper, as shown in Figure 3. It should also be noted that the increased roughness of the tunnel inishing, and the surface inish of the concrete plates, are deter -mining factors for the adoption of the measurement method used in this study.
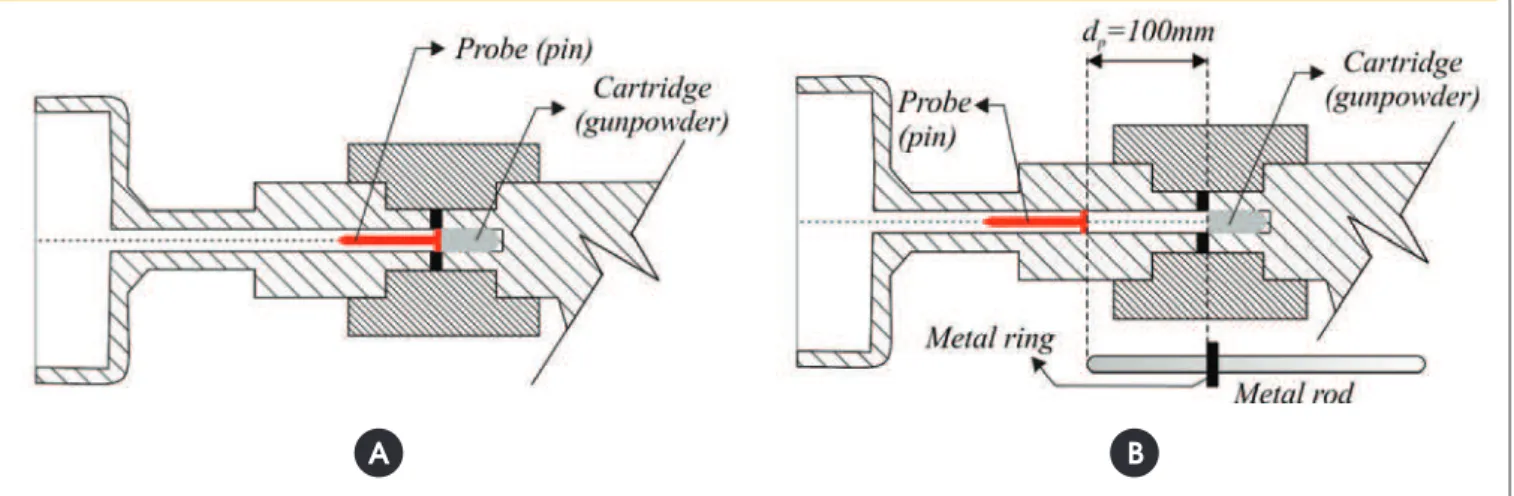
The probe penetration test was performed using controlled pro-pulsion energy (kinetic energy). Such control was required when observing the results of the early-age tests, which indicated that the use of maximum propulsion energy resulted in the complete penetration of the pin in most cases. This initial response is likely associated with the low level of strength of the shotcrete in the tunnel.
The reduction in the propulsion energy was obtained by increas -ing the distance between the capsule where the powder load is inserted and the pin, as illustrated in Figure 4a,b. The control of the distance, dp=100 mm, from the probe to the powder load was performed using a metal rod with a diameter similar to the probe head and a backstop deined by a metal ring welded to the rod (Figure 4b). This procedure was carried out throughout the experi -mental program with the objective of reducing errors and, at the same time, facilitating the test performance, as the operator need than that speciied in the project, i.e., f ck = 25.0 MPa.
To perform the probe penetration tests, the Walsywa gun - DFG 40S Model was used. Furthermore, 22.0 mm cartridges and 55.0×6.35 mm (length × diameter) pins were used. The equipment used in the test is illustrated in Figure 2. The Walsywa gun was adopted to replace the Windsor gun because the latter was dif-icult to obtain and relatively costly. The Walsywa gun was irst used in Brazil to predict concrete properties, such as compressive strength, in a study developed by Vieira, [13]. Currently, this meth -od has been widely employed to investigate possible non-confor-mities in reinforced concrete structures in studies such as those by Evangelista, [14], and Pinto & Baggio, [9].
According to the literature, the probe penetration test is charac -terised by a high variability, [1,2,14]. This variability results from factors associated with errors caused by both the operator and the equipment due to the heterogeneous character of concrete. Errors caused by the operator, who should be duly qualiied to perform the tests, can be considered minimal, and the variability originates mainly from the factors associated with the equipment, such as varying the powder charge in the cartridge. The presence of coarse aggregates in the concrete and the distribution of voids throughout the mass greatly affect the test results and are considered to be the main reason for the high variability of the test [2].
As a result of the above-mentioned factors, a greater number of tests is necessary to detect signiicant variations in the concrete strength when comparing, for example, the probe penetration test with the rebound hammer test. Nevertheless, several published re -sults, e.g., [15-17], indicate that the coeficient of variation of the probe penetration test would not be as high, which would reduce the total number of tests required to obtain reliable results when investigating the strength of the inished concrete structure. Because divergences exist, the coeficient of variation of the probe penetration test was determined with the equipment used in this study. Note that the determination of the coeficient of variation of this test was performed prior to the completion of the stages described earlier in this section.
It is important to mention that the results from the preliminary study, which were used to determine the coeficient of variation of the probe penetration test, are required to deine the number of tests that need to be performed in the following steps, namely, in stages 1 and 2. Thus, to facilitate the understanding of the experimental program, the results of the preliminary steps were presented along with a description.
Table 1 – Shotcrete mixture composition
used in the tunnel lining
Materials
Shotcrete composition
Cement CP IV 32 RS
400 Kg/m
3Natural sand
3720 Kg/m
Stone powder
120 Kg/m
3Coarse aggregate
4.75/12.5mm
980 Kg/m
3Accelerating admixture
40 l/m
3not worry about measuring the exact distance of the probe in the trigger pipe every time the test is performed.
A total of ten tests were performed on the same concrete plate at an age of 28 days. In each test, the powder contained in the cartridge used in the test was measured, and the coeficient of variation was determined. To reduce possible errors caused by the operator, all tests were performed by the same, properly qualiied individual. The results obtained are discussed in the following section.
3.1.1Results and discussion of results
The results of the embedded probe length and the cartridge pow-der are shown in Figure 5. These values were calculated as the difference between the average lengths of the pin, which, in this case, was 54.9 mm, and average measured exposed length, as depicted in Figure 3. Table 2 lists the values of the average em-bedded probe length and the average powder obtained based on the individual values highlighted in Figure 5.
Based on the results in Table 2, a total coeficient of variation of 8.1% was obtained. The low coeficient of variation is connect-ed, among other factors, to the small variation in the powder load contained in the cartridge. Furthermore, the fact that the tests have been carried out by the same operator and that the mixture of the shotcrete has been produced with a coarse aggregate with a maxi-mum dimension of 9.5 mm has also contributed to reducing the total variability of the test, [1,2]. Due to practical measures that are connected to the high number of tests to be performed and based on the low variability of gunpowder, it was decided not to measure the powder mass over the remaining experimental stages. The determination the total number of tests n to be performed for each concrete plate evaluated in stage 2 is based on the relative maximum error E described in equation (1).
(1)
,
22 2
) 1 (, 2
/
CV
E
t
n
=
a n-×
where CV is the coeficient of variation of the test in percent, E is the maximum relative error in percent, n is the total number of tests, and ta/2 corresponds to the constant distribution of the t-Stu -dent [18] test for a signiicance value of α/2. It should be noted that the value of α was deined as 5.0%. Furthermore, it is highlighted that the solution of equation (1) is obtained by an iterative process because the constant value ta/2 is a function of n.
The lower the maximum relative error admitted, the greater the number of tests that need to be performed. However, factors such as the cost of conducting the tests, the amount of time working inside the tunnel, and the equipment costs must be taken into ac -count to minimise the amount of testing that is performed and, consequently, the direct and indirect costs related to the execu -tion. Depending on these variables and in accordance with the technical team responsible for implementing the tunnel, a maxi-mum relative error of 10.0% was chosen.
By applying the values of the coeficient of variation of the probe penetration test, CV = 8.1%, outlined in Table 1 and the maximum relative error, E r = 10.0%, from equation (1), it was possible to obtain
Figure 4 – Propulsion energy (shooting): (a) maximum power and (b) reduced power
A
B
Figure 5 – Individual results of the penetrated
length of pins and the mass of
a value for the total number of tests n equal to six (n = 6). Note that the value resulting from equation (1) is equal to 5.1. Nevertheless, this igure was rounded to the next highest whole number. Hence, 12 tests were performed in each concrete plate (6 at 13 days old and 6 at 36 days old).
3.2
Stage 1: Determination of the correlation curve
of probe penetration test
The deinition of the correlation between the results of the probe penetration test and the concrete compressive strength was de-termined by tests performed on two concrete plates. The concrete plates measuring 0.60×0.60×0.15 m were moulded with shotcrete, whose composition corresponds to that used in the tunnel in ques -tion and agrees with the dosage that was used in stage 1. Prior to conducting the probe penetration test, four core sam -ples with 75.0 mm diameters were extracted from the concrete plates. Due to the variation in the thickness of the concrete plates resulting from the process of producing the same in the tunnel, the height of the core samples ranged from 93.0 mm to 159.8 mm. A total of 12 probe penetration tests were performed in each of the concrete plates. This number of tests is based on the results of the study to determine the coeficient of variation of the probe penetra-tion test described in secpenetra-tion 3 .1.
The compression strength tests were performed at different times; in this case, two core samples were tested at 13 days, and two at 36 days. This measurement was performed to cover a wider range of compressive strengths to deine the correlation curve. It is important to note that the quality and integrity of the core sam-ple must be evaluated before being tested. Samsam-ples that present moulding failures, known as concrete lenses in the case of shot-crete, should be discarded and the extraction of an additional core sample should be performed.
After conducting the tests proposed in this section, the correlation curve between the exposed probe penetration length and the com-pressive strength was determined by a linear regression using the
model described in equation (2). The prediction errors, Er,, for the
individual and mean values of the correlation curve were calculat-ed using equations (3) and (4), respectively. The signiicance value α, which is necessary to determine the conidence interval of the correlation curve, is equivalent to the value employed in the cal -culation of the concrete characteristic strength, i.e., α = 5.0% [19]. Among the various references, detailed descriptions of the linear regression process as well as the equations used for the determi-nation of the prediction error can be found in [18].
(2)
pE
x
b
a
y
=
+
×
±
(3)
(4)
,
)
(
1
)
(
/2(, 2) 2xx i e n i medio
p
x
t
S
n
x
s
x
E
-=
±
a -×
×
+
-where x and y correspond, respectively, to the dependent and in-dependent variables; a and b correspond, respectively, to the lin -ear coeficient and the slope; Ep–individual is the predicted error for the
individual values and Ep–medio is the predicted error for the mean values; Se corresponds to the standard error of the estimate and
is calculated using equation (5), n refers to the sample size, i.e., the number of points used to deine the correlation curve; x corre-sponds to the average value of the variable x; and Sxx is the sum of
the residues of the variable x given by equation (6).
(5)
,
2
))
(
(
2 1-×
+
-=
å
=n
x
b
a
y
S
i n i i e(6)
(
( .
1=
å
=x x
– –
S
xx ni iIn addition to the correlation curve, the results obtained in the tests carried out on the plates were used to verify the second coeficient of variation of the assay. To do so, the coeficient of variation of the results of each of the plates for different ages and the average coeficient of variation CV were calculated using equation (7).
(7)
,
m m
m
x
s
CV
=
Table 2 – Average penetrated length of
the probe and average gunpowder mass
Average penetrated length, [mm]
Probe penetration test
Gunpowder mass
39.10
Standard deviation, [mm]
3.20
Coefficient of variation, [%]
8.1
Number of tests
10
Average mass, [g]
0.324
Standard deviation, [g]
0.009
Coefficient of variation, [%]
2.7
where sm is the average standard deviation sj of each of the plates
for different ages, which is calculated by using equation (8); xm is
the mean of average values obtained in each of the plates for dif-ferent ages; and CVm corresponds to the coeficient of variation.
(8)
,
1
1 2
å
=×
=
Nj j
m
N
s
s
where N is the number of sample groups; N = 4.
3.3
Stage 2: The probe penetration test along
the shotcrete layer of the tunnel
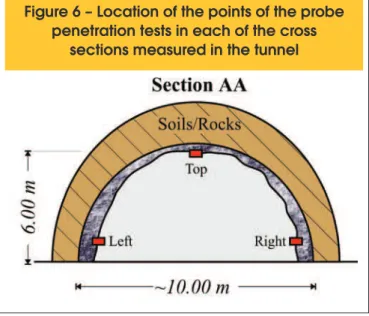
This stage aimed to evaluate whether the strength of the shotcrete layer along the tunnel would meet the value speciied in the proj -ect. Nevertheless, performing probe penetration tests along the entire surface of the lining layer would be impractical, mainly due to dificul -ties in reaching all of the regions corresponding to the tunnel’s vault. Therefore, three points for each pre-deined cross section were evaluated. The points where the tests were performed correspond to the sides and superior regions of the tunnel section, as depicted in Figure 6. The tests were carried out in the tunnel over a period of 40 to 50 days after the projection of the last 100.0 m of concrete lining. The tunnel sections were evaluated in different directions because of the possibility of variation in the concrete compaction as a function of the pro-jection angle and the distance. In ideal conditions, the concrete should be projected perpendicularly to the structure. Nonetheless, in stretches such as the roof of the tunnel, there are technical dificulties that can result in variation in the projected angle. However, for a single projected mixture, the experimental results indicate that such variation only affects the con-crete strength and not the relationship with the probe penetration test [20]. Thus, the use of a 60º angle in the projection of the concrete plates used to deine the test’s correlation curve, which is discussed in section 3.1.1, has no signiicant inluence on the correlation of the test.
In general, the sections were marked every 5.0 m or 10.0 m along the length of the tunnel. For each region, three tests were performed, resulting in a total of nine rounds per section. In total, 610 tests were conducted over the 450m length of the tunnel. More speciically, a total of 235 tests were conducted in each of the sides and 140 tests on the top. The reduced number of tests conducted on the top of the tunnel is due to dificulties encountered in reaching the top of the tunnel and performing the reading of the exposed length of the pin.
4. Results and discussion of results
4. 1
Stage 1: Determination of the correlation curve
of the probe penetration test
At this stage in the research, two shotcrete plates were tested. The
Figure 6 – Location of the points of the probe
penetration tests in each of the cross
sections measured in the tunnel
Table 3 – Probe penetration test results in the concrete plates
Plate 1
Plate 2
Age
13 days
36 days
13 days
36 days
Probe (pin)
C [mm]
em,C [mm]
em,C [mm]
em,C [mm]
em,1
34.21
35.05
18.23
19.30*
2
37.64
37.82
20.27
29.67
3
40.05*
33.89
21.82
24.32
4
37.37
36.91
16.59
25.29
5
33.59
32.93
22.65
26.35
6
36.14
35.76
28.68*
27.19
Average, [mm]
35.79
35.39
19.91
26.56
Standard deviation, [mm]
1.83
1.83
2.51
2.05
results from the probe penetration test are listed in Table 3. It is im-portant to mention that the results deemed spurious were removed from the sample to produce the correlation curve.
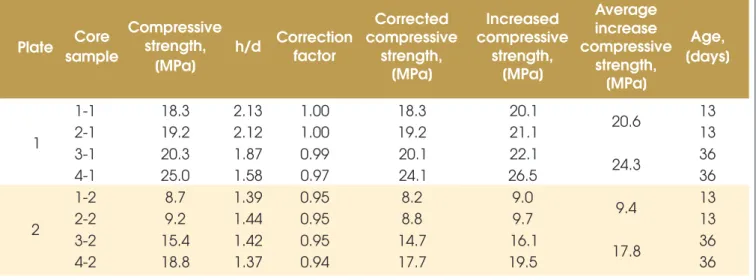
The evaluation of the average coeficient of variation of the test, as measured by the mean values and standard deviations listed in Table 3 as well as by equations (7) and (8), result in a coeficient of varia -tion CV equal to 7.1%. This value is consistent with the value obtained in the variability study of the test and is used to determine the number of tests to be performed at this stage, as stated in section 2.1.1. The test results of the compressive strength of the samples ex-tracted from the plates are highlighted in Table 4. It should be not-ed that the results of this test had to be correctnot-ed due to the varia-tion in the height of the core samples and the possible presence of micro-cracks caused by excessive vibration during the extraction of the core samples. Corrections were performed according to the recommendations presented in [21]. The values of the increased average strength, which are highlighted in Table 4, were used in the deinition of the correlation curve.
The correlation curve of the probe penetration test, along with a conidence interval of the individual and average values deined by equations (3) and (4), is depicted in Figure 7. The lower limit of the conidence interval outlined in Figure 7 is equivalent to the concrete characteristic strength curve when a signiicance level of 5.0% was adopted.
As presented in Figure 7, the correlation curve does not cover in-tervals over 25.0 MPa. Therefore, if the strength values observed in the concrete lining of the tunnel are above the results obtained in the samples, the correlation curve must be extrapolated. How -ever, because the plates have been moulded during the projection process, the existence of in situ values similar to those observed in the concrete plates is probable, which presents evidence that the concrete lining of the tunnel shows non-conforming results. The expression of the correlation curve of the probe penetration test is detailed in equation (9). The correlation coeficient R2
ob-tained in the deinition of the curve was 0.807. Considering the variability that is intrinsic of the probe penetration test in addition
to the variability associated with the characteristics of shotcrete, the correlation coeficient of 0.807 can be considered accept -able. It is important to note that although this value is acceptable, complementary studies are required to obtain a better correlation coeficient among the results. Such studies include, for instance, increasing the sampling universe, thus enabling a more profound statistical analyses.
Table 4 – Results of the compressive strength testing of samples extracted from the concrete plates
Plate
sample
Core
Compressive
strength,
[MPa]
h/d
Correction
factor
Corrected
compressive
strength,
[MPa]
Increased
compressive
strength,
[MPa]
Average
increase
compressive
strength,
[MPa]
Age,
[days]
1
1-1
18.3
2.13
1.00
18.3
20.1
20.6
13
2-1
19.2
2.12
1.00
19.2
21.1
13
3-1
20.3
1.87
0.99
20.1
22.1
24.3
36
4-1
25.0
1.58
0.97
24.1
26.5
36
2
1-2
8.7
1.39
0.95
8.2
9.0
9.4
13
2-2
9.2
1.44
0.95
8.8
9.7
13
3-2
15.4
1.42
0.95
14.7
16.1
17.8
36
4-2
18.8
1.37
0.94
17.7
19.5
36
(9)
.
fc
=4,221
e ,
0,0475.Cemwhere fc corresponds to the predicted compressive strength, in
[MPa], of the concrete for an average exposed length of cem,
in [mm].
After deining the correlation curve between the exposed length of the probe and the compressive strength of the concrete (9), it is possible to estimate the compressive strength at various points in the projected concrete layer along the tunnel, as discussed in the following section.
4.2 Stage 2: The probe penetration test along
the shotcrete layer of the tunnel
Based on the correlation curve and on the respective conidence interval illustrated in Figure 7, the exposed length of the probe should be at least 44.3 mm (individual values), such that the con-crete characteristic strength could be considered at 25.0 MPa, or 39.8 mm (mean values) to the extent that the average strength of the section has a characteristic value of 25.0 MPa.
The use of the different limits speciied above depends on the analysis performed. Both values were considered in the present study because the analysis of the results is sometimes related to the individual results of the probe penetration test performed in each of the regions of the tunnel sections (individual values) and, at other times, it is related to the average of the test results in each section of the tunnel, i.e., the mean values. Subsequent to the initial analysis of the limits of the exposed length of the probe speciied above, the characteristic strength value of the different sections of the tunnel were evaluated by statistical analysis, as described throughout this section.
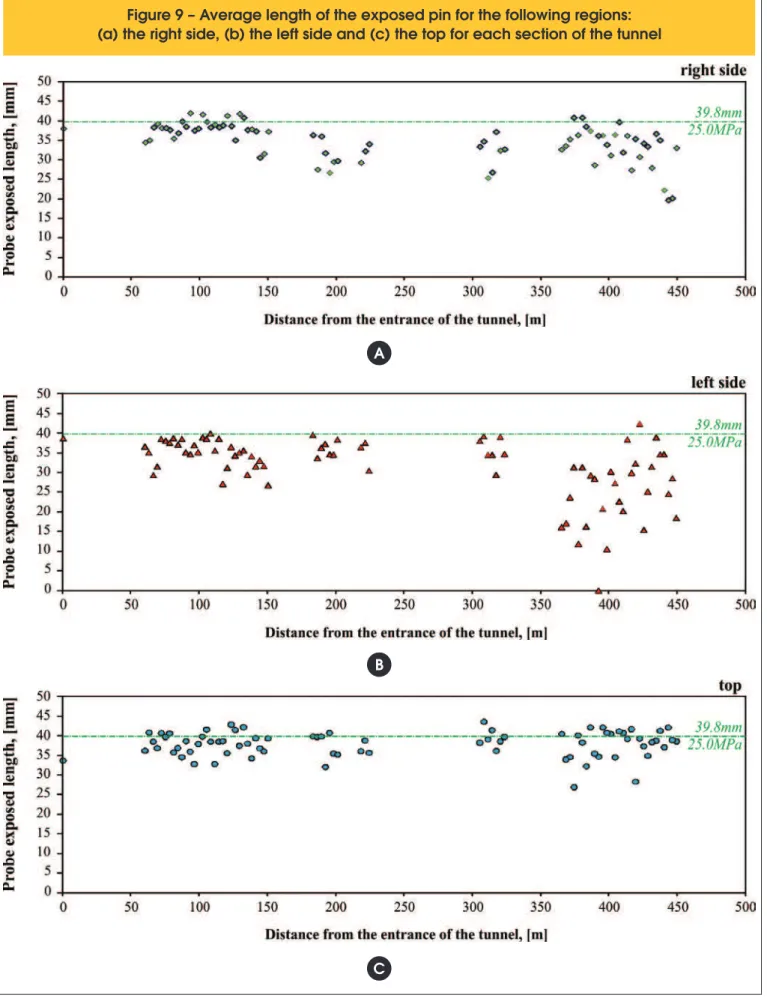
The individual results obtained from the probe penetration test on each of the evaluated sections are illustrated in Figure 8. The aver -age results for each region of the tunnel are illustrated in Figure 9. The probe penetration values obtained along the tunnel (Figure 8) were similar to the penetration values obtained on the projected plates. Therefore, this is an excellent condition for the comparison of the populations, rendering the extrapolation of the results dis-cussed in section 4.1 unnecessary.
Based on the results presented in Figure 8 and considering the limit of 44.3 mm speciied for the individual values, it can be stated that the compressive strength of shotcrete does not meet the de-sign speciications in any location of the tunnel.
The results of Figure 8 indicate that there is considerable variation of the exposed length of the pin and, consequently, of the cor-responding estimated compressive strength along the tunnel. The results are more dispersed in the left-side region of the tunnel, whereas the top has less dispersion. The high dispersion of the results is due not only to the nature of the material but also to the possible lack of homogeneity resulting from shotcrete, i.e., the lack of control of the projection technique and the amount of concrete. Considering Figure 9 and the limit of 39.8 mm speciied for the average values, it is possible to conclude yet again that the com-pressive strength of the shotcrete is not compliant. Hence, it is not possible to afirm that at 95% conidence the concrete
aver-age strength exceeds 25.0 MPa in all sections along the length of the tunnel.
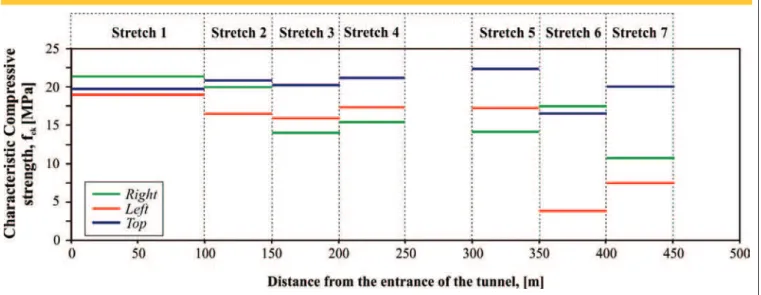
To provide more accurate information, which would thus enable an analysis of the future stability of the structure, the characteristic strength of the shotcrete was determined in different parts of the tunnel to allow for differentiated solutions to structurally reinforce each stretch. Therefore, the tunnel is divided into seven portions, as illustrated in Figure 10.
The individual results of the compressive strength at each site pro-vided by the probe penetration test and equation (9) were grouped, and the mean fcj and standard deviation sd of each group were cal -culated. With these data, the characteristic strength of the concrete fck was calculated through equation (10). A summary of all of the results of this analysis is presented in Table 5. The values of the concrete characteristic strength deined in each of the sections are depicted in Figure 10.
(10)
.
645
,
1
d cjck
f
s
f
=
-
×
From Table 5, it can be noted that the strength values are less than the characteristic value speciied in the project. The top and right-side sections presented, in most cases, the best results, whereas the left-side section displayed the worst results, primarily in the inal stretch of the tunnel.
Finally, it is possible to observe in Figure 10 that the compres-sive strength of the concrete generally decreases along the length of the tunnel. Such trend was expected once the shotcrete at the entrance of the tunnel is older than that projected onto the inal stretch of the tunnel.
5. Final considerations
In the present work, the probe penetration test was used as the basis of a methodology assessing the shotcrete compressive strength. In light of the observations made during the tests and the results presented here, the following conclusions were obtained. Regarding the tests, the low-cost solution proposed here shows promising results. In this case, the Windsor gun, commonly used in the probe penetration test, was replaced by a low-cost gun avail-able on the market that can be used to ix steel pins into concrete. Moreover, during the tests, the propulsion energy control proved to be an important factor to ensure that the test shows suficient sensi -tivity to detect different levels of strength. For practical reasons, only one level of energy was used to investigate the structure in ques -tion. Nonetheless, the assessment of the inluence of the propulsion energy in concrete with different levels of strength is recommended to optimise the test methodology proposed in this study.
(b) the left side and (c) the top for each section of the tunnel
A
B
Figure 9 – Average length of the exposed pin for the following regions:
(a) the right side, (b) the left side and (c) the top for each section of the tunnel
A
B
Table 5 – Characteristic compressive strength of the shotcrete lining in different stretches of the tunnel
Tunnel Stretch
Section: right
f ,
ck[MPa]
Section: left
f ,
ck
[MPa]
Section: top
f ,
ck
[MPa]
f ,
cj[MPa]
[MPa]
s ,
d[MPa]
f ,
cj[MPa]
s ,
d[MPa]
f ,
cj[MPa]
s ,
d1
0.0 – 100.0m
25.8
2.6
21.6
23.5
3.0
18.6
24.9
3.1
19.8
2
100.0 – 150.0m
25.9
3.6
20.0
22.0
3.6
16.1
26.3
3.4
20.6
3
150.0 – 200.0m
19.7
4.1
13.0
22.2
3.9
15.8
26.0
3.6
20.1
4
200.0 – 250.0m
18.7
2.0
15.4
23.2
3.7
17.2
23.8
1.9
20.8
5
300.0 – 350.0m
19.4
3.7
13.3
23.2
3.7
17.1
27.7
3.2
22.4
6
350.0 – 400.0m
23.4
3.7
17.3
11.8
4.9
3.7
24.7
5.1
16.3
7
400.0 – 450.0m
19.2
4.9
11.2
17.8
6.3
7.5
26.4
3.8
20.2
strength were determined in different parts of the tunnel, with the highest values observed in the irst 150.0 m of the tunnel, which is older than the inal stretch of the tunnel.
In the study of the probe penetration test variability, a coeficient of variation of ~8.0% was obtained. Nevertheless, the variability ob-served in loco appears to be relatively higher than this value. This fact is mainly due to, but not limited to, factors such as a discon-tinuity of the shotcrete thickness and the lack of homogeneity of the shotcrete due to the lack of control of the projection technique. Finally, it is possible to conclude that the proposed methodology is suitable for estimating the compressive strength of the shotcrete structures. However, when possible, a greater number of repeti -tions of the test should be performed to account for variability and thus achieve a better correlation of the results.
6 acknowledgements
The authors wish to express their appreciation to the Erasmus Mundus External Cooperation Window EMECW – EU-Brazil Startup for funding the irst author’s PhD studies at Czech Technical University in Prague.
7. References
[01] MALHOTRA, V.M., CARINO, N.J. Penetration Resistance Methods. In: Handbook of non-destructive testing of concrete. 2nd Ed. CRC Press (2004) 33-50. [02] NAWY, E.G., Concrete Construction Engineering
Handbook. Nondestructive test methods. 2ndEd. CRC Press (2008) 902-975.
[03] HOBBS, B., KEBIR, M.T. Non-destructive testing techniques for the forensic engineering investigation of reinforced concrete building. Forensic Science International 167 (2007) 167-172.
[04] ZHU, W., GIBBS, J.C., BARTOS, P.J.M. Uniformity of in-situ properties of self-compacting concrete in full-scale structural elements. Cement and Concrete Composites 23 (2001) 57-64.
[06] ACI COMMITTEE 228. In-place methods to estimate concrete strength, ACI 228.1R. American Concrete Institute (2003) Farmington Hills, MI,
[07] SOUTSOS, M.N., BUNGEY, J.H., LONG, A.E., HENDERSON, G.D. In-situ strength assessment of concrete – The European concrete frame building project. In: Non-destructive tests in civil engineering, Tokyo (2000) 583-592,
[08] IWAKI, K., HIRAMA, A., MITANI, K., KAISE, S., NAKAGAWA, K. A quality control method for shotcrete strength by pneumatic pin penetration test. NDT & E International – Independent Non-destructive testing and evaluation 34 (6) (2001) 395-402.
[09] PINTO, R.C.A., BAGGIO, D. Estudo da Variabilidade do Ensaio Brasileiro de Penetração de Pinos. 46º IBRACON - Congresso Brasileiro do Concreto, Florianópolis, (2004).
[10] ACI Committee 228. In-place methods to estimate concrete strength, ACI 228.1R. American Concrete Institute, Farmington Hills, MI, (2003).
[11] AL-MANASEER, A.A., NASSER, K.W. Laboratory and ield tests with a new non-destructive apparatus. Canadian Journal of Civil Engineering 17 (6) (1990) 904-910.
[12] AMERICAN SOCIETY FOR TESTING AND MATERIALS, ASTM C 803-82: Standard test method for penetration resistance of hardened concrete, 1982.
[13] VIEIRA, D.P. Método Brasileiro de Penetração de Pinos. XX Jornadas Sul Americanas de Engenharia Estrutural, Santiago, Chile (1978).
[14] EVANGELISTA, A.C.J. Avaliação da Resistência do Concreto Usando Diferentes Ensaios não Destrutivos. Tese de Doutorado, Universidade Federal do Rio de Janeiro, (2002).
[15] ARNI, H.T., Impact and penetration tests of
portland cement concrete. Highway Research Report 378 (55) (1972).
[16] CARETTE, G.G., MALHOTRA, V.M., In-Situ Tests: Variability and Strength Prediction of Concrete at Early Ages. Malhotra, V.M., Ed., American Concrete Institute, Spec. Publ. SP-82, 111p., (1984).
[17] KEILLER, A.P., A Preliminary Investigation of Test Methods for the Assessment of Strength of In-Situ Concrete. Tech. Rep. No. 551, Cement and Concrete Association, Wexham Springs, September, (1982). [18] MONTGOMERY, D.C. Applied Statistics and Probability
for Engineers, 4thEd. Willey, (2006) 784p.
[19] ASSOCIAÇÃO BRASILEIRA DE NORMAS TÉCNICAS, NBR 5739: Concreto - Ensaios de compressão de corpos-de-prova cilíndricos. Rio de Janeiro, (2007). [20] PRUDÊNCIO JR. L.R. Contribuição à dosagem de
concreto projetado. Tese de doutorado, Programa de Pós-graduação da Universidade de São Paulo – USP, Brasil, (1993).