of Sequence Data
Andre´ Yoshiaki Kashiwabara1, I´gor Bonadio2, Vitor Onuchic3, Felipe Amado4, Rafael Mathias2, Alan Mitchell Durham5*
1Graduate Program in Informatics, Federal University of Technology - Parana´, Corne´lio Proco´pio, Parana´, Brazil,2Computer Science Graduate Program, Universidade de Sa˜o Paulo, Sa˜o Paulo, Brazil,3Bioinformatics Graduate Program, Universidade de Sa˜o Paulo, Sa˜o Paulo, Brazil,4Computer Science Undergraduate Program, Universidade de Sa˜o Paulo, Sa˜o Paulo, Brazil,5Department of Computer Science, Instituto de Matema´tica e Estatı´stica, Universidade de Sa˜o Paulo, Sa˜o Paulo, Brazil
Abstract
Discrete Markovian models can be used to characterize patterns in sequences of values and have many applications in biological sequence analysis, including gene prediction, CpG island detection, alignment, and protein profiling. We present ToPS, a computational framework that can be used to implement different applications in bioinformatics analysis by combining eight kinds of models: (i) independent and identically distributed process; (ii) variable-length Markov chain; (iii) inhomogeneous Markov chain; (iv) hidden Markov model; (v) profile hidden Markov model; (vi) pair hidden Markov model; (vii) generalized hidden Markov model; and (viii) similarity based sequence weighting. The framework includes functionality for training, simulation and decoding of the models. Additionally, it provides two methods to help parameter setting: Akaike and Bayesian information criteria (AIC and BIC). The models can be used stand-alone, combined in Bayesian classifiers, or included in more complex, multi-model, probabilistic architectures using GHMMs. In particular the framework provides a novel, flexible, implementation of decoding in GHMMs that detects when the architecture can be traversed efficiently.
Citation:Kashiwabara AY, Bonadio I´, Onuchic V, Amado F, Mathias R, et al. (2013) ToPS: A Framework to Manipulate Probabilistic Models of Sequence Data. PLoS Comput Biol 9(10): e1003234. doi:10.1371/journal.pcbi.1003234
Editor:Hilmar Lapp, National Evolutionary Synthesis Center, United States of America
ReceivedSeptember 21, 2012;AcceptedAugust 5, 2013;PublishedOctober 3, 2013
Copyright:ß2013 Kashiwabara et al. This is an open-access article distributed under the terms of the Creative Commons Attribution License, which permits unrestricted use, distribution, and reproduction in any medium, provided the original author and source are credited.
Funding:This work was partially funded by Conselho Nacional de Pesquisa - CNPq (grant numbers 141069/2007,307573/2009-5,485566/2007-9,312075/2006-5), by Fundac¸a˜o de Amparo a` Pesquisa do Estado de Sa˜o Paulo - FAPESP (grant number 2010/04409-2), and by Coordenac¸a˜o de Aperfeic¸oamento de Pessoal De Nı´vel Superior - CAPES. These funding agencies had no role in study design, data collection and analysis, decision to publish, or preparation of the manuscript.
Competing Interests:The authors have declared that no competing interests exist.
* E-mail: aland@usp.br
This is aPLOS Computational BiologySoftware Article.
Introduction
Markov models of nucleic acids and proteins are widely used in bioinformatics. Examples of applications include ab initio gene prediction [1], CpG island detection [2], protein family charac-terization [3], and sequence alignment [4]. Many times these models are hard coded in the analysis software, which means well-known algorithms are implemented over and over again. A system providing a wide range of these models is important to allow researchers to quickly select the most appropriate model to analyze sequences of different problem domains. In some cases, such as gene prediction, the characterization of the family of sequences may involve using various probabilistic models integrated in a single architecture.
One approach to avoid rewriting code is to use a general-purpose system such as R [5], for which there are packages for using these models [6,7], but different packages require the use of different interfaces, which makes them harder to combine. Another alternative is a general-purpose system that can implement different models such as gHMM [8], HTK [9], HMMoC [10] and HMMConverter [11], N-SCAN [12] and Tigrscan [13] (also known as Genezilla).
HTK and gHMM have the distinctive capability of working with continuous emission distributions or, in other words, can accept sequences of arbitrary floating point numbers. HTK was designed to treat the speech recognition problem, but it can also be used to model biological sequences. However it implements only HMMs and does not provide simulations of the models. The gHMM package is a C library providing implementations for HMMs, pair-HMMs, inhomogeneous Markov chains and a mixture of PDFs. The system includes a graphical user interface and provides Python wrappers for each probabilistic model, but it does not implement GHMMs.
Finally, N-SCAN and Tigrscan are examples of systems which implement general, configurable GHMMs that can combine different probabilistic sub-models in states with a given duration probability distribution. However, they are targeted specifically for gene prediction, offering only a restricted set of probabilistic models in a fixed architecture designed for the gene-finding problem.
In this paper we present ToPS (Toolkit for Probabilistic models of Sequences), a framework for the implementation of discrete probabilistic models for sequence data. ToPS currently implements eight kinds of models: (i) independent and identi-cally distributed process (i.i.d); (ii) variable-length Markov chain [17]; (iii) inhomogeneous Markov chain [18]; (iv) hidden Markov model [19]; (v) profile hidden Markov model [20]; (vi) pair hidden Markov model [21]; (vii) generalized hidden Markov model (GHMM) [14]; (viii) similarity based sequence weighting (SBSW) [16]. To the best of our knowledge, ToPS is the first framework that at the same time implements this range of probabilistic models, is not restricted to any specific problem domain, and does not require from end-users any familiarity with programming languages or with the hierarchical structure of XML. Additionally, ToPS provides a novel implementation of the decoding algorithm that automatically detects GHMM architectures that can be parsed more efficiently, a characteristic that is essential for gene finders, since they have to be designed to parse long sequences. ToPS includes command-line programs for: training and simulating the models, evaluating input sequences using a specific model, performing Bayesian classifi-cation, and decoding sequences. As another novelty, ToPS includes two model selection criteria to help select the best parameters for a classification problem: Bayesian Information Criteria (BIC) [22], and Akaike Information Criteria (AIC) [23]. ToPS uses easy-to-read configuration files that describe prob-abilistic models in a notation close to the mathematical definitions. Finally, ToPS has an object-oriented architecture designed to facilitate extension and inclusion of new probabi-listic models. Table 1 shows a comparison of the features of these general-purpose systems.
In this paper we describe the basic characteristics of ToPS and two examples of how to use it in practical problems: (i) a CpG island detector; (ii) a simple eukaryotic gene predictor.
The ToPS framework has been in intensive use by our research group in a wide variety of problems, including experimentation with null models [24], annotation of full transcripts, small RNA characterization and building gene predictors.
Design and Implementation
Architecture
ToPS was developed with an object-oriented architecture, which is important for the integration of the models in a single framework. The ToPS architecture includes three main class hierarchies:ProbabilisticModel, to represent model implementations; ProbabilisticModelCreator, to specify the on-the fly creation of models based on configuration files; andProbabilisticModelParameterValue, to enable the parsing of the configuration files. These three hierarchies are used by a set of application programs that implement the framework’s user functionalities (bayes_classifier, evaluate, posterior_decoding, simulate, train, viterbi_decoding). Implement-ing new models as a subclass of ProbabilisticModel will ensure integration with the facilities for training, simulating, decoding, integration in GHMMs and construction of Bayesian classifiers. A more detailed description of the architecture can be found in the ToPS user guide (http://tops.sourceforge.net/tops-doc.pdf).
Model selection criteria
Many training algorithms contain parameters that can control the dimensionality of the trained model. A typical example is a Markov chain model in which the user has to choose the value of the order parameter. Another example is the Variable Length Markov Chain in which the user has to set a parameter that controls the pruning of the probabilistic suffix tree. Finding the best parameters can be a long and tedious task if it is performed by manually testing possible parameters. To aid the user with finding a good set of parameters, ToPS contains two model selection criteria that the user can specify with the training procedure:
N
Bayesian Information Criteria (BIC) [22], that selects the parameters for which the corresponding model has the smallest value for the formula:log(maximum likelihood)
{1
2(number of independently adjusted parameters)
|log(sample size)
N
Akaike Information Criteria (AIC) [23], that selects the parameters for which the corresponding model has the smallest value for the formula:({2)log(maximum likelihood)
z2(number of independently adjusted parameters)
To the best of our knowledge, ToPS is currently the only framework for implementing Markovian models that provides this feature.
Efficient decoding of GHMMs
GHMMs are very flexible probabilistic models that can be integrated with other models to describe a complex architecture. A wide majority of successful gene predictors use GHMMs as a base to recognize particular gene structures [13–16,25–27]. However, for an unrestricted GHMM architecture that contains DQDstates and a sequence with lengthL, the complexity of the decoding algorithm is O(DQD2|L3) [15,28]. This is too inefficient when we are decoding large genomic sequences in systems with many states, which is typical with gene prediction. To circumvent this problem, gene predictors impose restrictions on the GHMM’s architecture in order to provide a more efficient implementation. Decoding algorithms used in gene predictors require that GHMMs satisfy three important properties (adapted from [29]):
N
Limited connectivity: The number of transitions from a given state is less than a constantC. This property limits the number of previous states searched by the Viterbi algorithm, resulting in an algorithm that is inO(DQD|C|L3).N
Limited duration: The states have duration distributions limited by a constantM. This property restricts the number of emission lengths that need to be analyzed by the Viterbi algorithm and, combined with the first restriction, results in an algorithm that is inO(DQD|C|L2|M).time after a linear time preprocessing of the sequence, resulting, when combined with the two previous optimizations, in a decoding algorithm that is in O(DQD|C|L|1| MzL)(O(DQD|L).
To implement an efficient decoding algorithm, many gene-finding systems use fixed GHMM architectures hard-coded in the program and embed restrictions of the model in order to allow efficient processing. This enables efficient decoding, but limits the architectures that can be described using GHMMs and, therefore, potentially limits their applicability.
ToPS was designed for general applicability, accepting any arbitrary GHMM configurations. To do so, we introduced a methodology to automatically use efficient decoding when the architecture allows it. This is achieved by the use of an adjacency graph to represent the transitions with probability greater than zero, and by taking advantage of the object-oriented architecture of the system:
N
ToPS uses a sparse graph implementation to benefit from the limited connectivity.N
The automatic detection of the constantMis achieved by the use of the classes representing i.i.d models which contain a list of possible durations.N
The constant time lookup of the emission probabilities is achieved by the use of the object-oriented architecture: any probabilistic model implemented as a subclass of FactorableMo-del orInhomogeneousFactorable represents models for which the likelihood of a sequence is factored as a product of terms, one term per sequence position. This property allows the implementation of a technique, called Prefix Sum Array [13] (PSA), that calculates the likelihood of a subsequence in constant time, after a linear time preprocessing of the sequence.In addition, we have developed another optimization technique for the case when some observation sub-model has probability zero to emit specific words, a situation that is very common in gene-finding systems. In this case ToPS maintains an auxiliary linked list for each line of the Viterbi matrix (corresponding to the values of a given state for each position of the sequence), indicating the positions that have non-zero probability. When we have Table 1.Comparison of ToPS with other Markov model toolkits.
Program Input Format Probabilistic Models Simulation
Distinguishing Characteristics
HMMConverter XML HMM NO memory efficient Viterbi,
forward, backward
pair-HMM
generalized HMM*
HMMoC XML HMM YES memory efficient Viterbi,
forward, backward
C language pair-HMM, triple-HMM, quad-HMM
generalized HMM*
gHMM XML HMM YES continuous emission
inhomogeneous Markov chain graphical user interface
pair-HMM
mixture of probability density functions
HTK XML HMM NO continuous emission
Tigrscan own language GHMM+ NO Does not provide
Baum-Welsh training
N-SCAN XML GHMM+ NO Does not provide
Baum-Welsh training
ToPS own language HMM YES model selection criteria
(AIC and BIC)
pair-HMM build profile-HMM from
alignment
GHMM efficient and general
GHMMs
variable-length Markov chain
inhomogeneous Markov chains
discrete i.i.d models
SBSW
*The generalized version of HMMs in HMMoC and HMMConverter is different from the GHMMs as defined by Kulp [14].
Specifically, they only allow the emission of whole words within a state, and neither allows sub models or the characterization of duration with a non-geometric distribution;
+Tigrscan and N-SCAN implement GHMMs containing as sub-models weight arrays, maximum dependence decomposition, smoothed histograms, three-periodic
Markov chains, and interpolated Markov models.
factorable models, the entries of the Viterbi matrix that generate a path with probability zero do not need to be examined. Typically, most positions have zero probability, therefore using the lists substantially reduce the running time.
These techniques achieve similar performance to the ad-hoc optimizations that reduce the generality of the GHMMs that can be analyzed.
Results
ToPS is a framework that helps describing and using discrete probabilistic models. Figure 1 illustrates the various ways to use ToPS: (i) train models given an initial specification and a set of training sequences, (ii) evaluate input sequences given a model, (iii) simulate a model, (iv) decode a sequence given a decodable model and (v) create a Bayesian classifier for sequences based on a set of pre-defined models. In this section we present two applications developed using the framework, in order to illustrate its applicability. We have chosen two well known problems in genomics: CpG island characterization and gene prediction. In both experiments we were able to improve the performance on solving the problem when comparing the ToPS implementation against published, well known alternatives.
All models, scripts, configuration files and sequence data to reproduce the experiments are available through the ToPS homepage.
Characterizing CpG Islands with a GHMM
CpG islands (CGI) are genomic regions of great interest due to their relation with gene regulation. These regions are commonly present in the promoter region of genes. The CGI sequences typically have high G+C content with a significant high frequency of Cs followed by Gs. CGIs are also related to the DNA methylation that occurs typically at the C nucleotides. The presence of methylated DNA regions can inhibit the binding of transcription factors and therefore inhibit gene expression. Large scale experiments to detect differentially methylated regions use a CGI list as a reference, stating the importance of producing high quality CGI lists [2].
The use of Hidden Markov Model to define CGIs was described in [21] and a more accurate model in [2]. However, hidden Markov models assume that the length of each region is geometrically distributed and the observed symbols are condition-ally independently distributed. With a generalized hidden Markov model we can use different models to represent CGI and non-CGI regions, and also characterize the length of CGI regions either geometrically with a self transition, or with a distribution based on known data. In this section we show how we can use these ideas in ToPS to implement CGI characterization.
Our GHMM has only two states, shown in Figure 2: CPG and NONCPG. We modeled NONCPG and CPG as states with a geometric run-length distribution represented by a self transition. To characterize both CPG and NONCPG we used Interpolated
Figure 1. A diagram of examples of ToPS usage.Square boxes represent data files, rounded boxes represent programs or manual processes.
Each model may be described manually by editing a text file (1), or the train program can be used to estimate the parameters and automatically generate such file from a training set (2). The files that contain the model parameters (in our example model1.txt, model2.txt and model3.txt) are used by the programs evaluate (3), simulate (4), bayes_classifier(5) and viterbi_decoding (6). The evaluate program calculates the likelihood of a set of input sequences given a model, the simulate program samples new sequences, the viterbi_decoding program decodes input sequences using the Viterbi algorithm, and the bayes_classifier classifies input sequences given a set of probabilistic models.
Markov Models (IMMs) [18]. IMMs have the ability of representing dependencies of arbitrary length, and we hypothesize that this model can improve CPG detection.
Building and training the models. To implement this system in ToPS we initially trained the two IMMs that constitute the states of the GHMM. We stored the description of these two models in the filescpg_imm.txtandnot_cpg_imm.txt.
Once we had all the trained models, we specified a GHMM with the configuration file described in the Figure 2. We assumed a mean length of 800nt to compute the geometric duration of the CPG state. This parameter was estimated from the training data. We evaluated a set of different values of NONCPG exit probability to produce the sensitivity analysis, shown in Figure 3.
In a different experiment we evaluated another GHMM with a non-geometric duration for the CPG state (data not shown). Because the Viterbi decoding must verify the best length for the CPG state, the decoding was significantly slower than with the geometric duration GHMM (12 hours vs. 1 minute). Further-more, we did not observe an improvement in the quality of the prediction when modeling the duration of the CPG state explicitly.
Evaluating the results. To characterize CpG islands and their lengths we used1000randomly chosen sequences from the CGI list of the UCSC Genome Browser [30]. The validation set was composed of 44 unmasked sequences corresponding to the ENCODE pilot project regions of the hg18 assembly [31].
We compared our results with two independent CGI lists: (i) the CGI list computed by an HMM developed by Wu and colleagues [2], that is stored as ‘‘Custom Annotation Tracks’’ in the UCSC Genome Browser; (ii) The official CGI list provided by the UCSC Genome Browser [30]. We used the comparison criteria proposed by Glass and collaborators [32], where the success of CGI prediction is measured by the rate of TSS regions covered by the CGI predictions. The TSSs were downloaded from the confirmed set of the DBTSS database [33].
As can be seen from Table 2, the GHMM results were better than those of the HMM: the ToPS GHMM (withp~2:0|10
{3)
predicts 12%fewer nucleotides than the HMM CGI regions of Wu and collaborators (600,122ntvs.685,514nt), but both covered
208confirmed TSSs (63:41%sensitivity). In a comparison against
the UCSC annotation results, the GHMM (withp~2:0|10
{7)
covered the same number of TSSs (192), using fewer regions (472vs:507). However, the GHMM predicted more nucleotides
than the CGI list (471,816nt vs. 397,229nt), indicating that the GHMM predicted, on average, larger regions than UCSC CGI list.
The results obtained with different values of p were used to generate a sensitivity analysis, as suggested by Wu and collabo-rators [2], shown in Figure 3. In particular, we tested the value p~1:0|10
{5 for the exit probability of the NONCPG state,
which embodies the hypothesis of a CpG region for each
100,000nt, or approximately30,000 CpG regions in the human genome. This GHMM predicted513,913ntas CGI and covered
200TSSs (60:97%sensitivity).
Building a protein-coding gene finder using GHMM Predicting the location and the structure of protein-coding genes in eukaryotic genomes is a difficult but very important task [1]. To build a competitive gene finding system one is required to know a large number of non-intuitive details such as the order of each Markov model, the length of the models representing biological signals, the training set for estimating each sub-model, and the architecture of the GHMM. The majority of successful gene-finding systems uses GHMMs [13–16,27], but important details are sometimes hard-coded in the the program, making it difficult to customize the GHMMs.
Next we illustrate the implementation in TopS of a gene-finding system using a GHMM with 56 states.
Building and training the models. The GHMM we built is shown in Figure 4. This GHMM architecture was adapted from similar GHMMs used by different gene finders and contains56
states which model genes from both DNA strands. The main differences when compared to GENSCAN [15] are the lack of states for poly-A signal and promoters in our model, and the fact that we use only one GHMM model, whereas GENSCAN uses different GHMMs for each G+C composition intervals of the target sequence.
To define a GHMM, we have to specify an emission sub-model for each state. Below is a list of the forward strand models we used:
Figure 2. The implemented GHMM for the CpG island detector.In this GHMM we used IMMs as emission sub-models and we tested different
values for the exit probability of the NONCPG state,p, to generate the sensitivity analysis. The mean length of the CPG state emission was estimated using the training data.
N
start codon initial motif:A Weight Array Model (WAM) -implemented as an inhomogeneous Markov chain - that emits a pattern of length20ntrepresenting the sequences that appear before the start codon (ATG). We used a WAM with order estimated using BIC.N
start codon model:A manually edited WAM that emits the sequence ‘‘ATG’’ with probability1.N
initial pattern model: A WAM that emits a pattern of length 4 representing sequences that appear after the start codon. We used a WAM of order3.N
stop codon model:A WAM that emits the sequences TAA, TAG, or TGA with the same frequency distribution that appears in the training set.N
acceptor splice site model:A WAM that emits a pattern of length 6nt (3nt before the canonical AG, followed by the dinucleotide AG, followed by1ntafter the AG).N
branch point model:Windowed WAM [15] (with order3 and vicinity length of3nt) that emits a pattern of length32nt for sequences that appear before the acceptor splice site.N
acceptor initial pattern model: A WAM that emits a pattern of length4corresponding to the sequences that appear after the acceptor splice site.N
donor splice site model: A similarity based sequence weighting [16] representing patterns of length9(a pattern of length3nt, followed by the dinucleotide GT, followed by a pattern of length4nt).Figure 3. Sensitivity associated with the combined length of the predicted CGIs.In this experiment the points in the curve correspond to
different values for the exit probability of the NONCPG state of the GHMM. For comparison, the results with the CGI list from UCSC Genome Browser and with the CGI list obtained using HMM [2] are shown as a blue square and green triangle, respectively.
Table 2.Comparison between CGI lists.
CGI List Total number of CGI regions
Percentage of confirmed TSSs contained in the CGI predictions (‘‘sensitivity’’)
Total of nucleotides in CGI list (‘‘specificity’’)
UCSC Genome Browser 507 58:53%(192) 397229
GHMMp~2:0|10
{7 472 58
:53%(192) 471816
HMM [2] 1124 63:41%(208) 685514
GHMMp~2:0|10
{3 784 63
:41%(208) 600122
This table shows a comparison between four distinct CGI lists: the UCSC Genome Browser list, the list produced by the HMM designed by Wu and collaborators [2], and the lists produced by our GHMM approach using two distinct exit probabilities for the NONCPG state. The probabilities of the GHMM selected were those that produced lists with the same sensitivity as the ones from the UCSC Genome Browser (p~2:0|10
{7), and from the HMM by Wu and collaborators (p~2 :0|10
{3). doi:10.1371/journal.pcbi.1003234.t002
Figure 4. GHMM architecture for eukaryotic protein-coding gene prediction.EIkis a state for representing an initial exon that ends at
phasek.Ekjis a state for representing an internal exon that begins at phasekand ends at phasej.ETkis a state for representing a terminal exon that begins at phasek. Ikis a state for representing an intron at phasek.Nis a state for representing intergenic regions.startis a state for representing the start codon signal.stopis a state for representing the stop codon signal.acckis a state for representing acceptor splice site signal at phasek.donkis a state for representing the donor splice site signal at phasek. To model the reverse strand, we used the states that begin with the prefix ‘r-’. Squares with a self-transition represent states with geometric duration distribution. Squares without a self-transition represent states with a
N
donor initial pattern model: A WAM of order 3 that emits a pattern of length 4nt that appears before the donor splice site model emissions.N
protein-coding model: A three-periodic Interpolated Markov Model, with order estimated using BIC, trained with the annotated protein-coding sequences from the training set.N
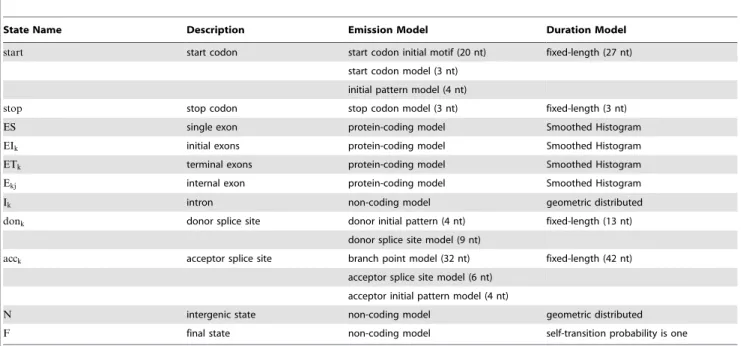
non-coding model: An Interpolated Markov Model, with order automatically estimated using BIC, trained with the annotated3’UTRand5’UTRsequences.A summarized description of each state can be found in Table 3. The states representing the reverse strand were trained with sequences corresponding to the reverse complement of those used to train the states representing the forward strand.
The run-length distribution of the states representing exons was trained using the same methodology described in [34] where smoothed histograms were estimated using a variation of the kernel density estimation algorithm. Because the coding segments must produce consistent gene structures, the run-length of the exon states must not allow emissions that are incompatible with their input phase and output phase. The average length of the intron sequences was estimated using the training set. Finally, the mean length of the intergenic region was estimated as10,000nt.
Evaluating the results. To compare our results with a well established program, we applied GENSCAN [15] using the original ‘‘HumanIso.smat’’ parameters. As a validation set we used
2500 randomly selected Refseq genes from the hg18 genome obtained from the UCSC Genome Browser. We used a 5-fold cross validation experiment with our system using the ‘‘viterbi_-decoding’’ program to decode the test sequences from each individual cross-validation run. We also applied GENSCAN to each of the five validation sets. We then used Eval [35] to calculate a set of comparative statistics, including the traditional accuracy measures for gene-finding systems. The results, shown in Table 4,
indicate that ToPS achieved better performance (considering the F-score as criteria) in two measures: nucleotides (77:3vs69:9) and
complete gene structure (15:4vs12:9). In this particular example
the GHMM’s performance could be probably be improved by including better models for representing short introns, and by implementing strategies to treat the C+G content variability of the genomes.
Conclusion
We presented ToPS, an open-source object-oriented framework for analyzing probabilistic models of sequence data. It implements seven well-established probabilistic models that have applications in many distinct disciplines. ToPS includes programs for simulating, decoding, classifying and evaluating discrete sequenc-es. The implemented models can be used individually, combined in heterogeneous models using GHMMs, or integrated in Bayesian classifiers. In contrast to systems with similar goals, end users do not need any previous knowledge of programming languages, since the probabilistic models are specified using a notation close to the mathematical one. There are specific auxiliary programs for training, simulating and decoding. In addition, ToPS includes two algorithms for model selection, BIC and AIC, that can be used to find the best classification parameters for given training and validation sets. Also, in contrast to other systems, ToPS includes a GHMM implementation that is at the same time general enough to describe any GHMM architecture and efficient when the model characteristics allow for a faster version of the Viterbi algorithm. This is important to enable the use of ToPS in gene finding.
The two examples presented above, a CpG island classifier and a gene predictor, illustrate that ToPS can be used to build complex model architectures to be applied to real-world problems. In both cases we achieve competitive performance against well established results with minimal implementation work. Both results could even be improved further through experimentation with the model.
Table 3.States of the GHMM for the gene prediction problem.
State Name Description Emission Model Duration Model
start start codon start codon initial motif (20 nt) fixed-length (27 nt)
start codon model (3 nt)
initial pattern model (4 nt)
stop stop codon stop codon model (3 nt) fixed-length (3 nt)
ES single exon protein-coding model Smoothed Histogram
EIk initial exons protein-coding model Smoothed Histogram
ETk terminal exons protein-coding model Smoothed Histogram
Ekj internal exon protein-coding model Smoothed Histogram
Ik intron non-coding model geometric distributed
donk donor splice site donor initial pattern (4 nt) fixed-length (13 nt)
donor splice site model (9 nt)
acck acceptor splice site branch point model (32 nt) fixed-length (42 nt)
acceptor splice site model (6 nt)
acceptor initial pattern model (4 nt)
N intergenic state non-coding model geometric distributed
F final state non-coding model self-transition probability is one
This table shows a summary of the configuration we used in each state of the GHMM for the gene-prediction problem. The statesstart,acceptor, anddonorare composed of two or more individual sub-models. The reverse strand states are symmetric and were omitted from this table.
Availability and Future Directions
ToPS was tested under GNU/Linux, and MacOSX and can be obtained from http://tops.sourceforge.net/. ToPS is distributed with a manual containing a set of examples to illustrate its use. The datasets and configuration files for the two experiments can be obtained from http://dx.doi.org/10.6084/m9.figshare.765452. Supporting information includes the source code, the manual, and a tutorial of the system (Software S1).
We are currently using ToPS to develop different probabilistic models for biological sequence analysis. In particular ToPS was useful to produce results described in [24], where we studied the problem of choosing different null-models that can reduce the number of false positives in Bayesian sequence classification. We are now developing other models for characterizing protein-coding sequences both in genomic sequences and in mRNAs, non-coding RNA characteriza-tion, and sequence aligners. In the near future, ToPS will be extended to include Maximum Dependence Decomposition models [15], Covariance Models [21] and Conditional Random Fields [36].
Supporting Information
Software S1 Source code for ToPS. A compressed file containing the source code for ToPS.
(GZ)
Acknowledgments
The authors are indebted to Elias de Moraes Fernandes for the design of the ToPS logo.
Author Contributions
Conceived and designed the experiments: AYK AMD. Performed the experiments: AYK. Analyzed the data: AYK AMD. Wrote the paper: AYK AMD. Designed and implemented the PairHMM model and related algorithms: VO. Designed and implemented ProfileHMM and related algorithms: FA RM. Implemented the specificaion parser with error reporting and some algorithms of the GHMM probabilistic model: IB.
References
1. Zhang MQ (2002) Computational prediction of eukaryotic protein-coding genes. Nat Rev Genet 3: 698–698.
2. Wu HAO, Caffo B, Jaffee HA, Irizarry RA (2010) Redefining CpG islands using hidden Markov models. Biostat 1: 499–514.
3. Punta M, Coggill PC, Eberhardt RY, Mistry J, Tate J, et al. (2012) The Pfam protein families database. Nucleic acids research 40: D290–301.
4. Knudsen B, Miyamoto MM (2003) Sequence Alignments and Pair Hidden Markov Models Using Evolutionary History. Journal of Molecular Biology 333: 453–460.
5. R Development Core Team (2009) R: A Language and Environment for Statistical Computing. Vienna, Austria: R Foundation for Statistical Computing. 6. Machler M, Buhlmann P (2004) Variable length Markov chains: Methodology, Computing, and Software. Journal of Computational & Graphical Statistics 13: 435–455.
7. Harte D (2008) Reference manual package: HiddenMarkov. Wellington, New Zealand: Statistics Research Associates Limited.
8. Schliep A, Georgi B, Costa IG, Scho¨nhuth A (2004) The General Hidden Markov Model Library: Analyzing Systems with Unobservable States. Proceedings of the Heinz-Billing-Price 2004: 121–135.
9. Young S, Evermann G, Gales M, Hain T, Kershaw D, et al. (2006) The HTK Book (for HTK Version 3.4). Cambridge: Cambridge University Engineering Department. 359 p.
10. Lunter G (2007) HMMoC – a compiler for hidden Markov models. Bioinformatics 23: 2485–2487.
11. Lam TY, Meyer IM (2009) HMMCONVERTER 1.0: a toolbox for hidden Markov models. Nucleic acids research 37: e139.
12. Korf I, Flicek P, Duan D, Brent M (2001) Integrating genomic homology into gene structure prediction. Bioinformatics 17: S140–S148.
13. Majoros WH, Pertea M, Salzberg S (2004) TigrScan and GlimmerHMM: two open source ab initio eukaryotic gene-finders. Bioinformatics 20: 2878– 2879.
14. Kulp D, Haussler D, Reese MG, Eeckman FH (1996) A generalized hidden Markov model for the recognition of human genes in DNA. Proc Int Conf Intell Syst Mol Biol 4: 134–142.
15. Burge C (1997) Identification of genes in human genomic DNA. [PhD Dissertation] Stanford University.
16. Stanke M, Waack S (2003) Gene prediction with a hidden Markov model and a new intron submodel. Bioinformatics 19 Suppl 2: II215–II225.
17. Rissanen J (1983) A universal data compression system. Information Theory, IEEE Transactions on 29: 656–664.
18. Salzberg S, Delcher AL, Kasif S, White O (1998) Microbial gene identification using Interpolated Markov Models. Nucleic Acids Research 26: 544–548.
19. Rabiner LR (1989) A tutorial on Hidden Markov Models and selected applications in speech recoginition. Proccedings of the IEEE 77: 257–286. 20. Eddy SR (1998) Profile hidden Markov models. Bioinformatics 14: 755–763. 21. Durbin R, Eddy SR, Krogh A, Mitchison G (1998) Biological sequence analysis:
Probabilistic models of proteins and nucleic acids. CambridgeUK: Cambridge University Press. 356 p.
22. Schwarz G (1978) Estimating the dimension of a model. The Annals of Statistics 6: 461–464.
23. Akaike H (1974) A new look at the statistical model identification. IEEE transactions on automatic control AC-19: 716–723.
24. Machado-Lima A, Kashiwabara A, Durham A (2010) Decreasing the number of false positives in sequence classification. BMC genomics 11: S10.
25. Reese MG, Eeckman FH (1997) Improved splice site detection in Genie. J Comp Biol 4: 311–323.
26. Cawley SE, Wirth AI, Speed TP (2001) Phat–a gene finding program for plasmodium falciparum. Mol Biochem Parasitol 118: 167–174.
27. Lomsadze A, Ter-Hovhannisyan V, Chernoff YO, Borodovsky M (2005) Gene identification in novel eukaryotic genomes by self-training algorithm. Nucleic Acids Res 33: 6494–6506.
28. Gue´don Y (2003) Estimating hidden semi-Markov chains from discrete sequences. Journal of Computational and Graphical Statistics 12: 604–639. 29. Majoros W, Status I, Availability L (2007) Methods for Computational Gene
Prediction. Cambridge: Cambridge University Press. 430 p.
30. Kent WJ (2002) Blat–the blast-like alignment tool. Genome Research 12: 656– 64.
31. ENCODE Project Consortium (2004) The ENCODE (ENCyclopedia Of DNA Elements) Project. Science 306: 636–640.
32. Glass JL, Thompson RF, Khulan B, Figueroa ME, Olivier EN, et al. (2007) CG dinucleotide clustering is a species-specific property of the genome. Nucleic acids research 35: 6798–807.
33. Yamashita R, Wakaguri H, Sugano S, Suzuki Y, Nakai K (2010) DBTSS provides a tissue specific dynamic view of Transcription Start Sites. Nucleic acids research 38: D98–104.
Table 4.Accuracy of the gene predictions.
Gene Exon Nucleotide
Predictor PPV Sn F-score PPV Sn F-score PPV Sn F-score
GENSCAN 9.761.1 19.660.7 12.961.1 54.362.2 74.4±1.0 62.8±1.4 55.064.7 96.3±1.2 69.963.7
ToPS 12.0±1.5 21.6±2.2 15.4±1.8 59.0±1.8 55.961.7 57.461.6 69.6±5.2 87.162.4 77.3±3.1
This table shows the accuracy of ToPS to the 5-fold cross-validation experiment. GENSCAN was tested using the ‘‘HumanIso.smat’’ parameters and the same test set used in each individual validation run. PPV: positive predictive value; Sn: sensitivity.
34. Stanke M (2003) Gene prediction with a hidden Markov model. [PhD Dissertation] Universita¨t Go¨ttingen.
35. Keibler E, Brent MR (2003) Eval: a software package for analysis of genome annotations. BMC Bioinformatics 4: 50.