Revista Brasileira de Estudos Regionais e Urbanos (RBERU)
Vol. 08, n. 2, pp. 92-108, 2014 http://www.revistaaber.org.br
HOW MUCH REGIONALLY DIFFERENTIATED IS THE PRIVATE EXPENDITURE IN EDUCATION IN BRAZIL? EVIDENCES FOR THE CASE OF METROPOLITAN
REGIONS
Tatiane Almeida de Menezes
Doutora em Economia pela Universidade de São Paulo (USP) Professora na Universidade Federal de Pernambuco (UFPE)
E-mail: tatianedemenezes@gmail.com Raul Silveira Neto
Doutor em Economia pela Universidade de São Paulo (USP) Professor na Universidade Federal de Pernambuco (UFPE)
E-mail: rau.silveira@uol.com.br
RESUMO: Tendo em vista a importância das disparidades regionais de níveis de escolaridade para o entendimento das desigualdades regionais de renda no Brasil, o trabalho utiliza dados da Pesquisa de Orçamento Familiar (POF) dos anos de 1995/96 e 2002/03 para as regiões metropolitanas brasileiras para investigar a evolução da desigualdade regional dos gastos privados per capita e dos gastos privados per capita em educação entre 1996 e 2003. Os resultados mostram que, ao contrário do encontrado para a distribuição regional da renda per capita e para a distribuição regional dos gastos privados per capita, houve uma elevação da desigualdade na distribuição regional dos gastos privados per capita com educação entre as regiões metropolitanas brasileiras. Adicionalmente, mostra-se que tanto os gastos privados com o ensino fundamental e médio como com os gastos privados com ensino superior ficam regionalmente mais concentrados em 2003. Finalmente, são discutidas também possíveis explicações para as diferenças regionais no padrão de gastos com educação das regiões metropolitanas brasileiras.
Palavras-Chave: Desigualdade regional; Gastos; Educação.
Classificação JEL: R23; R12; J24.
ABSTRACT: Motivated by the importance of the regional differentials of education for understanding regional disparities of income in Brazil, the work uses data the Brazilian Household Expenditure Survey (POF) to analyze the dynamic of household educational expenditures of its Metropolitan Regions from 1996 to 2003. We show that the educational household expenditures become more concentrated in the richest Brazilian Metropolitan Regions from 1996 to 2003, acting in the opposite direction of Brazilian Metropolitan total household expenditures, which became less regionally concentrated during the period. This has happened because both household educational elementary and high school expenditures and educational household under graduation expenditures grew more quickly in the richest Metropolitan Regions than in poorest Metropolitan Regions. Additionally, the work also discusses different arguments for understanding the regionally differentiated patterns of expenditures of Brazilian metropolitan regions.
Keywords: Regional inequality; Expenditures; Education. JEL Code: R23; R12; J24.
1. Introduction
Analyses of regional inequality in Brazil have shown that since the year of 1995 the level of regional concentration of per capita income among Brazilian states is decreasing. For example, Silveira Neto and Azzoni (2008) showed that, first, the regional per capita income inequality has decreased from 1995 to 2005 even more than the level of inequality of the Brazilian distribution of personal income and, second, that approximately 40% of this tendency can be attributed to the non-spatial policies like public income transference programs and minimum-salary behavior.
Using micro data from the Brazilian Household Expenditure Survey (POF) for the Brazilian metropolitan regions (MRs) for the years of 1995/96 and 2002/2003, this work deals with two questions related to these evidences. First, we investigate how this per capita income regional inequality reduction is reflected in regional reduction of inequality of per capita expenditures and consumption. This can give us a more direct measure of the recent evolution of regional inequality of welfare. Second, and in a much longer extension, we investigate the evolution of the regional inequality in per capita private education expenditures among Brazilian MRs. As shown by Silveira Neto and Menezes (2007) using micro data from Brazilian Demographic Census of the years of 1970, 1980, 1991 and 2000, the regional differences of levels of education are consistently the most important factors in explaining regional difference of labor income between the Northeast and Southeast regions. Thus, the second question is related to the sustainability of this recent regional per
capita income inequality reduction. Additionally, the study discusses potential immediate
explanations for regional differences in the pattern of education expenditures among Brazilian MRs. To quickly sum up, our main results indicate that although we did find an important reduction in regional inequalities of per capita expenditures and consumption among Brazilian MRs from 1996 to 2003, there was an increasing of regional inequality of private per capita education expenditures among these MRs in this period. By decomposing regional inequality of per capita education expenditures, we also show that both higher regional levels of concentration of elementary and high school education expenditures and of under graduation education expenditures in 2003 than in 1996 contribute to the higher level of regional education expenditures disparities in 2003.
The study presents the following structure. In the next section, we, first, identify regional disparities in the level and in the evolution of per capita expenditures, consumption and educational expenditures; second, we present more specifically the evolution of per capita elementary and high school expenditures and for per capita under graduation expenditures of the Brazilian MRs from 1996 to 2003. In the third section, from a decomposition of the Gini index for regional inequality for the distribution per capita education expenditures among Brazilian MRs, we show the role of each component of per capita education expenditure (elementary and high school and under graduation levels) in the evolution of this inequality. In the fourth section, we discuss the importance of different arguments in explaining regionally differences of education expenditures among Brazilian MRs. The fifth section presents the conclusions of the study.
2. Household expenditures in the Brazilian metropolitan regions: identifying regional disparities in the level and in the evolution of educational expenditures
In this section we use the more recent Brazilian Household Expenditure Surveys (POF) to characterize regional differences in private expenditures in education in the two periods 1995-96 (from now 1996) and 2002-2003 (referred as 2003). In the next sub-section, we briefly describe the data set and present general evidence of regional disparities in the private expenditures in education. In the second and third sub-sections, the analyses are specifically focused on education expenditures in elementary and high school studies and on education expenditures in under graduation studies, respectively.
2.1. The data set and general evidences
Due to geographic data limitation, the regional analysis is based on Brazilian metropolitan regions (MRs), instead of on states or municipalities. Even with this limitation, as the following analysis makes clear, it is possible to identify significant regional differences both in the level and in the evolution of private education expenditures among Brazilian MRs.
The Brazilian Household Expenditure Survey (POF) from IBGE includes micro data information about the level and the evolution of disparities of education expenditures among Brazilian Metropolitan Regions (MRs). This data set is available for 10 Brazilians Metropolitan Regions (Belem, Fortaleza, Recife, Salvador, Belo Horizonte, Rio de Janeiro, São Paulo, Curitiba and Porto Alegre, Goiânia) and for the Federal District. Due to its very specific composition of occupations, with government activities over-represented, we do not include the Federal District in our analysis. Thus, our final POF samples are composed by 16,000 households in 1996 and by 48,568 households in 2003.
In Table 1 we present per capita annual income and expenditure for the 10 Brazilian MRs for the years of 1996 and 2003, where these MRs are ordered from the lowest to the highest level of per
capita income in 1996. As it is well known, there is an important regional income inequality in Brazil
(AZZONI, 2001; SILVEIRA NETO and AZZONI, 2008). The numbers of Table 1 confirm this regularity and show how much of these regional disparities are also present in household expenditures and education expenditure.
Table 1 – Annual per capita Income and expenditure of Brazilian metropolitan regions (R$ 2003) Brazilian MRs per capita income (A) per capita total expenditure (B) per capita consumption expenditure (C) C/B (%) per capita education expenditure (D) D/C (%) 1996 Fortaleza 4637.04 3996.84 3034.56 75.9 186.00 6.1 Recife 4640.76 4333.44 3466.56 80.0 182.28 5.3 Salvador 5127.24 4686.96 3756.72 80.2 269.16 7.2 Belém 5448.12 4809.48 3820.56 79.4 210.72 5.5 B. Horizonte 8004.36 7654.20 5242.32 68.5 250.20 4.8 Goiânia 8312.52 6664.20 4503.60 67.6 341.64 7.6 R. de Janeiro 8329.32 6451.68 4693.44 72.7 209.28 4.5 Curitiba 9247.80 8456.28 5843.52 69.1 296.16 5.1 P. Alegre 9832.08 8235.36 5672.88 68.9 277.44 4.9 São Paulo 9964.92 8596.08 5996.76 69.8 281.64 4.7 - 2003 Fortaleza 4655.04 4746.12 3404.40 71.7 187.44 5.7 Recife 4488.00 4745.28 3595.20 75.8 194.28 5.6 Salvador 5625.12 5725.56 4158.60 72.6 252.84 6.3 Belém 3848.88 4012.44 3147.84 78.5 169.32 5.6 B. Horizonte 7656.84 6691.92 4609.92 68.9 328.68 7.4 Goiânia 6918.96 6469.92 4811.76 74.4 379.92 8.1 R. de Janeiro 8340.36 7982.88 5845.20 73.2 354.72 6.3 Curitiba 8421.24 8004.24 5720.88 71.5 336.24 6.1 P. Alegre 8066.88 7283.04 5115.96 70.2 277.20 5.6 São Paulo 8535.72 7989.96 5621.40 70.4 420.24 7.8
Source: Author’s calculus from micro data of Pesquisa de Orçamento Familiar (POF) – IBGE. Note: We use IPC-IBGE price index for adjusting values.
In fact levels of per capita income, expenditures, consumption and education expenditures are much lower in MRs of North and Northeast macro regions (Fortaleza, Recife, Salvador e Belém) than in the MRs of Southeast and South macro regions (Belo Horizonte, Rio de Janeiro, Curitiba, Porto Alegre and São Paulo). More specifically, for example, the numbers of Table 1 indicates that while the per capita income MR of São Paulo the richest one was equivalent of 1.8 times the this of Fortaleza in 2003, comparisons between the same MRs using per capita expenditures, consumption and education expenditures indicate ratios, respectively, of 1.7, 1.7 and 2.2. Thus regional disparities of levels of expenditures are of the same order of significance as regional disparities of income. Besides, theses regional disparities imply regional inequalities related to the participations of expenditures and consumption in the income among Brazilian MRs.
Nevertheless, by comparing the numbers of the year of 1996 with these of the year of 2003, it is possible to note that the dynamic of regional inequality of education expenditures is very different from these observed to per capita incomes, per capita expenditures and per capita consumption. In fact, in spite of the higher increasing of per capita consumption expenditure in poorest MRs of North and Northeast, per capita education expenditures have presented a higher increased in the richest MRs of Southeast and South than in the poorest MRs of North and Northeast.
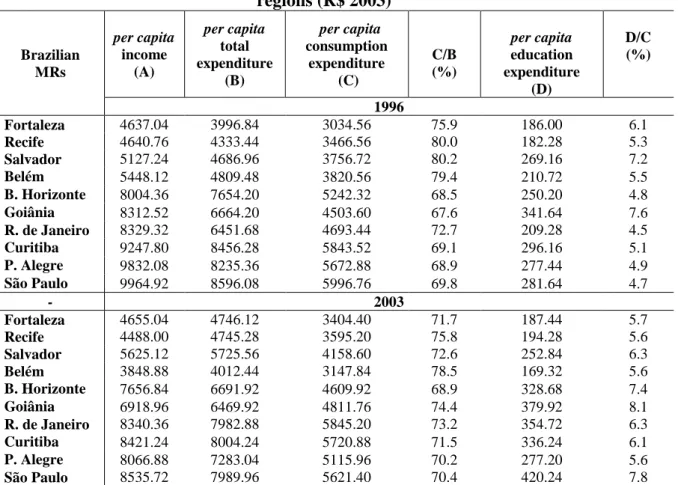
As indicated by Table 1 last column, these regionally differentiated dynamic of per capita education expenditure help to understand the increasing in the participation of education expenditure in total consumption expenditure in the south and southeast Brazilian MRs while this participation did not significantly change in the poorest MRs of North and Northeast. To get a clearer picture of regional differences in the dynamic of per capita education expenditure, the following Figure 1 brings the dynamic of each Brazilian MRs from 1996 to 2003 relative to this of the MR of São Paulo.
From the numbers of the Figure 1, we note that not only the MRs of Salvador and Belém have presented decreasing per capita education expenditure from 1996 to 2003 (black columns), as the others Northeast MR of Fortaleza e Recife have presented lower rate of growth of this expenditure than the MR of São Paulo (note the distances from the relative levels in 1996). Actually, only one of the four MRs of North and Northeast presented a level of per capita education expenditure higher than 50% of the level observed in the MR of São Paulo.
As for the MRs of South and Southeast regions, we note more diverse dynamics. On one hand, we note that the MR of Rio de Janeiro have presented the highest rate of growth of per capita education expenditures from 1996 to 2003; for the case of the MR of Porto Alegre, on the other hand, we note a decreasing of this expenditure during the period.
Figure 1 – Per capita household educational expenditure relative to these of São Paulo MR (=100)
Source: Pesquisa de Orçamento Familiar – POF- IBGE.
Note: We use IPC-IBGE price index for adjusting values. Black columns reflect decreasing of educational expenditures.
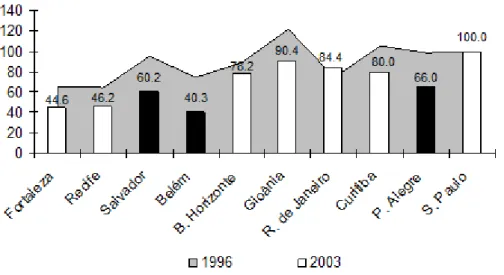
As expected, these regionally differentiated dynamics of per capita education expenditure implied a higher level of regional inequality of education expenditure during the period of analysis. In the following Figure 2, we present the values of different traditional indicators of inequality for
per capita consumption expenditures (that includes education) and for per capita education
expenditure calculated for the set of above 10 MRs in the years of 1996 and 2003.
Figure 2 – Evolution of regional consumption and education expenditure inequalities
Source: Pesquisa de Orçamento Familiar – POF- IBGE. Note: We use IPC-IBGE price index for adjusting values.
As we can immediately note by comparing education curves of the two years of the figure, differently from what is observed for per capita consumption expenditure, for all inequality index the values for the year of 2003 are higher than those for the year 1996. In other words, using any of these indicators, we conclude that, in opposite direction of the others aggregate of Table 1, regional inequality of per capita education expenditure among Brazilian MRs have increased from 1996 to 2003.
In the following sub-sections we investigate more deeply the dynamic of regional inequality of education expenditure of Brazilian MRs by considering different kinds of education expenditures. As we will see, the above regionally differentiated behavior reflects very different situations of regional inequality for elementary and high school household educational expenditures, on one hand, and under graduation household educational expenditures, on the other.
2.2. Elementary and High School education expenditures
In fact, we find a relative more regionally homogeneous picture when we look at elementary and high school per capita household educational expenditures of Brazilian MRs, as the numbers of next Table 2 shows.
Figure 2 - Evolution of regional consumption and education expenditure inequalities 0,0000 0,0500 0,1000 0,1500 0,2000 0,2500 0,3000 0,3500 relative mean deviation coefficient of variation standard deviation of logs
Gini coefficient Theil entropy measure
Consumptiom_1996 Consumption_2003
Table 2 - Value of per capita household educational expenditures of Brazilian Metropolitan Regions (RS of 2003): elementary and high schools levels
Brazilian MRs 1996 2003 Variation (%) Fortaleza 113,73 83,47 -26,6 Recife 113,14 99,96 -11,6 Salvador 146,55 116,05 -20,8 Belém 110,59 61,41 -44,5 Belo Horizonte 83,28 110,13 32,2 Goiânia 170,1 121,52 -28,6 Rio de Janeiro 111,8 126,84 13,5 Curitiba 136,07 104,06 -23,5 Porto Alegre 99,09 62,85 -36,6 São Paulo 119,67 130,39 9,0
Source: Pesquisa de Orçamento Familiar – POF- IBGE. Note: We use IPC-IBGE price index for adjusting values.
From above numbers, we can observe the more regionally homogeneous situation for elementary and high school household educational expenditures occurs not only for the levels, as for the dynamic from 1996 to 2003. Initially, note that the referred expenditures for the poorest MRs of North and Northeast were more than 90% of these of São Paulo MR in 1996. Second, note that seven of the ten MRs presented a decreasing of per capita household expenditure in elementary and high school studies from 1996 to 2003. A suggestive evidence, only the three biggest MRs of São Paulo, Rio de Janeiro and Belo Horizonte have presented an increasing of these expenditures during the period. These comparisons with the MR of São Paulo are made even clearer though the following Figure 3.
Figure 3 – Per capita household educational expenditure in elementary and high school studies relative these of São Paulo MR (=100)
Source: Pesquisa de Orçamento Familiar – POF- IBGE.
Notre: We use IPC-IBGE price index for adjusting values. Black columns reflect decreasing of educational expenditures.
As we have argued, the above changes are consistent with a higher expansion of public schools education offers than of private schools from 1996 to 2003. We do not have numbers to MRs, but using correspondent states, the following Table 3 presents the rates of growth of the numbers of students of private and public schools and the total variation from 1996 to 2003. With the exception of the state of Goiás, the numbers permit us to observe dramatic changes in the nature public/private of schooling opportunities.
Table 3 – Variations of the numbers of students of elementary and high school levels from 1996 to 2003 (%): private schools, public schools and total
Brazilian MRs Private Public Total
Ceará -30.6 34.7 21.5 Pernambuco -5.7 13.9 8.7 Bahia -22.6 38.0 28.6 Pará -4.8 29.7 27.6 Minas Gerais 2.5 5.1 4.9 Goiás 19.0 6.8 7.2 Rio de Janeiro 4.0 30.2 34.3 Paraná -2.7 -0.5 -0.7
Rio Grande do Sul -22.8 8.0 -14.4
São Paulo -3.4 -3.1 -3.1
Brazil -9.8 15.1 11.9
Source: Censo da Educação – MEC.
Consistent with the numbers of Table 2, that show reductions of per capita household educational expenditures in elementary and high school levels of for the majority of MRs regions, for the majority of states as for all the country, the Table 6 numbers show expansion and reduction of the number of students, respectively, in public and in private students from 1996 to 2003. Actually, except for the curious case of the Rio de Janeiro state, note that the increasing of the numbers of students is much higher in the poorest states of North and Northeast.
These simultaneous movements indicated in Tables 2 and 3 do suggest that, aside a expansion of general school attendance in Brazil in the period1, there was a substitution of private to public schools in the supply of elementary and high school studies in the Brazilian RMs and this potential substitution was strongest in the poorest or in the smallest MRs than in the richest and the biggest ones.
2.3. Under graduation education expenditures
As the numbers of following Table 4 and Figure 4 make clear, we get a much more regionally differentiated picture by looking at per capita household expenditures in under graduation studies of Brazilian MRs.
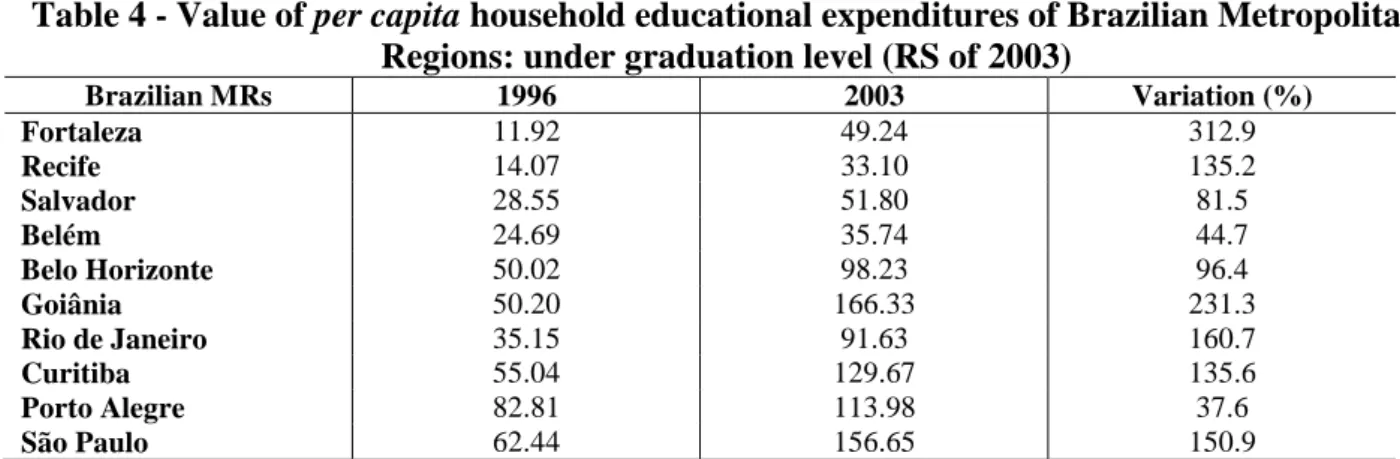
Table 4 - Value of per capita household educational expenditures of Brazilian Metropolitan Regions: under graduation level (RS of 2003)
Brazilian MRs 1996 2003 Variation (%) Fortaleza 11.92 49.24 312.9 Recife 14.07 33.10 135.2 Salvador 28.55 51.80 81.5 Belém 24.69 35.74 44.7 Belo Horizonte 50.02 98.23 96.4 Goiânia 50.20 166.33 231.3 Rio de Janeiro 35.15 91.63 160.7 Curitiba 55.04 129.67 135.6 Porto Alegre 82.81 113.98 37.6 São Paulo 62.44 156.65 150.9
Source: Pesquisa de Orçamento Familiar – POF- IBGE. Note: We use IPC-IBGE price index for adjusting values.
Firstly, we note that regional disparities in per capita household educational expenditures are much more significant, with the poorest MRs presenting much lower levels of expenditures than the richest ones. Specifically, note that none of the North and Northeast MRs presents levels of under
graduation education expenditures up to 35% of the level of the MR of São Paulo in 2003 or 1996. In particular, note that the most populated MR of the Northeast region, Recife, although presenting some growth during the period, continued to present a level of per capita household expenditure in under graduation studies less than 22% of these of the MR of São Paulo in 2003.
A second point to highlight from Table 4 is that we observe a higher level of expansion of per
capita household educational expenditure in under graduation level than that observed to elementary
and high school levels. This surely is related to the smaller rate of growth of public education supply in under graduation than in elementary and high school levels. For example, from 2000 to 2003 the participation of pure private under graduation studies supply in total under graduation studies supply of Brazil grew from 34% to 39%2.
Besides, we observe that, apart from the second biggest MR of Rio de Janeiro, only the MRs of Fortaleza and Goiânia presented a higher expansion of per capita household educational expenditures in under graduation studies than this observed to the MR of São Paulo. These regional differentiated dynamic of per capita household educational expenditures in under graduation studies is made clearer by the numbers of the following Figure 4 that, again, takes the MR of São Paulo as reference.
Figure 4 – Per capita household educational expenditure in under graduation studies relative to these of São Paulo MR (=100)
Source: Pesquisa de Orçamento Familiar – POF- IBGE.
Note: We use IPC-IBGE price index for adjusting values. The non-existence of black columns means that there is not any MR with decreasing of educational expenditures.
3. Decomposing the variation of regional inequality of private expenditures in education: the roles of the different kinds of expenditures
In the discussion of preceding section we have shown that the per capita education expenditure increased more in the richest MRs regions of Brazil than in the poorest ones from 1996 to 2003. More specifically, we have noted that per capita elementary and high schools education expenditure of MRs has decreased in most of MRs in the period, a trend that was stronger in the poorest MRs than in the richest ones. Besides, we have highlighted that the per capita under graduation expenditure has increased in all Brazilian MRs, a movement that was stronger in the richest MRs than in the poorest ones. These two tendencies explain the increase in the regional
inequality of expenditure in education among Brazilian MRs from 1996 to 2003. Using a decomposition of the traditional Gini coefficient, in this section, we measure the contribution of the different kinds of expenditures in education for the increasing of inequality expenditure of education expenditure among Brazilian MRs during the period.
To obtain measures of contribution of different kinds of education expenditures for the dynamic of regional inequality of private expenditures in education we adapted for the case of per
capita education expenditures the Gini coefficient decomposition used, for example, by Hoffman
(2006) for studying income inequality dynamic. From this methodology, the contributions of each kind of per capita expenditure for the change of Gini coefficient (G) for the distribution of total per
capita education expenditure of Brazilian MRs can be measured as:
n i i i n i i i G C C G 1 1 , (1) where,
1
2 1 it it i and
1
2 1 Gt Gt G .In this expression, i indexes different kinds of education expenditures, i is the share (or
participation) of group i in total education expenditure and Ci is the concentration coefficient of the
education expenditure i. This coefficient is a measure of how pro-poor (pro-rich) is distributed the specific component i of total education expenditure relative the distribution of total per capita education expenditure among Brazilian MRs. Thus, if a specific Ci is lower than the Gini coefficient,
we can say that the component i of the total per capita education expenditure is more pro-poor MRs distributed than the distribution of total per capita education expenditure3.
For two periods, t and t-1, it is possible to observe of the Gini index is determined by the variation concentration coefficient (concentration-effect, second term of equation (1))) and by the variation from the participations of different kinds of expenditures in total educational expenditure (participation-effect, first term in equation (1))).
Considering the distribution of total per capita education expenditure among Brazilian MRs and the same partition of total per capita education expenditure of previous sections, the following Table 5 presents the values of participations and concentration coefficients for years of 1996 and 2003.
Table 5 – Participation in total educational expenditures and concentration coefficient of the different education expenditures
Variable Participation (αi) Concentration coefficient (Ci)
1996 2003 1996 2003 Elementary and High School 0.464 0.338 0.045 0.092 Under graduation 0.189 0.324 0.166 0.202 Others education activities 0.348 0.338 0.114 0.128 Total 1.000 1.000 0.092 0.140
Source: Author’s calculus from micro data of Pesquisa de Orçamento Familiar (POF) – IBGE.
From the first two columns of Table 5, we see that, although the elementary and high school expenditure is the most important component of total per capita education expenditures (more than 33.8% of total per capita educational expenditure), consistent with previous evidence, there was a
sharp increase in the participation of under graduation expenditure component in the total per capita education expenditures of Brazilian MRs (from 19% to 32% of total). Thus, there was a much more homogenous distribution of per capita expenditures among different kinds of education expenditures in 2003.
As for the concentration coefficients, from Table 5 third and fourth columns, we note a general tendency of higher concentration of per capita education expenditures in the richest Brazilian MRs: all three components present a higher value of concentration coefficient in 2003 than in 1996. Futhermore, differently from the situation for under graduation education expenditures, we can also note that the levels of regional concentration of elementary and high school expenditures (concentration coefficient of 0.092) continued to be below than these observed for the total per capita education expenditures in 2003 (given by the Gini value of 0.140). In other words, the distribution of education expenditures is much more favorable to the poorest MRs than the distribution of total education expenditures or than under graduation education expenditures.
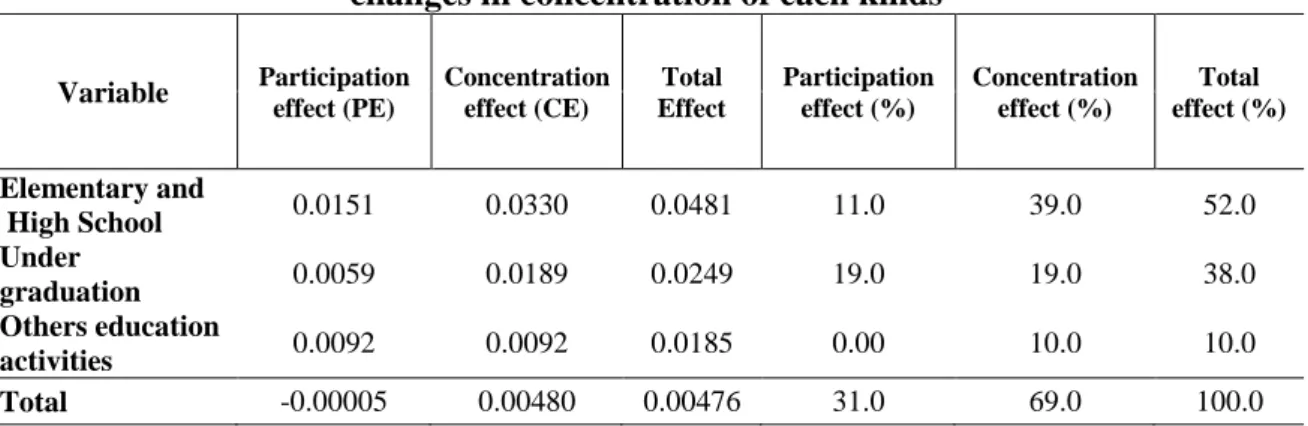
The above both movements for participations and for concentration coefficients explain the increasing of Gini coefficient from 0.092 to 0.140. Based on the decomposition of proposed though equation (1), the following Table 6 presents precise number of these contributions.
Table 6 – Absolute and relative (%) contributions of the changes in participations and of the changes in concentration of each kinds
Variable Participation effect (PE) Concentration effect (CE) Total Effect Participation effect (%) Concentration effect (%) Total effect (%) Elementary and High School 0.0151 0.0330 0.0481 11.0 39.0 52.0 Under graduation 0.0059 0.0189 0.0249 19.0 19.0 38.0 Others education activities 0.0092 0.0092 0.0185 0.00 10.0 10.0 Total -0.00005 0.00480 0.00476 31.0 69.0 100.0
Source: Author’s calculus from micro data of Pesquisa de Orçamento Familiar (POF) – IBGE.
The last line of above table indicates that the increased of Gini coefficient is mainly explained by the concentration effect (69% of Gini increasing), present in all the kinds of education expenditures. In other words, the higher concentration of education expenditure among Brazilian MRs in 2003 than in 1996 is fundamentally explained by a redistribution of the different kinds of education expenditures from the poorest to the richest MRs. To a less but important extension, the changes in the participations of expenditures also helps this concentration tendency (31% of Gini variation).
Form the last two columns of Table 8 indicates, we note that the main forces behind this movement towards a higher level of regional concentration of Brazilian education expenditure are the pro richest MRs dynamic of both elementary and high school (39% of Gini index increase) and under graduation education expenditures (19% of Gini index increase).
As for the participations effects, at on hand, as the under graduation education expenditure was in 1996 the most regionally concentrated education expenditures and has presented the higher increasing in participation in total education expenditure (see Table 7), we also note that 19% of Gini index increasing can be attributed to the participation effect of this component. On the other hand, because the level of regional concentration of elementary and high schools education expenditure was the lowest in the beginning of the period and there was a reduction in the participation of this kind of expenditure in total education expenditure, we also note a participation effect of this component favoring the increasing of Gini index of 10%.
4. Investigating immediate explanations for regionally differentiated patterns of education expenditures
The set of evidence we have shown though the above tables and figures permit us to observe the significant regional disparities of per capita household educational expenditures among Brazilian MRs. Primarily, we noted that the poorest MRs of North and Northeast also present lower levels of
per capita household total educational expenditures and these regions became more distant from the
richest ones from 1996 to 2003. Then, we also noted that, although there was a general reduction of household expenditures in elementary and high school levels across Brazilian MRs, this reduction was much more significant across the poorest MRs. Finally, considering the regional dynamic of per
capita household educational expenditures in under graduation studies, we observed a general
increasing of expenditures across Brazilian MRs and, except for the case of MR of Fortaleza, the movement did not favored the poorest MRs regions. The precedent section gave us not only a general picture of these dynamics, as brought information about of the roles of each kind of education expenditures in the increasing of regional inequality of education expenditure among Brazilian MRs. To get a more consolidated picture of these movements, in the following figure 5 we show the distribution of per capita household educational expenditures among three components (elementary and high school, under graduation, other expenditures) for each Brazilian MRs.
Figure 5 – Distribution of metropolitan per capita education expenditures by kids of expenditure - 2003
Source: Pesquisa de Orçamento Familiar – POF- IBGE.
The numbers of the above figure make clear that the poorest Brazilian MRs, even with a more significant reduction of this kind of expenditure from 1996 to 2003, present a higher percentage of educational expenditures in elementary and high school levels than the richest ones, the opposite occurring for per capita household under graduation educational expenditures. Taking in account, on one hand, the regionally differentiated level of per capita resources available to the correspondent household discussed at the precedent section and, on the other hand, the expected educational role of the government, this is an unexpected pattern of regional differentiation.
In this section we make an initial and exploratory investigation of the immediate potential explanations for the above regionally differentiated patterns of regional expenditures. We consider four potential different explanations: regionally differentiated relative prices for different levels of education services, regionally differentiated age demographic patterns, historical lag of the human capital investment of the poorest MRs and quality differences between public and private schools. Of
course, all these factors represent different sources of action of the primary explanation related to regional difference of economic development among Brazilian MRs, which implies regionally differentiated demographic, patterns of demand for education and related prices and the regional parching power of families. Nevertheless, once it can highlight the limits of government policies, it is informative to point out the potential relative importance of each of them for the case of Brazilian MRs.
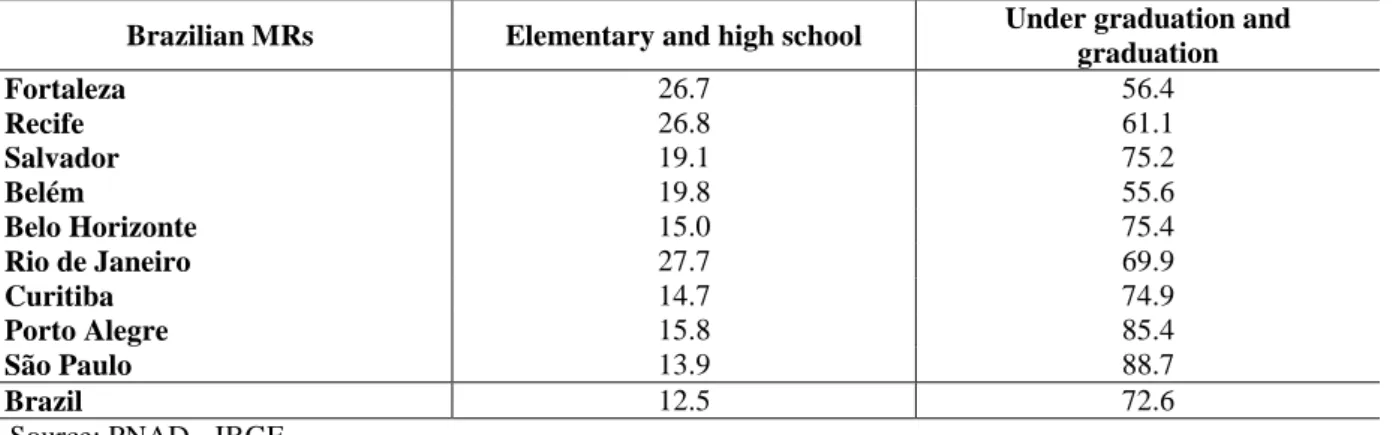
In the following Table 7, we initially present the parcels of private education services in the total of education services for both elementary and high schools levels and under graduation and graduation levels of each Brazilian MR and the country. These numbers appear entirely consistent with those of Figure 5.
More specifically, from the above numbers, we note that, except for the case of Rio de Janeiro MR, the poorest MRs from North and Northeast regions presented the highest parcels of students in private elementary and high school levels. Thus, these evidences strongly suggest that, together with lower historical educational levels, part of the explanation for the higher parcels of per capita household educational expenditure in elementary and high school levels observed for Brazilian poorest MRs is related to less public educational services offers and or to worse quality public schools in these MRs.
In the last line of Table 7 we also observe that public elementary and high school educational services are relatively more important when we consider all students of the country than when we deal only with Brazilian MRs students, a result we expected given the high value of income elasticity for education services.
Table 7 – Parcels of students in private elementary and high school schools and in private under graduation and graduation schools (%). Brazilian Metropolitan Regions and the all the
country - 2003
Brazilian MRs Elementary and high school Under graduation and graduation Fortaleza 26.7 56.4 Recife 26.8 61.1 Salvador 19.1 75.2 Belém 19.8 55.6 Belo Horizonte 15.0 75.4 Rio de Janeiro 27.7 69.9 Curitiba 14.7 74.9 Porto Alegre 15.8 85.4 São Paulo 13.9 88.7 Brazil 12.5 72.6
Source: PNAD - IBGE.
Note: From PNAD micro data, it is not possible to obtain information for the MR of Goiânia.
As for under graduation and graduation studies, we observe that the public under graduation and graduation educations services are relatively more important in these referred MRs from North and Northeast regions. In the opposite situation, in the MR of São Paulo, the richest one, almost 90% of under graduation and graduation students were in private schools in 2003.
4.1. Regionally differentiated relative prices
We now look at the immediate possible explanations for the regionally observed pattern of education expenditures we have uncovered in Figure 5. First, we call the attention that the Figure 5 numbers reflect values. Thus, a trivial potential explanation could be regionally differenced relative price of elementary and high school education services and under graduation education services, with
the price of first group of education services (elementary and high school) compared to the price of second group (under graduation) being higher in the poorest MRs than in the richest ones.
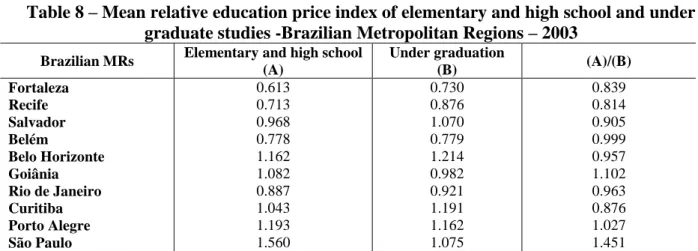
In the following Table 8, we present mean relative education price index both for elementary and high school (column (A)) and for under graduation (column (B)). In Table 8 third column ((A)/(B)), we compare this mean relative price index.
Table 8 – Mean relative education price index of elementary and high school and under graduate studies -Brazilian Metropolitan Regions – 2003
Brazilian MRs Elementary and high school (A) Under graduation (B) (A)/(B) Fortaleza 0.613 0.730 0.839 Recife 0.713 0.876 0.814 Salvador 0.968 1.070 0.905 Belém 0.778 0.779 0.999 Belo Horizonte 1.162 1.214 0.957 Goiânia 1.082 0.982 1.102 Rio de Janeiro 0.887 0.921 0.963 Curitiba 1.043 1.191 0.876 Porto Alegre 1.193 1.162 1.027 São Paulo 1.560 1.075 1.451
Source: Author’s calculus using information from IBGE price consumption price index (IPC).
As we can immediately note, relative to the mean prices of Brazilian MRs, prices are higher for both kinds of educations services in the richest MRs from the South and Southeast regions than in the poorest ones from the North and Northeast regions. This is an absolutely expected result since education services use intensively the labor factor. Besides, in the third column of Table 8, we note that this regional difference is bigger to elementary and high school studies than to under graduation studies. In other words, not only prices of education services are higher in the richest MRs than in poorest ones, they are even higher in elementary and high school studies. For example, for the MR of São Paulo, the prices of elementary and high school studies relative to those of under graduation studies are 45% higher than this mean ratio for the set of all MRs; on the other, in the MR of Recife the prices of elementary and high school studies relative to those of under graduation studies are only 81% of those observed to the mean ratio for the set of all MRs.
These evidences imply that we can not explain the higher parcel of education expenditures in elementary and high school studies in the poorest Brazilian MRs though regionally differenced prices of different kinds of education services.
4.2. Regionally differentiated age demographic patterns
Changing the focus from prices to quantities, we also have investigated the potential role of regionally differenced age demographic patterns among Brazilian. Because of the positive relationship between populations mean age and indicators of social development, such as per capita income, it could be that the higher parcel of education expenditures in elementary and high school studies in the poorest Brazilian MRs reflected the higher parcels of children and young people in these MRs and the associated necessity of expenditures on this kind of education services.
As the numbers in the following Table 9 indicate, this argument surely can not explain the significant regional differences observed in Figure 5.
Table 9 – Participation of age groups in the total population - Brazilian Metropolitan Regions and the all the country (%) - 2003
Brazilian MRs 6 to 18 years old 18 to 24 years old
Fortaleza 26.5 14.9 Recife 24.0 14.1 Salvador 24.1 16.2 Belém 24.3 15.7 Belo Horizonte 23.2 13.9 Rio de Janeiro 19.7 12.1 Curitiba 22.0 13.0 Porto Alegre 23.9 12.9 São Paulo 22.7 13.8 Brazil 25.0 13.4
Source: PNAD - IBGE.
Note: From PNAD micro data, it is not possible to obtain information for the MR of Goiânia.
More specifically, although we have found higher parcel of children and young individuals in total population in the poorest MRs, for the majority cases these differences were not statistical significant. In fact, only for the cases of the MR of Fortaleza, for age group of 6 to 18 years old, it was possible to assume significance of the differences. As for the case of age group of 18 to 24, note that the higher percentage of individuals in the poorest MRs do not favor the argument.
4.3. Historical regional delay in education
Next we have investigated a more direct argument related to the use of education services. Even if we ignore the two above arguments in understanding the regionally differenced situations we have got from the Figure 5, it could be that these regional differences only reflect historical deficit of human capital investment in the poorest Brazilian MRs. This historical deficit of human capital investment would imply both relatively less students in high schools, thus demanding relatively less future under graduation studies, and relatively less students in under graduation, so demanding relatively less current under graduation studies. In the following Table 10, we present evidences consistent with this perspective.
Table 10 – Participation of high school students from 15 to 18 years old and of under graduation students from 18 to 24 years old in the total of respective age population (%) - Brazilian Metropolitan
Regions and the all the country (%) - 2003
Brazilian MRs High school – 15 to 18 years old Under graduation – 18 to 24 years old
Fortaleza 38.7 10.0 Recife 37.5 8.6 Salvador 38.4 10.0 Belém 32.5 7.8 Belo Horizonte 55.4 13.1 Rio de Janeiro 49.0 16.2 Curitiba 51.9 18.8 Porto Alegre 55.1 17.3 São Paulo 63.2 13.3 Brazil 43.8 10.4
Source: PNAD - IBGE.
Note: From PNAD micro data, it is not possible to obtain information for the MR of Goiânia.
From the above numbers, we note that not only the richest regions present a higher percentage of high school students at 15 to 18 years old age group, but, because historical deficit of investment in human capital in the poorest Brazilian MRs, the richest MRs also present highest percentage of
under graduation students at 18 to 24 years old group4. Thus, this set of evidence implies not only a
current higher demand to under graduation studies in the richest MRs than in the poorest ones, but also a higher potential future one.
Unless public provision of under graduation education services had been expanded more quickly in the richest MRs, these evidence represent a factor pushing up household education expenditures in these Brazilian MRs. This tendency is totally consistent with both the numbers of Figure 5 (distribution of expenditures) and of Table 7 (percentage of students). So, this set of evidence do suggest that the regionally differenced distribution of education expenditures across levels of studies we have shown in Figure 5 for Brazilian MRs, at least partially, can be explained by historical deficit of capital investment in the poorest MRs, a situation that is consistent with the idea of a education poverty trap in the Brazilian MRs of North and Northeast.
4.4. Quality differential between public and private education
Finally, we investigate an argument related to the differential of quality between public and private educations. Our point is that, since there is bigger difference of quality between private and public educations in the poorest MRs than in the richest ones5, in the poorest MRs is also bigger the resistance of richer families in putting their sons in public schools. Thus, for equally richer families in poor and rich MRs, we would observe a stronger presence of them in public elementary and high school education system in the richest MRs than in the poorest ones. The following Table 11 brings some evidences about it.
Table 11 – Participation of students from family with per capita income above 5 minimum-salary in public and private education, elementary and high school (%) - Brazilian Metropolitan Regions and
the all the country - 2003
Brazilian MRs education Public (A) Private education (B) Public and Private education (C) Ratio (%) (A)/(C) Ratio (%) (B)/(C) Fortaleza 0.2 8.4 1.8 11.1 466.7 Recife 0.2 5.4 1.5 13.3 360.0 Salvador 0.1 12.1 2.4 4.2 504.2 Belém 0.2 7.9 1.7 11.8 464.7 Belo Horizonte 0.3 22.9 3.5 8.6 654.3 Rio de Janeiro 0.9 15.6 4.9 18.4 318.4 Curitiba 1.1 26.0 5.0 22.0 520.0 Porto Alegre 1.0 18.3 3.5 28.6 522.9 São Paulo 1.1 31.3 5.1 21.6 613.7 Brazil 0.6 16.6 4.4 13.6 377.3
Source: PNAD - IBGE.
Note:From PNAD micro data, it is not possible to obtain information for the MR of Goiânia.
The numbers of above table present evidence about the allocation of students between public and private schools by the richest families (above 5 minimum-salaries). The Table 11 third column ((C)) shows that, as expected, there was stronger presence of this group of families in the richest MRs. But, by comparing this column with the first ((A)) and second ((B)) columns, we can note that there were clear regionally differenced presences of the richest families students in private schools ((B)/(C)) and in public education ((A)/(C)), being in both cases stronger the presence of these families in the richest MRs.
4 For both columns, considering different pairs of richest and poorest MRs, difference of proportions tests show statistical significance at 5%.
5 The results of 2007 ENEM (Exame Nacional do Ensino Médio), for example, have shown that the mean of the notes of privates schools in the 5 poorest cities of table 9 were 33% higher than the notes of public schools. The same number for the 5 richest cities of table 9 was 28.5%.
These patterns are consistent with both higher price of education services in the richest MRs than in the poorest ones and with higher quality differentials between public and private schools in the poorest MRs than in the richest ones. Note that, since high quality education services also imply higher prices, it is very difficult to decompose the two effects. Thus, it does appear that the highest quality differentials between public and private schools in the poorest from the North and Northeast MRs can contribute in understanding the regional difference of expenditures we showed in Figure 5.
5. Conclusions
Motivated by the importance of the regional disparities of education levels for understanding Brazilian regional income inequalities, in this work we have done an exploratory and pioneer investigation about the regional differences in the levels and in the dynamic of private education expenditures of Brazilian Metropolitan Regions (MRs) from the year 1996 to 2003. From our results, three sets of evidence must be highlighted.
First, we noted that, consistent with their levels of wealth, the richest Brazilian MRs from South and Southeast regions present higher levels of per capita educational expenditures than the poorest ones from North and Northeast regions. Furthermore, we also note that, differently from the regional inequality dynamic observed to per capita income or per capita consumption, we showed that the regional inequality of per capita education expenditure have increased from 1996 to 2003.
Second, from a decomposition of the Gini index variation of per capita education expenditure for Brazilian MRs between 1996 and 2003, we have shown that both elementary and high school expenditures and under graduation expenditures contributed to a higher level of Gini index in 2003 than in 1996. In other words, both groups of expenditures became more concentrated in the richest MRs from South and Southeast regions. Nevertheless, this pattern is much more important for elementary and high school expenditures (alone this kind of expenditures explains 46% of the Gini index increasing).
Finally, we have shown that the higher participation of elementary and high school expenditures and the lower participation of under graduation in total education expenditure in the poorest MRs of North and Northeast than in the richest MRs of South and Southeast regions is probably associated to the historical regional delay in education in the poorest MRs and to the highest quality differentials between public and private schools in these regions. Note that these results are consistent with a poverty trap in education in the MRs from North and Northeast.
Does this all set of evidence necessarily imply that the poorest Brazilian MRs is becoming even more behind in the human capital investment? Not necessarily. But the results surely imply that a stronger role for public investment in education is necessary in these MRs.
References
Azzoni, C. R. Economic growth and regional income inequality in Brazil, Annals of Regional Science, v. 35, p. 133-152, 2001.
Cardoso, E.; Souza, A. P. The Impact of Cash Transfers in Child Labor and School Attendance in Brazil. Working Paper No. 04-W07. Department of Economics Vanderbilt University Nashville, 2004.
Duarte, G. B.; Silveira Neto. Avaliando o Impacto do Programa Bolsa Família sobre a Freqüência Escolar: o Caso da Agricultura Familiar no Nordeste do Brasil. In: Anais do XIII Encontro
Regional de Economia, Anpec Nordeste, 2008.
Hoffmann, R. Transferências de renda e a redução da desigualdade no Brasil e cinco regiões entre 1997 e 2004. Econômica, Rio de Janeiro, v. 8, n. 1, p. 55-81, jun. 2006.
Silveira Neto, R. M.; Azzoni, C. R. Non-spatial public policies and regional income inequality in Brazil. In: Annals of the 8th Regional Science Association International Congress, São Paulo, 2008. Silveira Neto, R. M.; Menezes, T. A. Disparidades Regionais no Brasil: Analisando a Importância do
Capital Humano. In: Anais do XIII Fórum Brasil-Europa, Recife, 2007.
Soares, S. Análise de bem-estar e decomposição por fatores da queda na desigualdade entre 1995 e 2004. Econômica, Rio de Janeiro, v. 8, n. 1, p. 83-115, jun. 2006.