www.scielo.br/rbg
DC RESISTIVITY METHOD APPLIED IN THE MONITORING OF DIESEL LEAKAGE
IN A RAILWAY ACCIDENT IN S ˜AO MANUEL CITY, S ˜AO PAULO STATE (BRAZIL)
C´esar Augusto Moreira
1, L´ıvia Portes Innocenti Helene
2and Ariane Raissa Pinheiro Cˆortes
2ABSTRACT.This paper presents an integrated analysis of geochemical and geophysical data in a contaminated site, currently under environmental monitoring, after a leakage of 240,000l of diesel in 1999. The main objective is to assess the presence of subsurface contaminants in residual and dissolved phases, using Electrical Resistivity Tomography (ERT), and to understand the effects of natural degradation of hydrocarbons and changes in electrical properties in soil and groundwater. The results allowed for the definition of two distinct resistivity patterns containing dissolved hydrocarbon phases, defined after historical chemical analyzes. The intermediate resistivity values (260Ω.m and 511Ω.m) are indicative of the coexistence of hydrocarbons in residual and dissolved phases. The higher resistivity values (>1000Ω.m) reveal the prevalence of residual phases with incipient degradation, possibly due to high toxicity concentrations prevailing the effective action of biodegradation processes. The generation of 3D visualization models from 2D sections allows the use of the isosurface modeling technique and definition of a high resistivity body, consistent with conceptual models of hydrocarbons dispersion in the subsurface. The diagnostic of an area with potential accumulation of hydrocarbons in residual phase can subsidize the planning of remediation techniques to promote the complete decontamination of the area.
Keywords: contamination, hydrocarbons, residual phase, dissolved phase, electrical resistivity tomography.
RESUMO.Este trabalho realiza uma integrac¸˜ao de dados geoqu´ımicos e geof´ısicos obtidos numa ´area contaminada pelo vazamento de 240.000l de diesel, em 1999, e que atualmente est´a sob monitoramento ambiental. O principal objetivo ´e a verificac¸˜ao da presenc¸a de fases residual e dissolvida de contaminantes em subsuperf´ıcie, por meio da t´ecnica de tomografia el´etrica (ETR), para compreens˜ao dos efeitos do processo de atenuac¸˜ao natural na degradac¸˜ao de hidrocarbonetos e alterac¸˜oes em propriedades el´etricas do solo e ´aguas subterrˆaneas. Os resultados permitiram a definic¸˜ao de dois padr˜oes distintos de resistividade numa regi˜ao com presenc¸a de fase dissolvida, definido a partir do hist´orico de an´alises qu´ımicas. Valores intermedi´arios (260Ω.m e 511Ω.m) s˜ao indicativos da coexistˆencia de hidrocarbonetos em fases residual e dissolvida. A regi˜ao com elevados valores (>1000Ω.m) indica a prevalˆencia de fase residual com degradac¸˜ao incipiente, possivelmente sob concentrac¸˜oes altamente t´oxicas para uma ac¸˜ao efetiva dos processos de biodegradac¸˜ao. A gerac¸˜ao de modelos de visualizac¸˜ao 3D a partir das sec¸˜oes 2D, possibilitaram o uso da t´ecnica de modelagem de isosurperf´ıcie e definic¸˜ao de um corpo de alta resistividade, consistente com modelos conceituais de dispers˜ao de hidrocarbonetos em subsuperf´ıcie. O diagn´ostico de uma regi˜ao com potencial ac´umulo de fase residual de hidrocarbonetos pode subsidiar o planejamento de t´ecnicas de remediac¸˜ao e propiciar a completa descontaminac¸˜ao da ´area.
Palavras-chave: contaminac¸˜ao, hidrocarbonetos, fase residual, fase dissolvida, tomografia el´etrica.
1Universidade Estadual Paulista – UNESP, Applied Geology Department, Geoscience and Exact Science Institute, Rio Claro Campus, 24-A Avenue, 1515, P.O. Box 178, 13506-900 S˜ao Paulo, SP, Brazil. Phone: +55(19) 3526-9313 – E-mail: moreirac@rc.unesp.br
2Universidade Estadual Paulista – UNESP, Geoscience and Environmental Science Post-graduation Program, Geoscience and Exact Science Institute, Rio Claro Campus, 24-A Avenue, 1515, P.O. Box 178, 13506-900 S˜ao Paulo, SP, Brazil. Phone: +55(19) 3526-2819 – E-mails: liviapihelene@gmail.com; ariane.rpc@gmail.com
i i
“main” — 2018/7/31 — 23:23 — page 6 — #2
i i
6
DC RESISTIVITY METHOD APPLIED IN THE MONITORING OF DIESEL LEAKAGE IN A RAILWAY ACCIDENT IN S˜AO MANUEL CITY, S˜AO PAULO STATE (BRAZIL)INTRODUCTION
Environmental contamination occurs as a result of lack of plan-ning following the economic development and inadequate man-agement of raw materials, products and hazardous waste at con-centrations that, above the recommendation values, pose health risks to the quality of life and to the environment.
Groundwater contamination by organic chemicals is a recur-ring issue. Given the variability in terms of density and solubility in water, when reaching the soil and the groundwater, they can form plumes of contamination and turn this resource not potable for human consumption. The most common organic compounds capable of causing environmental impacts are chlorinated sol-vents and short chain hydrocarbons.
The origin of the contamination of soil and water by hydrocar-bons usually occurs due to transport accidents, breakage of pipes or by improper storage. In the state of S˜ao Paulo, Brazil, contami-nated areas rose from 225 to 4.572 in a ten-year period. The main groups of contaminants found in these areas are the aromatic sol-vents, represented by the BTEX compounds (benzene, toluene, ethylbenzene and xylenes), the aromatic polycyclic hydrocarbons (PAH), the metals and the halogenated solvents (CETESB, 2012). For a long time, the contamination of soil and groundwater has been neglected by the difficulty of characterization. When in contact with the physical environment, the path and transport of organic contaminants can be modeled according to two stages. The first comprises all those that occur entirely above the ground-water level, in the vadose zone. The second considers the trans-port processes inside the aquifer, soluble/dissolved or insolu-ble/supernatant characterized by chemical analysis of water sam-ples from monitoring wells (Newell et al., 1995).
Diagnostic techniques through direct methods such as phys-ical and chemphys-ical analysis of samples are widely used in the diag-nosis of these areas, given the possibility of quantifying the lev-els in terms of concentration. Although, the main disadvantage of this procedure is its punctual and little representative character in spatial terms, in a condition where the analyzed object is mobile and dynamic.
Particularly considering past contamination by hydrocarbons which occurred several years ago, content changes due to dis-persion, dilution and degradation of the compounds by the ac-tion of various agents present in the geological environment are expected. The biodegradation of contaminants is one of the ma-jor mechanisms responsible for the consumption of contami-nants with long periods of residence in the environment (USEPA, 1998). The efficiency of this process depends on a combination of factors such as the presence of electrical receptors (O2, SO−42 ,
Fe+3, Mn+4, NO−3), appropriate conditions of pH, Eh, temper-ature and low levels of contamination (Ritmann, 2004; Adriano et al., 2004).
In many cases of contaminated sites with hydrocarbon there is a reduction on the concentration levels, independent of reme-dial action. The natural attenuation comprises a set of processes for the remediation in geological environments through the action of physical, chemical and biological processes. This process is especially important in the degradation of hydrocarbons, which may be converted by organisms found in nearly all environments (Mulligan & Yong, 2004).
Non-invasive geophysical investigation tools, have low cost and wide coverage in spatial and temporal terms, and have been used increasingly in recent years as diagnostic tools in the man-agement of contaminated sites (CETESB, 2001). Electrical geo-physical methods are particularly relevant in this type of research because of the frequent contrast of the physical properties between the contaminant and the uncontaminated soil or rock.
The degradation processes can cause some change in the electrical properties of the environment which allows the identi-fication and monitoring of contaminant in soil and groundwater. The hydrocarbons have high resistivity in the free phase; how-ever, factors such as the production of organic acids during the biodegradation cause a decrease in resistivity values. Several case studies involving electrical methods demonstrate the effec-tiveness, benefits and limitations when applied to the diagnosis and monitoring of contamination by hydrocarbons (Sauck, 2000; Batayneh, 2005; Moreira et al., 2006; Delgado-Rodr´ıguez et al., 2006; Menezes et al., 2011; Porci´uncula & Lima, 2012; Delgado-Rodr´ıguez et al., 2014; Veloso et al., 2015).
In face of the delineation possibility of the contaminants in soil and groundwater, the geophysical methods allows the un-derstanding of the evolution and persistence of hydrocarbon as a technique for monitoring the natural attenuation.
This work performs an analysis of geophysical and geochem-ical data from a benzene-contaminated area, currently under mon-itoring for natural attenuation processes, after a railway accident.
Behavior of hydrocarbons in soil and groundwater
Once the petroleum-derived hydrocarbons reach the ground, they can undergo evaporation or penetrate and reach the groundwater. When in contact with the groundwater, they are subject to dissolu-tion or they remain in the residual free phase, named non-aqueous phase liquids (NAPL – Non-Aqueous Phase Liquids), which can fill the pores of the soil so that they become a continuous source for the contamination of the aquifer (Newell et al., 1995).
Figure 1 – Conceptual modeling of natural attenuation processes that affect the fate of hydrocarbons in aquifers (Bekins et al., 2001).
Reaching the aquifer, the NAPLs are divided according to their density relative to water in light phase LNAPL (Light Non-Aqueous Phase Liquids) represented by compounds BTEX (Ben-zene, Toluene, Ethylbenzene and Xylenes) and dense phase DNAPL (Dense Non-Aqueous Phase Liquids), consisting on the group of polyaromatic hydrocarbons (PAH). The NAPLs com-pounds have great potential for contamination in soils and groundwater.
Without human intervention and under favorable environmen-tal conditions, organic compounds undergo a reduction in their mass, toxicity, volume and concentration through physical, chem-ical and biologchem-ical processes. This process of natural attenuation occurs in the saturated and unsaturated zone. These processes include, besides biodegradation, mechanisms of dispersion, di-lution, evaporation and adsorption (USEPA, 1998).
Dispersion and dilution of contaminants depend almost ex-clusively on the physical characteristics of the aquifer, such as hydraulic conductivity, which influences the transport of ground-water. This hydraulic conductivity, when high, increases the extent of contamination, but decreases the average concentration due to dilution (Fig. 1). Thus, at lower concentrations, microorganisms meet the most favorable environments for the performance of nat-ural degradation (Wilson & Jones, 1993; Gan et al., 2009).
Volatilization of compounds is relatively low, because the surface area between the contaminant on residual or dissolved phase with the atmosphere is small, and are often neglected in diagnostics. Several studies shows that less than 5% of the dis-solved phase of BTEX are converted into gas by volatilization (USEPA, 1998).
Other common destiny for contaminants are the pores of the soil matrix. Due to the hydrophobicity of the hydrocarbon molecules and to the mechanisms of sorption caused mainly by clay minerals, organic matter and iron and manganese oxides, these compounds tend to be trapped in these pores or in frac-tures of rocks at the surface (Thomas & Ward, 1989; Gan et al., 2009).
The affinity of the contaminant with the soil matrix may not be sufficient to isolate the contaminant from the permanent groundwater. The sorption does not remove the mass of contami-nant, it only retards the migration, and depending on the desorp-tion rate can contaminate groundwater again (Thomas & Ward, 1989; Wilson & Jones, 1993).
The main mechanism of natural attenuation of hydrocarbons in soil and groundwater is biodegradation, where microorganisms convert hydrocarbons to organic acids or promote the complete oxidation (mineralization). The generation of these acids in large amounts results in mineral dissolution and ion release to the sat-urated zone of the aquifer (Bennett & Siegel, 1987; Hiebert & Bennett, 1992; Moreira & Dourado, 2007).
This transformation is mainly limited by the availability of electron receptors and hydrocarbons that assume the role of elec-tron donors to the degradation, and therefore need to be biochem-ically accessible to microorganisms. Besides, other parameters such as pH, temperature, salinity and redox potential are also im-portant so that the biodegradation occurs (USEPA, 1998).
Under aerobic conditions, where dissolved oxygen is the elec-tron acceptor, the biodegradation is more effective and allows complete conversion of hydrocarbons into non-toxic products such as CO2, CH4and H2O.
i i
“main” — 2018/7/31 — 23:23 — page 8 — #4
i i
8
DC RESISTIVITY METHOD APPLIED IN THE MONITORING OF DIESEL LEAKAGE IN A RAILWAY ACCIDENT IN S˜AO MANUEL CITY, S˜AO PAULO STATE (BRAZIL)METHODOLOGY
Location and Accident History
The area is located in the farm named Ribeir˜ao do Para´ıso, rural area of S˜ao Manuel city, S˜ao Paulo State, Brazil, specifically at the kilometer 296 of the railway, between the cities of Rubi˜ao J´unior and Bauru (Fig. 2).
In December 1999 a derailment and overturning of three wag-ons carrying oil fuel occurred between the Rubi˜ao Junior and Bauru cities. About 240,000 liters of diesel leaked, contaminat-ing an area of approximately 30,000 m2(CETESB, 2006).
The first measures was the recovery and containment of the material retained on the surface. Large quantities of oil hit the groundwater and surface water, with contamination of the Igualdade creek, which supplies water to the S˜ao Manuel city (CETESB, 2006).
Probings and the installation of monitoring wells identified 0.3m to 1.0m sandy-clay soils, with presence of organic mat-ter, superimposed over fine sandstones belonging to Adamantina Formation, Bauru Group, of the Paran´a Sedimentary Basin.
Near the drainage, there are outcrops of Quaternary allu-vial sediments consisting of medium to coarse quartz sand. The
hydrogeological data show that the level of water table is shal-low, with a maximum depth of 2.9m in the higher topographic areas, and sub-outcropping near the drain. The permeability in-dicates a maximum hydraulic conductivity of 7,663× 10–4cm/s and minimum of 5,783× 10–5cm/s. The maximum calculated flow speed was 0.135m/d (CETESB, 2011).
The groundwater flow follows the local topography, from southeast to northwest, towards the Igualdade creek (Fig. 3).
The analytical results of the historical series of groundwa-ter monitoring at the accident site indicate the presence of BTEX compounds (Benzene, Toluene, Ethylbenzene and Xylene), espe-cially benzene with greater temporal persistence (Table 1).
RESULTS AND DISCUSSIONS
The geophysical data consisted of six lines of Electrical Resistivity Tomography (ERT), each 104m long, in a Wenner-Schlumberger arrangement with 2m spacing between electrodes, placed par-allel to the railway with 12.5m spacing between lines (Fig. 1). The positioning of the lines considered the latest geochemi-cal data available given by the monitoring of groundwater con-tamination as required by the environmental agency. These data
Figure 2 – Study area, with site, surface runoff, drainage channel under railway, lines of geophysical investigation and maximum
Figure 3 – Groundwater flow based on monitoring wells and location of the geophysical survey lines (based on CETESB, 2009).
Table 1 – Evolution of the benzene in aquifer (inµg/l) (CETESB, 2006 and 2011).
Well Date 11/2000 12/2003 08/2006 03/2008 10/2008 06/2009 11/2009 10/2010 03/2011 PM-01 <L.D <L.D. <L.D. <L.D. <L.D. <L.D. <L.D. * <5.0 PM-02 <L.D <L.D. <L.D. <L.D. <L.D. <L.D. <L.D. <5.0 * PM-03 <L.D <L.D. <L.D. <L.D. <L.D. <L.D. <L.D. <5.0 <5.0 PM-04 420 76 55.1 15 2.81 5.7 4.1 <5.0 5.8 PM-05 <L.D <L.D. <L.D. * * * * * * PM-06 — <L.D. <L.D. * <L.D. <L.D. <L.D. <5.0 <5.0 PM-07 — <L.D. <L.D. <L.D. <L.D. <L.D. <L.D. <5.0 <5.0 PM-08 — 350 20.1 3 28.2 <1.0 <L.D. ” <5.0 PM-09 — — <L.D. <L.D. <L.D. <L.D. <L.D. <5.0 <5.0 PM-10 — — 24.3 <L.D. <L.D. <L.D. <L.D. <5.0 <5.0 PM-11 — — <L.D. <L.D. <L.D. * * * * PM-12 — — <L.D. <L.D. <L.D. <L.D. <L.D. <5.0 <5.0
L.D.: Limit of detection. *Destroyed well.
describes the presence of benzene in maximum values of 5,8µg/l for dissolved phase in the well PM-04 (Table 1).
The resistivity data was processed in the software Res2dinv and presented in sections of electrical resistivity in terms of dis-tance and depth, with logarithmic graphical scale and intervals of interpolation of values in colors.
This program automatically determines a two-dimensional model of the subsurface. The 2D section divides the section into rectangular blocks, which will represent the
pseudo-section by the adjustment of the field measurements. This opti-mization aims to reduce the difference between the apparent re-sistivity values, calculated and measured in the field, by adjusting the resistivity of the block model, with the difference expressed by RMS (Root Mean Square) (Griffiths & Barker, 1993; Loke & Barker, 1996).
The inversion models were standardized on a single scale of values and colors, so that comparative analyzes of lines are permitted. The processed data reveal a range of values between
i i
“main” — 2018/7/31 — 23:23 — page 10 — #6
i i
10
DC RESISTIVITY METHOD APPLIED IN THE MONITORING OF DIESEL LEAKAGE IN A RAILWAY ACCIDENT IN S˜AO MANUEL CITY, S˜AO PAULO STATE (BRAZIL)17Ω.m and 1965Ω.m, with a predominance of high values in the near-surface portions and gradual reduction on values with in-creasing depth (Fig. 4).
The line 1 presented high and intermediate values close to the surface and a wide zone of low resistivity in depth. High re-sistivity values close to the surface are attributed to dry sandy soil whereas intermediate values are regions of moisture accu-mulation. The values below 60Ω.m predominates in depth, and are indicative of the saturated zone or highly degraded dissolved phase hydrocarbons, since in this region there was accumulation of diesel.
The line 2 was carried along the runoff channel where the flow of diesel leaked in the accident. Between 60m and 80m po-sitions the topsoil is extremely humid, characterized in the sec-tion by resistivity values between 260Ω.m and 511Ω.m. In depth, there are relatively higher values, between 511Ω.m and 750Ω.m and values below 60Ω.m only in the deeper portions. This in-crease in resistivity values and the proximity to the area with higher concentrations of hydrocarbons in the aquifer may be in-dicative of the presence of residual phase in intermediate condi-tions of degradation.
The lines 3 and 4 cross the area of greatest concentration of hydrocarbons in the residual phase, characterized by intervals with resistivity higher than 1000Ω.m at the central band in depth, which may be related to the presence of hydrocarbons in high concentrations in the soil and in the matrix of the saturated zone. Due to the polymeric architecture of the carbon and hydrogen atoms of the hydrocarbons, these compounds typically have high resistivity values. The existence of residual phase in the aquifer after 14 years from the leakage of diesel in the area is attributed to releases of hydrocarbons accumulated in the pores of the soil and saprolite, whose degradation allows their migration to the dissolved phase in the aquifer level.
The patterns of resistivity that characterize lines 5 and 6 are indicative of increasingly intensive action of the degradation pro-cesses, in face of the drop of resistivity values in the aquifer in-terval towards the line 6, positioned downstream of the place of accumulation of hydrocarbons. This gradual decrease in resis-tivity may yet indicate the more effective conversion of residual phase to the dissolved phase, besides the gradual return to the natural conditions of the area through the complete consumption of hydrocarbons by the action of natural attenuation processes.
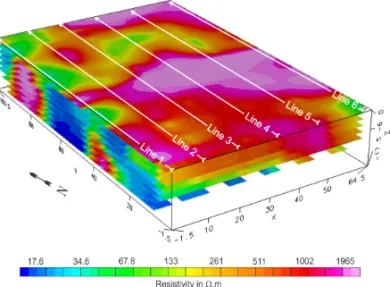
The data generated after the 2D inversion were gathered into a single file, later used as a database for generating 3D models and depth maps. This process was developed in the Oasis Montaj platform where 2D inversion results obtained from the Res2Dinv
program were interpolated and modeled using the kriging method, for enhancement of extreme values in a model of three-dimen-sional blocks, where ERT lines were positioned (Fig. 5).
Figure 5 – Model of the electrical resistivity, with location of the acquired lines. In sequence, the initial data were modeled by the minimum curvature method that smoothed the core values in relation to the limits of the investigated area, and then presented in maps or slices for various depths. The range of 1800Ω.m values was modeled as a 3D surface in an attempt to assess the shape of the high resistivity zone, where the unsaturated and saturated zone contact were also shown (Fig. 6).
The product of the 3D integration of 2D sections allows a clear view of the contaminant in the subsurface. The high resistivity values found on the surface, above the water table, demonstrate the behavior of the residual hydrocarbon in the unsaturated zone. The residual phase persists in the unsaturated zone in regions where there is probably slow renewal of oxygen and other elec-tron acceptors that trigger degradation.
In the saturated zone, however, the hydrocarbon is trapped in the soil pores, and the different permeabilities of the underlying layers created conditions for the hydrocarbon to take a conical and concentrated shape.
CONCLUSIONS
Fourteen years after the railway accident the results show the persistence of hydrocarbons in residual and dissolved phase in soil and groundwater. The history of geochemical data gath-ered from analyzes of groundwater reveals a decreasing trend in the levels of benzene for almost all the wells. However the well PM-04 shows a concentration reduction until 2008, followed by increasing values in the following years (2009 and 2011). Geo-physical lines 3 and 4, near well PM-04, presented the higher
i i
“main” — 2018/7/31 — 23:23 — page 12 — #8
i i
12
DC RESISTIVITY METHOD APPLIED IN THE MONITORING OF DIESEL LEAKAGE IN A RAILWAY ACCIDENT IN S˜AO MANUEL CITY, S˜AO PAULO STATE (BRAZIL)Figure 6 – 3D isosurface of 1800Ω.m, with saturated and unsaturated zone.
resistivity associated to hydrocarbons in residual phase in the aquifer (Fig. 2).
This indicates the action of natural attenuation processes, which result in various degrees of degradation of hydrocarbon in residual phase and sporadic release into the aquifer, in the form of dissolved phase compounds. In this sense, the input of the dissolved phase will definitely finish only after the complete consumption of the residual phase of hydrocarbon retained in the
pores of the aquifer.
The highest levels of dissolved hydrocarbon phases were characterized by high resistivity values (>1000Ω.m), indicative of the presence of high concentrations of residual phase, in face of the typical high resistivity of low degraded hydrocarbons. Similar patterns are described in the work of Cassidy et al. (2001), Menezes et al. (2011), Porci´uncula & Lima (2012), Delgado-Rodr´ıguez et al. (2014).
The integration of the 2D sections in 3D visualization pro-vides an accurate analysis of the current behavior of contami-nants in the area. The isosurface of 1800Ω.m resulted in a volume of high resistivity contrasting between unsaturated and saturated zone. The volume defined by the isosurface should represent ac-cumulations of remaining hydrocarbons present in dissolved and residual phase, after natural attenuation processes.
The integration of geochemical and the geophysical data en-abled a comprehensive and effective diagnosis for understanding the current situation of the contaminated area, and enabled the identification of priority sites for remedial action on the ground, something extremely difficult only from groundwater chemical analyzes. The 3D visualization models are particularly relevant as complementary procedure in monitoring contaminated ar-eas, given its similarity to conceptual models for hydrocarbon contamination in the soil.
The application of remediation techniques in places with high levels of residual phase should certainly accelerate the decontam-ination and extinguish the input of dissolved phase in the aquifer.
REFERENCES
ADRIANO DC, WENZELB WW, VANGRONSVELD J & BOLAN NS. 2004. Role of assisted natural remediation in environmental cleanup. Geoderma, 122(4): 121–142.
BATAYNEH AT. 2005. 2D Electrical Imaging of an LNAPL Contamina-tion, Al Amiriyya Fuel StaContamina-tion, Jordan. Journal of Applied Science, 5(1): 52–59.
BEKINS BA, RITTMANN BE & MacDONALD JA. 2001. Natural attenu-ation strategy for groundwater cleanup focuses on demonstrating cause and effect. Eos, Transactions, AGU, 82(5): 57–58.
BENNETT P & SIEGEL DI. 1987. Increased solubility of quartz in water due to complexing by organic compounds. Nature, 326: 684–686.
CASSIDY DP, WERKEMA JUNIOR DD, SAUCK W, ATEKWANA E, ROSSBACH S & DURIS J. 2001. The Effects of LNAPL Biodegradation Products on Electrical Conductivity Measurements. Journal of Environ-mental & Engineering Geophysics, 6(1): 47–52.
CETESB – Companhia de Tecnologia de Saneamento Ambiental. Se-cretaria do Meio Ambiente. 2001. Manual de Gerenciamento de ´Areas Contaminadas. S˜ao Paulo, Brazil. Available on:<http://www.cetesb.sp. gov.br/areas-contaminadas/manual-de-gerenciamento-de-ACs/7-ma-nual>. Access on: Dec. 01, 2015.
CETESB – Companhia de Tecnologia de Saneamento Ambiental. Ferro-ban-Ferrovias Bandeirantes S.A. 2006. Investigac¸˜ao complementar para avaliac¸˜ao de risco na ´area atingida por vazamento de combust´ıveis. S˜ao Manuel, S˜ao Paulo, Brazil.
CETESB – Companhia de Tecnologia de Saneamento Ambiental. Ferro-ban-Ferrovias Bandeirantes S.A. 2008. Fluxo e transporte de massa de contaminante e monitoramento de qualidade da ´agua subterrˆanea. S˜ao Manuel, S˜ao Paulo, Brazil.
CETESB – Companhia de Tecnologia de Saneamento Ambiental. Ferro-ban-Ferrovias Bandeirantes S.A. 2009. Monitoramento Hidrogeol´ogico. S˜ao Manuel, S˜ao Paulo, Brazil.
CETESB – Companhia de Tecnologia de Saneamento Ambiental. Ferro-ban-Ferrovias Bandeirantes S.A. 2011. Monitoramento Hidrogeol´ogico – 6a. campanha. S˜ao Manuel, S˜ao Paulo, Brazil.
CETESB – Companhia de Tecnologia de Saneamento Ambiental. Se-cretaria do Meio Ambiente. 2012. Relac¸˜oes de ´areas contaminadas e reabilitadas no Estado de S˜ao Paulo. S˜ao Paulo, Brazil. Avail-able on: <http://www.cetesb.sp.gov.br/areas-contaminadas/manual-de-gerenciamento-de-ACs/7-manual>. Access on: Dec. 01, 2015. DELGADO-RODR´IGUEZ O, SHEVNIN V, OCHOA-VALD´ES J & RYJOV A. 2006. Geoelectrical characterization of a site with hydrocarbon contamination caused by pipeline leakage. Geof´ısica Internacional, 45(1): 63–72. Available on: <http://www.scielo.org.mx/pdf/geoint/ v45n1/v45n1a4.pdf>. Access on: Dec. 01, 2015.
DELGADO-RODR´IGUEZ O, FLORES-HERN´ANDEZ D, AMEZCUA-ALLIERI MA, SHEVNIN V, ROSAS-MOLINA A & MAR´IN-C ´ORDOVA S. 2014. Joint interpretation of geoelectrical and volatile organic com-pounds data: a case study in a hydrocarbons contaminated urban site. Geof´ısica Internacional, 53(2): 183–198. Available on: <http://www. scielo.org.mx/pdf/geoint/v53n2/v53n2a6.pdf>. Access on: Dec. 01, 2015.
GAN S, LAU EV & NG HK. 2009. Remediation of soils contaminated with polycyclic aromatic hydrocarbons (PAHs). Journal of Hazardous Materials, 172: 532–549.
GRIFFITHS DH & BARKER RD. 1993. Two-dimensional resistivity imag-ing and modelimag-ing in areas of complex geology. Journal of Applied Geo-physics, 29(2): 211–226.
HIEBERT FK & BENNETT PC. 1992. Microbial control of silicate weath-ering in organic-rich ground water. Science, 258: 278–281.
LOKE MH & BARKER RD. 1996. Rapid least-squares inversion of ap-parent resistivity pseudosections by quasi-Newton method. Geophysical Prospecting, 44: 131–152.
MOREIRA CA & DOURADO JC. 2007. Monitoramento da atenuac¸˜ao na-tural de pluma de contaminac¸˜ao pelo m´etodo de radar de penetrac¸˜ao no solo (GPR). Brazilian Journal of Geophysics, 25(4): 389–398. Available on:<http://www.scielo.br/pdf/rbg/v25n4/a03v25n4.pdf>. Access on: Dec. 01, 2015.
MOREIRA CA, DOURADO JC & BRAGA ACO. 2006. Aplicac¸˜ao da t´ec-nica de caminhamento el´etrico em ´area contaminada por derivados de petr´oleo. Brazilian Journal of Geophysics, 24(3): 383–392. Available on:<http://www.scielo.br/pdf/rbg/v24n3/a07v24n3.pdf>. Access on: Dec. 01, 2015.
i i
“main” — 2018/7/31 — 23:23 — page 14 — #10
i i
14
DC RESISTIVITY METHOD APPLIED IN THE MONITORING OF DIESEL LEAKAGE IN A RAILWAY ACCIDENT IN S˜AO MANUEL CITY, S˜AO PAULO STATE (BRAZIL)MENEZES AM, MOREIRA CA, ILHA LM & SCHWEIG C. 2011. Estudo geof´ısico de vazamento de combust´ıveis em posto de abastecimento. Geociˆencias, 30(4): 601–609. Available on: <http://www.revistageociencias.com.br/geociencias-arquivos/30 4/ Art 08 Menezes et al.pdf>. Access on: Dec. 01, 2015.
MULLIGAN CN & YONG RN. 2004. Natural attenuation of contaminated soils. Environment International, 30(4): 587–601.
NEWELL CJ, ACREE SA, ROSS RR & HULLING SG. 1995. Light Non-aqueous Phase Liquids. Environmental Protection Agency, EPA/540/S-95/500. Available on:<http://www.epa.gov/superfund/remedytech/tsp/ download/lnapl.pdf>. Access on: Dec. 01, 2015.
PORCI ´UNCULA RJ & LIMA OAL. 2012. Geoelectric evaluation of sub-surface contamination at a gas and service station, Alagoinhas, BA, Brazil. Brazilian Journal of Geophysics, 30(2): 201–212. Available on: <http://www.sbgf.org.br/revista/index.php/rbgf/article/view/108/49>. Access on: Dec. 01, 2015.
RITMANN BE. 2004. Definition, Objectives, and Evaluation of Natural Attenuation. Biodegradation, 15(6): 349–357.
SAUCK WA. 2000. A model for the resistivity structure of LNAPL plumes and their environs in sandy sediments. Journal of Applied Geophysics, 44: 151–165.
THOMAS JM & WARD CH. 1989. In situ biorestoration of organic contaminants in the subsurface. Environment Science Technology, 23: 760–766.
USEPA. 1998. Technical Protocol for evaluating natural attenuation of chlorinated solvents in ground water. EPA/600/R-98/128. Available on: <http://www.epa.gov/osw/hazard/correctiveaction/resources/guidance/ rem eval/protocol.pdf>. Access on: Dec. 01, 2015.
USEPA. 1999. Use of monitored natural attenuation at Superfund, RCRA corrective action, and Underground Storage Tank sites. Office of Solid Waste and Emergency Response. Directive 9200. Chapter IX Moni-tored Natural Attenuation. 4–17. Available on: <http://www.epa.gov/ oust/directiv/d9200417.pdf>. Access on: Dec. 01, 2015.
VELOSO DIK, MOREIRA CA & C ˆORTES ARP. 2015. Integration of geo-electrical methods in the diagnostic of a diesel contaminated site in Santa Ernestina (SP, Brazil). Brazilian Journal of Geophysics, 33(4): 667–676.
WILSON SC & JONES KC. 1993. Bioremediation of soils contaminated with Polynuclear Aromatic Hydrocarbons (PAHs): a review. Environmen-tal Pollution, 81: 229–249.
Recebido em 18 agosto, 2015 / Aceito em 24 maio, 2017 Received on August 18, 2015 / Accepted on May 24, 2017