Review of the Marital Satisfaction
Scale’s Factor Structure
José Augusto Evangelho Hernandez
1, *Camila Morais Ribeiro
11
Universidade do Estado do Rio de Janeiro, Rio de Janeiro, RJ, Brasil
Ana Lúcia Novais Carvalho
22
Universidade Federal Fluminense, Niterói, RJ, Brasil
Regina Coeli Tannus Fonseca
33
Faculdade Salesiana Maria Auxiliadora, Macaé, RJ, Brasil
Raphael Fischer Peçanha
44
Universidade Estácio de Sá, Rio de Janeiro, RJ, Brasil
Eliane Mary de Oliveira Falcone
11
Universidade do Estado do Rio de Janeiro, Rio de Janeiro, RJ, Brasil
Abstract
Marital satisfaction is a construct that is relevant to psychology research due to its signifi cance in terms of establishing this interpersonal relationship. The present study examines the factor structure of the Marital Satisfaction Scale (MSS). The MSS has frequently been employed in Brazilian studies, incorpo-rated as a convergent measure for producing criterion validity evidence in the elaboration of new psy-chometric methods. Nonetheless, its psypsy-chometric properties have not been substantiated for 25 years. A non-probabilistic sample of 249 people from Rio de Janeiro participated in the present study, their ages ranging between 21 and 77 years (M = 45.3; SD = 13.26). They had been married or involved in a civil
union (also known as a “domestic partnership” or “common-law marriage” depending on the location)
for an average of 19.5 years (SD = 12.88). The collected data was assessed via exploratory and confi rma-tory factor analyses. Such assessment revealed several items exhibiting poor psychometric performance. Nevertheless, an abridged version of the MSS provided simplicity and produced excellent fi t indices. It also yielded validity evidence of the existence of a second-order factor. The estimated reliability for both the factors and the entire scale ranged between 0.85 and 0.93.
Keywords: Marital satisfaction, marital relationship, psychometric properties.
Revisão da Estrutura Fatorial da Escala
de Satisfação Conjugal
Resumo
A satisfação conjugal é um construto relevante para o estudo na Psicologia, dada sua importância no desenvolvimento deste relacionamento interpessoal. Esta investigação revisou a estrutura fatorial da Escala de Satisfação Conjugal (ESC). A ESC, frequentemente, tem sido utilizada na pesquisa brasileira, inclusa como medida convergente para gerar evidências de validade de critério no desenvolvimento de novas medidas psicológicas. Por outro lado, suas propriedades psicométricas não são verifi cadas há 25
1 Mailing address: Rua São Francisco Xavier, 524, 10° andar, sala 10028D, Maracanã, Rio de Janeiro, RJ, Brazil
anos. Participou deste estudo uma amostra não probabilística de 249 pessoas do Rio de Janeiro, com idades entre 21 e 77 anos (M = 45,3; DP = 13,26), casadas ou em uniões estáveis há 19,5 anos em média (DP = 12,88). Os dados coletados foram submetidos às Análises Fatorial Exploratória e Confi rmatória. O exame revelou alguns itens com desempenhos psicométricos insatisfatórios. Contudo, uma versão reduzida da ESC apresentou simplicidade e índices de ajuste estimados muito bons. Evidências de vali-dade da existência de um fator de segunda ordem também foram produzidas. A fi dedignidade estimada para os fatores e a escala toda variou de 0,93 a 0,85.
Palavras-chave: Satisfação conjugal, relação conjugal, propriedades psicométricas.
Revisión de la Estructura Factorial de la Escala
de Satisfacción Marital
Resumen
La satisfacción marital es un constructo relevante para el estudio de la psicología, dada su importancia en el desarrollo de esta relación íntima. Esta investigación examinó la estructura factorial de la Escala de Satisfacción Marital (MSS). El MSS menudo se ha utilizado en la investigación brasileña, incluso como medida para generar criterio de validez convergente en el desarrollo de nuevas medidas psicológicas. Por otro lado, las propiedades psicométricas no se examinan hace 25 años. Participaron en este estudio una muestra no probabilística de 249 personas de Río de Janeiro, 21-77 años de edad (M = 45.3, DE = 13.26), casadas o en unión estable con 19,5 años de media (DE = 12.88). Los datos fueron sometidos a un análisis factorial exploratorio y confi rmatorio. El examen reveló algunos ítem s con actuaciones psicométricas pobres. Sin embargo, una versión reducida de la MSS presentó sencillez y los índices de ajuste estimados muy buenos. También se produjeron evidencia de la validez de la existencia de un fac-tor de segundo orden. La fi abilidad estimada para los factores y la escala completa variaron desde 0.93 hasta 0.85.
Palabras clave: Satisfacción marital, relación matrimonial, propriedades psicométricas.
The present study assessed the factor struc-ture of the Brazilian version of Pick de Weiss and Andrade Palos’ (1988a) Marital Satisfaction Scale (MSS) (Dela Coleta, 1989). In Brazilian psychology research, this scale has even been used as a convergent measure to provide crite-rion validity evidence for recently established measurement standards (1988a). Nonetheless, ever since the MSS was adapted (over 25 years ago), no assessments of the scale’s psychometric status have appeared in the literature (1988a).
Marital satisfaction is a subject that receives broad coverage in the scientifi c literature of the
fi eld of Psychology. Individuals that are
satis-fi ed with their marriages exhibit better health than those who are disappointed with their re-lationships do (Gottman & Silver, 2000). One issue that strongly stands out is the connection between marital satisfaction, happiness and
increasing or decreasing a couple’s marital sat-isfaction, depending upon each particular case.
Pick de Weiss and Andrade Palos (1988a) viewed marital satisfaction as a series of attitudes in relation to factors associated with spouses and marital interactions. These authors advocated the need to establish Mexico’s own marital satis-faction scale in light of the fact that most of the existing scales employed global satisfaction cri-teria and in general represented the Anglo-Saxon culture. They thus created a marital satisfaction scale (MSS) based on the Hispanic culture.
The preliminary study aimed at developing the Hispanic MSS version involved the partici-pation of 330 married individuals (176 women and 154 men) with the following averages: age, 36.3 years; length of the marriage, 13.9 years; and number of children, 3.1 (Pick de Weiss & Andrade Palos, 1988a). After analyzing the fre-quencies of the MSS participants’ scores, 37 items were chosen that, when subjected to Prin-cipal Component Analysis (PCA) with oblique rotation, had led to six factors with eigenvalues > 1.0, which explained 58.1% of the total vari-ance. Employing conceptual criteria, the fi rst three factors that accounted for 47.8% of the total variance were retained and 14 items were excluded. Based on an analysis of the content of the remaining 23 items, the following factors were selected:
1. Satisfaction with Marital Interaction (SMI), which denotes the individual’s satisfaction with respect to the relationship with her/his partner;
2. Satisfaction with Emotional Aspects (SEA), which refers to the individual’s satisfaction with his/her partner’s emotional reactions (e.g., how the partner expresses feelings and behaves when angry or nervous); and 3. Satisfaction with Structural Aspects (SSA),
which relates to the individual’s satisfaction with his/her partner’s way of organizing, establishing and complying with rules (e.g., how the partner organizes his/her own life) and its impact on the individual’s life. The second study (Pick de Weiss & An-drade Palos, 1988a) enjoyed the participation of 244 married individuals (139 women and 105
men) from Mexico City with the following aver-ages: age, 31.5 years; length of the marriage, 8.7 years; and number of children, 1.7. Eleven new items were added to the 23 previously selected MSS items (the reason for this inclusion was not given). The researchers conducted a second PCA with oblique rotation and extracted seven factors with eigenvalues > 1.0, which explained 49.7% of the total variance. Aiming at concep-tual clarity, the researchers retained the fi rst three extracted factors that accounted for 45.7% of the total variance. The rotated matrix of the factor loadings of the items was not presented in the results, but 10 items were excluded and the MSS came to be made up of 24 items distributed among three factors. The alphas obtained for the factors were 0.90 for SMI (10 items), 0.81 for SEA (5 items), and 0.85 for SSA (9 items).
Noteworthy statistical connections (p < .05) between MSS subscales and several sociodemo-graphic variables were discovered (Pick de Weiss & Andrade Palos, 1988a, 1988b, 1988c). Males exhibited mean scores > those of females with respect to SMI and SSA. People with the short-est relationships (one to two years) displayed SMI levels > those of people with relationships of 16 or more years. In general, individuals with three or more children exhibited SMI, SEA, and SSA levels that were lower than were those of people with one, two, or no children. The higher the educational level of the participant, the high-er the SMI scores whigh-ere. The individuals’ ages did not display a statistically signifi cant connec-tion with any of the three MSS subscales.
the Brazilian version, the data collected in the MSS was subjected to PCA with varimax rota-tion. A fi ve-factor solution with eigenvalues > 1.0 was extracted, which explained 57.2% of the total variance. The items loaded in the fourth and
fi fth factors were allocated in the original three-factor structure based on the content of the same and on the scree plot.
A PCA with varimax rotation for three fac-tors was then performed, accounting for 48.3% of the total variance. Nonetheless, three items from the SSA subscale (“The way my spouse spends his/her spare time,” “The time we spend together,” and “The rules my spouse establishes to be followed at home”) and one item from the SEA subscale (“How my spouse reacts when I don’t want to have sex”) exhibited greater satu-ration with respect to SMI. The author recom-mended that future studies check the possibility both of reallocating these items where they were more saturated and of redefi ning the confi gura-tion of each one of the MSS’s three dimensions. Furthermore, the correlations between the three factors as well as the internal consistency
coef-fi cients obtained for them led her to consider a general marital satisfaction scale (Dela Coleta, 1989).
PCA was the extraction method employed to elaborate (Pick de Weiss & Andrade Palos, 1988a) and adapt (Dela Coleta, 1989) the MSS. Although it is not an authentic factor-analysis technique, it is found in the most popular statis-tics packages as the default extraction method, which could partially explain its indiscriminate use. PCA does not distinguish common vari-ance between factors from total varivari-ance; and, in certain situations, it could overestimate the vari-ance explained by the components (Costello & Osborne, 2005; Ferrando & Anguiano-Carrasco, 2010). A considerable amount of the psychomet-ric research published in major psychology jour-nals still employs Principal Component Analysis (PCA) inappropriately to conduct exploratory tasks (Conway & Huffcutt, 2003; Gaskin & Happell, 2014; Henson & Roberts, 2006; Left, Olea, & Abad, 2014).
Exploratory Factor Analysis (EFA) is more appropriate than PCA for preparing and
validat-ing psychological tests. This method examines latent variables and common factors that ex-plain research subjects’ responses to the items of a psychological survey (Damásio, 2012; Fer-rando & Anguiano-Carrasco, 2010; Izquierdo et al., 2014; Laros, 2005; Lloret-Segura, Ferreres-Traver, Hernández-Baeza, & Tomás-Marco, 2014).
The Brazilian adaptation of the Hispanic MSS (Dela Coleta, 1989) employed an orthogo-nal rotation. Currently, the use of oblique rota-tions, independent of theoretical presumptions as to the relationships between the constructs, is recommended. This recommendation is based on the fact that perfect orthogonal relationships cannot be found in Psychology (Lloret-Segura et al., 2014).
Traditional decision-making approaches to factor retention (eigenvalues and scree plots) are currently considered unsatisfactory (Loren-zo-Seva, Timmerman, & Kiers, 2011). Parallel Analysis has consistently exhibited greater pre-cision than conventional methods have for guid-ing factor-retention decisions (Gaskin & Hap-pell, 2014).
Dela Coleta’s criterion (1989) for selecting the items for each factor in a rotated factor ma-trix was that the item’s loading had to be > 0.30. Nevertheless, this criterion took into consider-ation the principal loadings alone, to the detri-ment of the values of associated saturations in other factors. Seven items with cross-loadings were detected. Lacking theoretical justifi cations for retaining such items in the MSS, they can be excluded or rephrased (Hair, Black, Babin, An-derson, & Tatham, 2009).
In order to check the status of MSS use in Brazilian studies, a bibliographic examination of the Literatura Latino-Americana e do Caribe
em Ciências da Saúde (LILACS) and Scientifi c
Coleta, 1992; Oliveira, Falcone, & Ribas, 2009; Ribeiro, Pinho, & Falcone, 2011; Sardinha, Fal-cone, & Ferreira, 2009; Sbicigo & Lisboa, 2009; Comin & Santos, 2011a; Scorsolini-Comim & Santos, 2011b; Villa & Del Prette, 2013). These articles brought to light the fact that, subsequent to the MSS’s Brazilian adapta-tion (Dela Coleta, 1989), no research aimed at examining the MSS’s psychometric features was conducted.
In light of this situation, the present study aimed to discover evidence of structural validity with respect to the scale’s scores nowadays, em-ploying statistical methods currently advocated by psychometric researchers (Gaskin & Happell, 2014; Izquierdo et al., 2014; Lloret-Segura et al. Al., 2014). What is the MSS’s psychometric sta-tus today? This is the question the present study sought to answer.
Method
Participants
We assessed the MSS scores of a conve-nience sample of 249 individuals from the state of Rio de Janeiro; it consisted of 151 women (60.6%) and 98 men (39.4%), with ages ranging between 21 and 77 years, an average age of 45.3 years and a standard deviation of 13.26 years. All of these individuals lived together with their spouses and were involved in a marital relation-ship, a marriage or a civil union (also known as a “domestic partnership” or “common-law mar-riage” depending on the location). The length of their relationships varied between 1 and 51 years, with an average duration of 19.5 years and a standard deviation of 12.88 years. Of the total sample (249 participants), 225 (90.4%) stated that they were going through their fi rst riage; and 24 of them (9.6%), their second mar-riage. The number of children declared by the examinees ranged from 0 to 7, with a mean of 1.7 and a standard deviation of 1.11. Of the to-tal, 44 (17.7%) had no children, 55 (22.1%) had only one, 103 (41.4%) had two, 37 (14.9%) had three, eight 3.2%) had four, one (0.4%) had fi ve and one (0.4%) had seven. 149 (59.8%) of the
sample’s 249 participants declared they had a university degree, 33 (13.3%) had an incomplete university education, 54 (21.7%) had graduated from high school, 9 (3.6%) had not fi nished high school, 3 (1.2%) had fi nished elementary school, and 1 (0.4%) did not provide this data.
Instrument
Dela Coleta’s Brazilian version (1989) of the Marital Satisfaction Scale (MSS) created by Pick de Weiss and Andrade Palos (1988a) was examined. The MSS provides a general Marital Satisfaction (MS) measurement consisting of three factors or dimensions:
1. Satisfaction with Marital Interaction (SMI), featuring 10 items, which denotes the indi-vidual’s satisfaction with respect to the rela-tionship with her/his partner;
2. Satisfaction with Emotional Aspects (SEA), featuring fi ve items, which refers to the in-dividual’s satisfaction with his/her partner’s emotional reactions; and
3. Satisfaction with Structural Aspects (SSA), featuring nine items, which measures the individual’s satisfaction with his/her partner’s way of organizing, establishing and complying with rules and its impact on the individual’s life. All 24 items were rated using a three-point Likert scale: (1) “I wish it were really different”; (2) “I wish it were a bit different”; and (3) “I like the way it has been”.
Data Collection
This project was approved (via decision no. 096/2011) by the Ethics Committee of the insti-tution with which the present study is associated. The individuals that were invited to participate in the study received complete information as to its objectives and signed an informed consent form. In most cases, the data was collected at the participants’ homes. We gained access to these individuals via referrals or snowball sampling. Some of them answered the MSS questionnaire in the presence of the researchers; the others
Data Analysis
Analysis of MSS score distribution revealed asymmetries of -1.325 to 0.110 and a kurtosis of -1.276 to 0.764; no extreme values were
identi-fi ed. Mardia’s multivariate normality test (1970) yielded 50.12 (c.r. = 14.74). Since responses to the MSS are made via a three-point Likert scale, we opted for using a polychoric correlation ma-trix (Dominguez Lara, 2014).
The data was analyzed with the Factor 10.3.01 program (Lorenzo-Seva & Ferrando, 2015) by means of Exploratory Factor Analy-sis (EFA) using the Unweighted Least Squares (ULS) estimation method and direct oblimin ro-tation. In order to determine the number of fac-tors to be extracted, we used Parallel Analysis based on Minimum Rank Factor Analysis (Tim-merman & Lorenzo-Seva, 2011).
With the aim of confi rming the existence of a supposed second-order factor (Dela Co-leta, 1989), the factor-loading matrix was also subjected to Hierarchical Factor Analysis, the Schmid and Leiman solution (SSL, 1957). The SSL, which is a transformation of the matrices of factor loadings obtained in the fi rst-order factor analysis, furnished additional information dem-onstrating the fi rst- and second-order factors’ infl uence (in an independent, non-superimposed manner) on the observed variables (Wolff & Preising, 2005).
The MSS’s original structural model (Dela Coleta, 1989) – with 24 items, three fi rst-order factors and one second-order dimension – was also tested, by way of Confi rmatory Factor Analysis (CFA) with Maximum Likelihood Es-timation (MLE) and bootstrap replication, in the AMOS 18 app (Arbuckle, 2009). Seeking struc-tural adequacy, we employed the following indi-ces: the global fi t of the model (χ²/df ratio, which according to Byrne (2000) should be > 2.0 to de-note a good fi t); the Goodness of Fit Index (GFI) of covariances between the variables detected by the model and the Comparative Fit Index (CFI) – both of which should exhibit values between 0.90 and 0.95 for a good fi t (Marôco, 2014); the Root Mean Square Error of Approximation (RMSEA), which tests the fi t between the model tested and a model saturated with the same data
– the index should be < 0.08 for an acceptable fi t and < 0.05 for a very good fi t (Marôco, 2014); and the Akaike Information Criterion (AIC) and the Consistent Akaike Information Criterion (CAIC), which are used in the comparison and penalize a model’s complexity – the model ex-hibiting the lowest amounts has the best fi t (By-rne, 2010).
Results
The Exploratory Factor Analysis employing the ULS estimation method and direct oblimin rotation revealed a solution of fi ve factors with eigenvalues > 1.0. On the other hand, the Par-allel Analysis based on Minimum Rank Factor Analysis (Timmerman & Lorenzo-Seva, 2011) indicated the retention of three factors. In the factor matrix of the new EFA for three factors, we identifi ed several structural problems that were incompatible with the original model (Pick de Weiss & Andrade Palos, 1988a). We noticed that the item “The time my spouse dedicates to our marriage” displayed a factor loading of 0.19 for the SMI dimension (for which it was desig-nated), -0.04 for SEA, and 0.67 for SSA. The SMI item “My spouse’s behavior in the pres-ence of other people” exhibited factor loadings of 0.06 for SMI, 0.32 for SEA, and 0.30 for SSA. The SMI item “The time my spouse devotes to me” was saturated with loadings of 0.33 for SMI, 0.01 for SEA, and 0.59 for SSA. The SEA item “My spouse’s reaction when I don’t want to have sex” exhibited loadings of 0.34 for SEA, -0.05 for SSA, and 0.36 for SMI. The SSA item “The time we spend together” exhibited satura-tions of 0.38 for SSA, 0.07 for SEA, and 0.32 for SMI. The SSA item “The way my spouse seeks to solve problems” displayed loading saturations of 0.46 for SSA, 0.34 for SEA, and 0.16 for SMI.
The six items above were excluded ac-cording to Hair et al. (2009), and another EFA (employing the same method as above) was con-ducted with respect to the remaining 18 items. The KMO test yielded a value of 0.85 (con-sidered good), and the Bartlett Sphericity Test produced the values χ² (153) = 1,463.90 and p
suit-Table 1
Polychoric Correlation Matrix of MSS Items
Items 2 3 4 5 6 8 9 11 12 13 14 15 16 17 19 20 21 24
2 1.00
3 0.51 1.00
4 0.73 0.39 1.00
5 0.54 0.32 0.39 1.00
6 0.61 0.62 0.54 0.42 1.00
8 0.37 0.39 0.55 0.23 0.45 1.00
9 0.35 0.34 0.29 0.22 0.35 0.18 1.00
11 0.19 0.37 0.24 0.09 0.49 0.34 0.34 1.00
12 0.30 0.42 0.26 0.20 0.44 0.34 0.40 0.80 1.00
13 0.26 0.34 0.22 0.25 0.40 0.23 0.30 0.73 0.72 1.00
14 0.38 0.46 0.36 0.21 0.49 0.28 0.26 0.65 0.76 0.63 1.00
15 0.31 0.24 0.06 0.31 0.21 0.15 0.32 0.13 0.17 0.15 0.20 1.00
16 0.36 0.40 0.24 0.28 0.47 0.29 0.39 0.26 0.23 0.19 0.20 0.60 1.00
17 0.31 0.43 0.18 0.25 0.44 0.23 0.38 0.29 0.33 0.28 0.28 0.36 0.65 1.00
19 0.24 0.27 0.08 0.25 0.20 0.08 0.11 0.20 0.22 0.14 0.20 0.38 0.26 0.19 1.00
20 0.24 0.08 0.21 0.16 0.24 0.06 0.46 0.21 0.23 0.19 0.33 0.26 0.30 0.28 0.23 1.00
21 0.45 0.55 0.51 0.42 0.57 0.47 0.28 0.39 0.35 0.38 0.37 0.25 0.38 0.38 0.28 0.23 1.00
24 0.35 0.41 0.22 0.13 0.30 0.26 0.30 0.36 0.37 0.31 0.37 0.42 0.42 0.39 0.20 0.27 0.47 1.00
Table 2
Parallel Analysis based on Minimum Rank Factor Analysis
Variables % Variance
Current Data Random Average Random 95th Percentile
1 41.5** 11.5 12.8
2 11.7** 10.5 11.5
3 9.7* 9.6 10.6
4 6.0 8.9 9.6
Note. Results obtained from 500 random polychoric correlation matrices [raw data permutation method] (Buja & Eyuboglu, 1992). ** Number of factors recommended when 95th percentile is considered. * Number of factors recommended when mean
is considered.
ability for factor analysis. The polychoric cor-relation matrix of the items can be seen in Table 1. We extracted fi ve factors with eigenvalues > 1.0. Parallel Analysis based on Minimum Rank Factor Analysis (Timmerman & Lorenzo-Seva, 2011) upheld the suggestion to retain three fac-tors (Table 2).
reli-ability for all factors and the global scale (MSS) varied between 0.85 and 0.93 (Table 3).
Bentler’s Simplicity Index (1977) was 0.99 (100th percentile) and the Loading Simplicity Index (Lorenzo-Seva, 2003) was 0.52 (100th percentile). Such values pointed to the fact that
each item mainly represents a single dimension, and the global solution displayed a high level of simplicity. The Root Mean Square of Residuals (RMSR) was 0.0520, while the average value expected for an acceptable model is ≤ 0.0635, according to Kelley’s criterion (1935).
Table 3
Factor Loadings of EFA with Direct Oblimin Rotation of MSS Items and Communalities
Items SSA SMI SEA h2
16 My spouse’s priorities in life 0.82 0.06 -0.06 0.69
15 The way my spouse organizes his/her life and things 0.77 -0.08 -0.06 0.52
17 The way my spouse spends her/his time 0.60 0.04 0.13 0.45
24 The rules my spouse establishes to be followed at home 0.44 0.06 0.24 0.36
09 The time my spouse dedicates to him/herself 0.39 0.09 0.21 0.31
20 How my spouse cares for her/his own health 0.37 0.01 0.15 0.19
19 My spouse’s punctuality 0.35 0.03 0.07 0.16
04 The frequency with which my spouse hugs me -0.15 0.93 -0.03 0.76
02 The frequency with which my spouse says something nice to me 0.16 0.77 -0.06 0.67
06 The communication with my spouse 0.16 0.57 0.24 0.62
08 The way my spouse asks me to have sexual relations -0.01 0.51 0.14 0.34
21 My spouse’s interest in what I do 0.29 0.50 0.17 0.51
05 The attention my spouse pays to my appearance 0.21 0.47 -0.07 0.31
03 How well my spouse takes care of me 0.22 0.43 0.22 0.47
12 How my spouse behaves when upset 0.01 -0.02 0.92 0.84
11 How my spouse behaves when sad -0.01 -0.05 0.91 0.79
13 How my spouse behaves when worried -0.01 0.01 0.79 0.62
14 How my spouse behaves when in a bad mood -0.01 0.14 0.73 0.63
Explained Variance 2.75 3.08 3.41
Variance Percentage (%) 29.8 33.3 36.9
Estimated Reliability 0.84 0.89 0.93
Correlations between Factors
F2 0.42
F3 0.36 0.41
Note. Unweighted Least Squares extraction method. In bold, the strongest factor loadings of items on factors.
In Table 4 (SSL results), one can notice such direct connections (factor loadings) between the observed variables, the fi rst-order (SEA, SMI and SSA) and second-order (G1) factors, in an independent manner. In the analysis of the SSL
and 20 are exceptions: the former reveals satura-tions that are insuffi cient to represent the specif-ic (SSA) and general dimensions; and the latter
displays an SSA factor loading that is lower than the minimum acceptable to represent its specifi c dimension, whereas its G1 loading is suffi cient to represent the general dimension.
Table 4
SSL Factor Loadings for First- and Second-Order MSS Factors
Items SSA SMI SEA G1
16 My spouse’s priorities in life 0.66 0.04 -0.04 0.50
15 The way my spouse organizes his/her life and things 0.61 -0.06 -0.05 0.37
17 The way my spouse spends her/his time 0.48 0.03 0.10 0.46
24 The rules my spouse establishes to be followed at home 0.35 0.04 0.19 0.45
09 The time my spouse dedicates to him/herself 0.31 0.06 0.17 0.42
20 How my spouse cares for her/his own health 0.29 0.01 0.12 0.31
19 My spouse’s punctuality 0.28 0.02 0.06 0.28
04 The frequency with which my spouse hugs me -0.12 0.67 -0.03 0.53
02 The frequency with which my spouse says something nice to me 0.13 0.55 -0.05 0.59
06 The communication with my spouse 0.13 0.41 0.19 0.63
08 The way my spouse asks me to have sexual relations -0.01 0.37 0.11 0.43
21 My spouse’s interest in what I do 0.17 0.36 0.13 0.57
05 The attention my spouse pays to my appearance 0.16 0.34 -0.05 0.41
03 How well my spouse takes care of me 0.18 0.31 0.18 0.56
12 How my spouse behaves when upset 0.01 -0.01 0.74 0.54
11 How my spouse behaves when sad -0.01 -0.04 0.73 0.50
13 How my spouse behaves when worried -0.01 0.01 0.63 0.47
14 How my spouse behaves when in a bad mood -0.01 0.10 0.58 0.53
G1 MSStotal 0.60 0.69 0.60
Note. G1= Global Dimension. In bold, the strongest factor loadings of items on specifi c factors and overall factor.
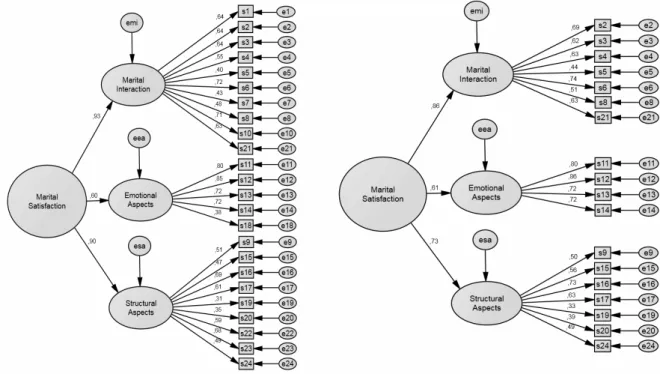
Seeking to corroborate the results obtained through the exploratory analysis, the original (24 items) and condensed (18 items) MSS models – both of which possess one second-order dimension and three fi rst-order dimensions – were tested and compared via CFA (Figure 1). Considering the estimated indices, the values of the reduced model evidence a better fi t than those of the original model (Table 5).
]The Pearson Correlation Coeffi cient re-vealed no statistically signifi cant connections between the factors SMI, SEA, SSA & MSStotal and the length of the relationships or ages of the
participants. In contrast, signifi cant negative cor-relations between the ages (r = -0.20, p < .01), the lengths of the relationships (r = -0.16, p < .05) and the SMI factors were observed for the female participants.
Figure 1. Diagrams of the original and abridged MSS models compared with their standardized estimations, respectively.
those with only one child did. The effect sizes were d = 0.62 and d = 0.56, respectively. No noteworthy differences between the other groups were observed; and (b) As regards SSA, there was a considerable difference between the group of participants with three or more children (M = 2.45, SD = 0.44) and the group of those with only one child (M = 2.20, SD = 0, 52). Individuals with three or more children were more satisfi ed with their spouses’ way of organizing, establish-ing, and complying with rules than participants with only one child were. The effect size was d
= 0.52. No noteworthy differences between the other groups were observed.
Most of the participants (n = 182) had a uni-versity degree or an incomplete uniuni-versity edu-cation; the other educational levels consisted of only a few participants. It was thus not possible to assess the connections between educational levels and Marital Satisfaction.
Table 5
Fit Indexes of the CFA for the Original and Abridged MSS Models
Models χ²/df GFI CFI RMSEA (LO90-HI90) AIC CAIC
Original (24 items) 2.267 0.841 0.844 0.071 (0.064-0.079) 666.434 896.824
Abridged (18 items) 1.921 0.901 0.910 0.061 (0.050-0.072) 331.618 507.799
For analysis purposes, the Number of Chil-dren variable was divided into four categories: no children, one child, two children, and three or more children. One-Way Variance Analysis for the Number of Children factor and the SMI, SEA, SSA and MSStotal variables revealed sub-stantial statistical differences between the mean scores of the groups compared in the SMI, F(3,
245) = 3.224, p < .05, SSA, F(3, 245) = 3.013, p < .05
and MSStotal, F(3, 245) = 2.556, p < .05 variables. The Hochberg post-hoc test identifi ed the fol-lowing differences between the groups that were compared: (a) With respect to the SMI and
MSS-total variables, there were considerable
differenc-es between the no-children group of participants (M = 2.7, SD = 0.36 and M = 2.5, SD = 0.32, respectively) and the one-child group (M = 2.4,
Discussion
In the present study, several MSS items were excluded because they exhibited higher loadings for factors that were not specifi ed in the origi-nal model, presented cross-loadings or displayed insuffi cient factor loadings; some of these items coincide with the items of poor psychometric performance in Dela Coleta’s studies (1989). Nonetheless, since the methods employed in the two studies are different, it is diffi cult to com-pare them. The present EFA extracted an 18-item (seven for SSA, seven for SMI, and four for SEA) fi nal solution that produced factor validity evidence for the MSS. This was corroborated by the CFA.
Pick de Weiss and Andrade Palos (1988a) did not employ the MSS as a global scale. How-ever, Dela Coleta (1989, p. 107) advocated such a possibility, although her idea was based exclu-sively on the “reliability indices obtained” in her research. Employed in the present study, SSL is a resource that can contribute to elaborating the content of general (second-order) or specifi c (fi rst-order) constructs, which are represented in measurement instruments. Information concern-ing the relative contributions of different levels of factors is of theoretical relevance because it reveals the correlation between specifi city and generality. In the condensed MSS version (Table 4), the observed variables effectively represent the global construct, safeguarding the specifi c constructs. The CFA also indicated a good fi t for the condensed MSS model with one general di-mension. At the same time, the CFA revealed a
fi t considered tolerable (Marôco, 2014) for the original MSS model with 24 items (Table 5).
In the present study, by way of exploratory methods, we thus produced validity evidence for the factors of the abridged MSS with one global factor and three fi rst-order factors. This factor-related solution stood out due to its thriftiness, in light of the high degree of simplicity achieved (Bentler, 1977; Lorenzo-Seva, 2003). Further-more, it exhibited a good fi t (GFI = 0.99) and the residuals were lower than expected (Kelley, 1935). The model’s estimated reliability yielded very high values for all factors and for the general
scale. Moreover, this abridged MSS model under-went CFA and demonstrated a good fi t (Table 5). Men evidenced greater SMI than women did in this study; however, the magnitude of this ef-fect was moderate to small (Cohen, 1992). Pick de Weiss & Andrade Palos (1988a, 1988b) and Rostami, Ghazinour, Nygren and Richter (2014) also observed greater satisfaction for men than for women.
One of the reasons for such discrepancies relates to the differences between women and men’s roles in marriage. Women’s roles are ap-parently more demanding and less gratifying than men’s roles are. Women supposedly view their marriages less positively and feel as if they receive fewer advantages. Married women with full-time jobs are believed to face greater responsibilities, duties and role confl icts within their families (Rostami et al., 2014). Another reason is that women seem to expect more in-timacy and emotional support than men do, and men are purportedly not socialized suffi ciently to offer such support. Several researchers have discovered that a spouse’s emotional support best predicts marital satisfaction (Mickelson, Claffey, & Williams, 2006).
The class of biological theories posits that men and women process events in their relation-ships differently at the cardiovascular, endocri-nological, immuendocri-nological, neurosensory, and neurophysiological levels. Although men are more physiologically sensitive than women are to acute stressors, women demonstrate stronger and longer lasting physiological changes due to marital confl icts than men do (Kiecolt-Glaser & Newton, 2001). Other researchers suggest that men and women differ in areas in which they faced different adaptive challenges during their respective evolutionary paths (Simpson & Gan-gestad, 2001).
(2005), it is possible that such sexual differences between men and women, with unrelated data, are due to skewed samples.
In the present study, for SMI and MSStotal, the one-child situation exhibited a lower level of marital satisfaction than the no-children situ-ation exhibited. We also discovered a consider-able difference between the one-child and three-or-more-children situations in terms of SSA. This could be related to the transition to parent-hood, a period involving the spouses’ adaptation to their new roles as parents and professionals (Hernandez & Hutz, 2009; Lawrence, Rothman, Cobb, & Bradbury, 2010). After surmounting the impact of the fi rst child, the next children would be absorbed with greater ease, in light of the fact that no noteworthy differences between the childless group and the two-children and three-or-more-children groups were detected. As a general rule, the existence of offspring can also limit the parents’ freedom, especially when they have a career, which frequently involves hard and/or stressful work (Twenge, Campbell, & Foster, 2003).
In the present study, reasonable evidence of factor validity, criterion validity and reliability, at the very least, were produced for the scores of the abridged MSS version. Nevertheless, the study’s sample is a convenience sample and is limited to the metropolitan region of Rio de Ja-neiro. The results should thus be considered in light of the limited circumstances in which they were produced. Notwithstanding, the partici-pants were ordinary citizens, whereas university samples are typically employed in this fi eld of research. Furthermore, most of the examinees were middle-aged adults involved in long, ef-fective marital relationships (marriages or civil unions), which are important factors when re-searching marital satisfaction. We thus recom-mend future studies involving larger, more di-versifi ed Brazilian samples that can contribute additional data to reinforce the MSS’s structural validity.
References
Ahmadi, H., & Sadeghi, M. (2016). The role of socio - Economic status in marital satisfaction.
Turk-ish Journal of Psychology, 31(77), 43-47.
Arbuckle, (2009). Amos User’s Guide. Chicago, IL: Statistical Product and Service Solutions.
Benetti, S. P. C. (2006). Confl ito conjugal: Impacto no desenvolvimento psicológico da criança e do adolescente. Psicologia: Refl exão e Crítica, 19, 261-268. doi:http://dx.doi.org/10.1590/S0102-79722006000200012
Bentler, P. M. (1977). Factor Simplicity Index and Transformations. Psychometrika, 42(2), 277-295. doi:10.1007/BF02294054
Bolsoni-Silva, A. T., & Marturano, E. M. (2010). Re-lacionamento conjugal, problemas de compor-tamento e habilidades sociais de pré-escolares.
Psicologia: Teoria e Prática, 26(1), 67-75.
Buja, A., & Eyuboglu, N. (1992). Remarks on parallel analysis. Multivariate
Behavior-al Research, 27(4), 509-540. doi:10.1207/
s15327906mbr2704_2
Byrne, B. (2010). Structural Equation Modeling with AMOS. Basic Concepts, Applications, and
Programming. New York: Routledge Taylor &
Francis Group.
Cohen, J. (1992). A Power Primer. Psychological
Bulletin, 112(1), 155-159. doi:http://dx.doi.
org/10.1037/0033-2909.112.1.155
Conway, J. M., & Huffcutt, A. (2003). A review and evaluation of exploratory factor analysis practices in organizational research.
Organi-zational Research Methods, 6(2), 147-168.
doi:10.1177/1094428103251541
Costello, A. B., & Osborne, J. W. (2005). Best prac-tices in Exploratory Factor Analysis: Four rec-ommendations for getting the most from your analysis. Practical Assessment, Research &
Evaluation, 10(7). Retrieved from
http://pareon-line.net/getvn.asp?v=10&n=7
Damásio, B. F. (2012). Uso da análise fatorial ex-ploratória em psicologia. Avaliação
Psicológi-ca, 11(2), 213-228.
Dela Coleta, M. F. (1989). A Medida da Satisfação Conjugal: Adaptação de uma Escala. Psico, 18(2), 90-112.
Dela Coleta, M. F. (1992). Locus de controle e satis-fação conjugal. Psicologia: Teoria e Pesquisa, 8, 243-252.
Dominguez Lara, A. S. (2014). ¿ Matrices Policóri-cas/Tetracóricas o Matrices Pearson? Un estudio metodológico. Revista Argentina de Ciencias
del Comportamiento, 6(1), 39-48.
en psicología. Papeles del Psicólogo, 31(1), 18-33.
Gaskin, C. J., & Happell, B. (2014). On exploratory factor analysis: A review of recent evidence, an assessment of current practice, and recommen-dations for future use. International Journal of
Nursing Studies, 51, 511-521. doi:http://dx.doi.
org/10.1016/j.ijnurstu.2013.10.005
Gottman, J. M., & Silver, N. (2000). The Seven Prin-ciples for Making Marriage Work: A Practical Guide from the Country’s Foremost
Relation-ship Expert. New York: Three Rivers Press.
Hair, J. F., Black, W. C., Babin, B. J., Anderson, R. E., & Tatham, R. L. (2009). Análise
Multivari-ada de Dados. Porto Alegre, RS: Bookman.
Henson, R. K., & Roberts, J. K. (2006). Use of ex-ploratory factor analysis in published research. Common errors and some comment on im-proved practice. Educational and Psychological
Measurement, 66(3), 393-416.
Hernandez, J. A. E., & Hutz, C. S. (2009). Transição para a parentalidade: Ajustamento conjugal e emocional. Psico, 40(4), 414-421.
Izquierdo, I., Olea, J., & Abad, F. J. (2014). Explor-atory factor analysis in validation studies: Uses and recommendations. Psicothema, 26(3), 395-400. doi:10.7334/psicothema2013.349
Jackson, J. B., Miller, R. B., Oka, M., & Henry, R. G. (2014). Gender differences in Marital Sat-isfaction: A Meta-analysis. Journal of
Mar-riage and Family, 76(1), 105-129. doi:10.1111/
jomf.12077
Kelley, T. L. (1935). Essential Traits of Mental Life,
Harvard Studies in Education. Cambridge, MA:
Harvard University Press.
Kiecolt-Glaser, J. K., & Newton, T. L. (2001). Mar-riage and health: His and hers. Psychological
Bulletin, 127(4), 472-503. doi:http://dx.doi.
org/10.1037/0033-2909.127.4.472
Kurdek, L. A. (2005). Gender and Marital Satisfac-tion Early in Marriage: A Growth Curve Ap-proach. Journal of Marriage and Family, 67(1), 68-84. doi:10.1111/j.00222445.2005.00006.x
Laros, J. A. (2005). O uso da análise fatorial: algu-mas diretrizes para pesquisadores. In L. Pasquali (Ed.), Análise fatorial para pesquisadores (pp. 163-184). Brasília, DF: Laboratório de Pesquisa em Avaliação e Medida.
Lawrence, E., Rothman, A. D., Cobb, R. J., & Brad-bury, T. N. (2010). Marital satisfaction across the transition to parenthood: Three eras of re-search. In M. S. Schulz, M. K. Pruett, P. K.
Kerig, & R. D. Parke (Eds.), Strengthening cou-ple relationships for optimal child development:
Lessons from research and intervention (pp.
97-114). Washington, DC: American Psychological Association.
Lorenzo-Seva, U. (2003). A factor simplicity in-dex. Psychometrika, 68(1), 49-60. doi:10.1007/ BF02296652
Lorenzo-Seva, U., & Ferrando, P. J. (2015). Manual
of The Program FACTOR. Tarragona, Spain:
Universitat Rovira i Virgili. Retrieved from http://psico.fcep.urv.es/utilitats/factor/index. html
Lorenzo-Seva, U., Timmerman, M. E., & Kiers, H. A. L. (2011). The Hull method for selecting the number of common factors. Multivariate
Behav-ioral Research, 46(2), 340-364. doi:10.1080/00
273171.2011.564527
Lloret-Segura, S., Ferreres-Traver, A., Hernández-Baeza, A., & Tomás-Marco, I. (2014). El análi-sis factorial exploratorio de los ítems: una guía práctica, revisada y actualizada. Anales de
Psi-cología, 30(3), 1151-1169. doi:http://dx.doi.
org/10.6018/analesps.30.3.199361
Machado, L. M. (2007). Satisfação e insatisfação no casamento: Os dois lados de uma mesma moe-da? (Master’s thesis, Programa de Pós-Gradu-ação em Psicologia, Universidade Federal de Uberlândia, MG, Brazil).
Mardia, K. V. (1970). Measures of multivariate skew-ness and kurtosis with applications. Biometrika, 57(3), 519-530. doi:10.2307/2334770
Marôco, J. (2014). Análise de Equações Estruturais. Fundamentos Teóricos, Software & Aplicações.
Pêro Pinheiro, Portugal: Report Number.
Mickelson, K. D., Claffey, S. T., & Williams, S. L. (2006). The moderating role of gender and gen-der role attitudes on the link between spousal support and marital quality. Sex Roles, 55(1), 73-82. doi:10.1007/s11199-006-9061-8
Mihalcea, A., Iliescu, D., & Dincă, M. (2013). The Infl uence of the Educational Level on Couple Relationships. Procedia - Social and
Behav-ioral Sciences, 78, 41-45.
doi:10.1016/j.sb-spro.2013.04.247
Minnotte, K. L., Minnotte, M. C., & Pedersen, D. E. (2013). Marital satisfaction among dual-earner couples: Gender ideologies and family-to-work confl ict. Family Relations, 62(4), 686-698. doi:10.1111/fare.12021
sat-isfaction? Differences between fi rst and second marriages. Journal of Divorce & Remarriage, 54(1), 78-93. doi:http://dx.doi.org/10.1080/105 02556.2012.743831
Norgren, M. B. P., Souza, R. M., Kaslow, F., Ham-merschmidt, H., & Sharlin, S. A. (2004). Satis-fação conjugal em casamentos de longa duração: Uma construção possível. Estudos de
Psico-logia (Natal), 9(3), 575-584. doi:http://dx.doi.
org/10.1590/S1413-294X2004000300020
Oliveira, M. G. S., Falcone, E. M. de O., & Ribas, R. C., Jr. (2009). A avaliação das relações en-tre a empatia e a satisfação conjugal: Um estu-do preliminar. Interação em Psicologia, 13(2), 287-298. doi:http://dx.doi.org/10.5380/psi. v13i2.8025
Pick de Weiss, S., & Andrade Palos, P. (1988a). De-sarrolllo y validacion de la Escala de Satisfac-cion Marital. Psiquiatria, 1, 9-20.
Pick de Weiss, S., & Andrade Palos, P. (1988b). Diferencias sociodemográfi cas en la satisfac-ción marital: el caso de México. Revista de
Psi-cología Social, 3, 91-97.
Pick de Weiss, S., & Andrade Palos, P. (1988c). Re-lación entre el número de hijos, la satisfacción marital y la comunicación con el cónyuge. Salud
Mental, 11, 15-18.
Ribeiro, C. M., Pinho, V. D., & Falcone, E. M. O. (2011). A infl uência da raiva e da empatia sobre a satisfação conjugal. Aletheia, 35-36, 7-21.
Rostami, A., Ghazinour, M., Nygren, L., & Richter, J. (2014). Marital satisfaction with a special focus on gender differences in medical staff in Tehran, Iran. Journal of Family Issues, 35(14), 1940-1958. doi:10.1177/0192513X13483292
Sardinha, A., Falcone, E. M. O., & Ferreira, M. C. (2009). As relações entre a satisfação conju-gal e as habilidades sociais percebidas no côn-juge. Psicologia: Teoria e Pesquisa, 25(3), 329-336. doi:http://dx.doi.org/10.1590/S0102-37722009000300013
Schmid, J., & Leiman, J. N. (1957). The development of hierarchical factor solutions. Psychometrika, 22, 53-61. doi:10.1007/BF02289209
Sbicigo, J. B., & Lisbôa, C. S. de M. (2009). Habili-dades sociais e satisfação conjugal: Um estudo correlacional. Revista Brasileira de Terapias
Cognitivas, 5, 73-81.
Scorsolini-Comin, F., & Santos, M. A. (2011a). Relações entre bem-estar subjetivo e satis-fação conjugal na abordagem da psicologia positiva. Psicologia: Refl exão e Crítica, 24, 658-665. doi:http://dx.doi.org/10.1590/S0102-79722011000400005
Scorsolini-Comin, F. & Santos, M. A. (2011b). Ajus-tamento diádico e satisfação conjugal: Correla-ções entre os domínios de duas escalas de aval-iação da conjugalidade. Psicologia: Refl exão
e Crítica, 24(3), 439-447. doi:http://dx.doi.
org/10.1590/S0102-79722011000300007
Scorsolini-Comin, F., & Santos, M. A. (2012). A medida positiva dos afetos: Bem-estar subje-tivo (BES) em pessoas casadas. Psicologia:
Refl exão e Crítica, 25, 11-20. doi:http://dx.doi.
org/10.1590/S0102-79722012000100003
Simpson, J. A., & Gangestad, S. W. (2001). Evo-lution and relationships: A call for integra-tion. Personal Relationships, 8(4), 341-355. doi:10.1111/j.1475-6811.2001.tb00044.x
Solomon, B. C., & Jackson, J. J. (2014). Why do personality traits predict divorce? Multiple path-ways through satisfaction. Journal of
Person-ality and Social Psychology, 106(6), 978-996.
doi:http://dx.doi.org/10.1037/a0036190
Timmerman, M. E., & Lorenzo-Seva, U. (2011). Di-mensionality assessment of ordered polytomous items with parallel analysis. Psychological
Methods, 16(2), 209-220. doi:10.1037/a0023353
Twenge, J., Campbell, K., & Foster, C. (2003). Parenthood and marital satisfaction: A meta-analytic review. Journal of Marriage and
Family, 65(3), 574-583.
doi:10.1111/j.1741-3737.2003.00574.x
Villa, M. B., & Del Prette, Z. A. P. (2013). Marital satisfaction: The role of social skills of husbands and wives. Paidéia (Ribeirão Preto), 23(56), 379-388. doi:http://dx.doi.org/10.1590/1982-43272356201312
Wolff, H.-G., & Preising, K. (2005). Exploring item and higher order factor structure with the Schmid–Leiman solution: Syntax codes for SPSS and SAS. Behavior Research Methods, 37, 48-58. doi:10.3758/BF03206397
Received: 16/05/2016
1st revision: 17/12/2016
Accepted: 28/12/2016
__________________________________________________________________________________________