Article
Land Cover Classification from Multispectral Data
Using Computational Intelligence Tools:
A Comparative Study
AndréMora1,* ID, Tiago M. A. Santos1, Szymon Łukasik2,3, João M. N. Silva4 ID,
António J. Falcão1, JoséM. Fonseca1 ID and Rita A. Ribeiro1 ID
1 Computational Intelligence Group of CTS/UNINOVA, FCT, University NOVA of Lisbon, 2820-516 Caparica, Portugal; [email protected] (T.M.A.S.); [email protected] (A.J.F.); [email protected] (J.M.F.);
[email protected] (R.A.R.)
2 Faculty of Physics and Applied Computer Science, AGH University of Science and Technology,
30-059 Kraków, Poland; [email protected]
3 Systems Research Institute, Polish Academy of Sciences, 01-447 Warsaw, Poland
4 Forest Research Centre, School of Agriculture, University of Lisbon, 1349-017 Lisbon, Portugal; [email protected]
* Correspondence: [email protected]; Tel.: +351-21-2948527
Received: 8 October 2017; Accepted: 13 November 2017; Published: 15 November 2017
Abstract:This article discusses how computational intelligence techniques are applied to fuse spectral images into a higher level image of land cover distribution for remote sensing, specifically for satellite image classification. We compare a fuzzy-inference method with two other computational intelligence methods, decision trees and neural networks, using a case study of land cover classification from satellite images. Further, an unsupervised approach based on k-means clustering has been also taken into consideration for comparison. The fuzzy-inference method includes training the classifier with a fuzzy-fusion technique and then performing land cover classification using reinforcement aggregation operators. To assess the robustness of the four methods, a comparative study including three years of land cover maps for the district of Mandimba, Niassa province, Mozambique, was undertaken. Our results show that the fuzzy-fusion method performs similarly to decision trees, achieving reliable classifications; neural networks suffer from overfitting; while k-means clustering constitutes a promising technique to identify land cover types from unknown areas.
Keywords:image fusion; aggregation operators; remote sensing; land cover classification
1. Introduction
The main objective of this study is to discuss the suitability of different computational intelligence methods for studying land cover spatiotemporal modifications, mainly for improving land usage and management. This paper is based on a preliminary conference paper [1] where we presented a novel fuzzy image fusion technique and compared it with two other computational intelligence methods, decision trees and neural networks, for fusing images and performing classification of terrains as waterbody, river bank, bare area, cropland, grassland, shrubland and forest. In this article, we extend the previous work by reproducing a spatiotemporal case study with three years (1989, 2002, 2005) run by Temudo et al. [2] where the changes of land cover usage in the post-war period (>1992) in the district of Mandimba, Niassa province, Mozambique, were studied (http://earthexplorer.usgs.gov). In our article, we also include an unsupervised approach for enriching the comparative study. The aim of this extension is to strengthen the claims about the accuracy of the fuzzy-fusion approach and to demonstrate its suitability for spatiotemporal image fusion.
Nowadays, with the free availability in web repositories of multispectral satellite images from Earth observation missions, we can efficiently classify terrain types and, therefore, contribute to studies and improved analysis of the Earth environment. These studies fall into the domain of remote sensing analysis and cover topics such as deforestation, degradation of coastal areas, wildfires and shifting cultivation, among others [3]. The term remote sensing is understood as a technique for identifying, classifying and determining an object’s properties through the analysis of data acquired remotely, without physical contact with the object itself [4].
There are several works in the literature about applying Computational Intelligence (CI) techniques to satellite images for feature extraction and classification, with the aim of improving land cover analysis. For example, CI techniques such as fuzzy logic [5–7], Decision Trees (DT) [8–10] and Artificial Neural Networks (ANN) [11–14] are already applied in many classification problems and in particular in some cases of remote sensing [15–17].
The discussed fuzzy-fusion inference method, instead of just using a basic fuzzy inference model, is improved with reinforcement aggregation operators to perform the inference reasoning [1, 18]. Reinforcement aggregation operators have been applied in decision making methods and data fusion [19–22], but here, they are used in the inference scheme to ensure positive or negative reinforcement in the classification. The fuzzy-fusion inference method includes three steps: (i) fuzzification of the spectral information (bands); (ii) creation of the rule set for the land cover classes; (iii) evaluation of the rules using aggregation operators. To create the fuzzy membership functions (Step i), we generated histograms from the training data and then built the membership functions by fitting Gaussian functions to the histogram’s clusters (clustered with Otsu’s thresholding method [23]) using a hybrid algorithm that combines the Levenberg–Marquardt optimization method [24] and the classic mean and standard deviation approach [16]. For the classification process (Step ii), seven rules were defined, one for each class to be classified, having seven inputs each, corresponding to the spectral bands’ membership functions. For the inference scheme (Step iii), we followed the Takagi–Sugeno model of fuzzy inputs, crisp output [25] and tested four types of aggregation operators: average; minimum; and two reinforcement operators: Fixed Identity Monotonic Identity Commutative Aggregation (FIMICA); Fuzzy-Fusion (FF)-Uninorm [21,26,27].
This paper is organized as follows. Section2provides an overview of techniques used in remote sensing, with special consideration of approaches based on the techniques of computational intelligence. In Section3, the case study and the proposed classification method are presented. In Section 4, a comparative study of the results obtained with our approach, DT, ANN and unsupervised k-means clustering is given. Finally, in Section5, we provide some conclusions and future work.
2. Related Work in Remote Sensing Analysis
Decision Tree (DT) classifiers divide data into smaller subsets with some similar features, until subsets are homogeneous. A DT is composed of nodes (root and interior) and leaves (terminal nodes). Each node represents a rule that is applied to the data and that controls the path to be followed to the next node. The design of a tree can be done manually, when it is based on a priori knowledge, or automatically using mathematical evaluation algorithms, such as ID3 (Iterative Dichotomiser 3), C4.5 or CART (Classification And Regression Tree) methods. Friedl and Brodley [3] and Fauvel et al. [17] used DTs to perform terrain classification and concluded that they are adaptable to noisy and nonlinear relations between land cover classes and remotely-sensed data.
Artificial Neural Networks (ANN) form a classification technique where neurons are trained to detect patterns in the training dataset and then the trained classifier is applied to unknown data. In a multi-layer ANN, the number of neurons in the input and output layers is determined by the data being analyzed (external elements), while the number of hidden layers is determined mainly by trial and error, allowing the network to solve more complex problems [15]. This classification technique has some drawbacks, in particular a long learning time, lack of transparency on the reasoning process (typically presenting a black-box behavior) and a tendency to produce overfitting. One of the first applications of ANN in remotely-sensed data was the work of Kanellopoulos and Wilkinson [33]. In their article, a set of best practices for applying ANN in remote sensing data was presented. Later, Ayhan and Kansu [15] conducted a study, comparing three multispectral image classification techniques, namely ANN, the maximum-likelihood estimator and fuzzy logic, using images from IKONOS II and Landsat. They concluded that ANN is a robust method, but with the drawback that determining the optimum network structure is a hard and fundamental task to ensure good results.
Finally, Fuzzy Inference Systems (FIS) are rule-based models described by logic operators in rules that establish relationships between fuzzy sets [34]. The set of rules, which can be provided either by experts or by creating all possible combinations between input variables [35] are composed by a set of propositions, antecedents (inputs) and consequents (outputs). FIS include three main processes [34]: inputs’ fuzzification; fuzzy rules’ definition and inference scheme selection to obtain the outputs. The fuzzification process refers to the representation of all input variables on the [0, 1] domain through the use of fuzzy sets. The most common fuzzification processes [34] are performed through: intuition, inference or induction. Induction uses observation data to generate membership functions, and this is the chosen method in this work. Regarding the inference scheme, the most well-known models are those of Mamdani [36] and Takagi–Sugeno [25]. The Mamdani model requires defuzzification and is more computationally intensive, while Takagi–Sugeno is more suitable for mathematical analysis because it is computationally efficient and produces crisp outputs. In this work, and due to its efficiency, we use the weighted average of the Takagi–Sugeno model, but substituting the classical algebraic operators by the reinforcement aggregation operator. Throughout the literature, there are several published works where fuzzy logic classifiers were applied in remote sensing problems, but none with our specifications. Some, like [7,15,37], train the classifier (fuzzification) using simple Gaussian membership functions, which are defined only with the data’s mean and standard deviation, and use a discrete max-min operator for the inference scheme. This method will be hereafter referred to as the classical method.
3. Materials and Methods
3.1. Input Data
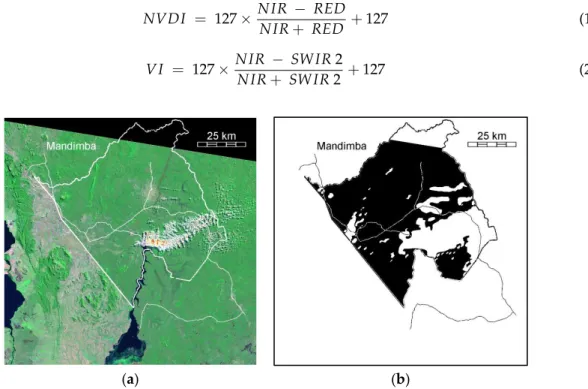
The imagery used was borrowed from Temudo et al. [2], which included Landsat 5 (1989) and 7 (2002 and 2005) high-resolution satellite images (8-bit data), taken over the district of Mandimba, province of Niassa, in Mozambique (Figure1a). The choice of dataset was due to the existing expert land classification, on the mentioned study, that could act as the ground-truth. Landsat 5 used a Thematic Mapper (TM) multispectral scanning radiometer and Landsat 7 the Enhanced Thematic Mapper Plus (ETM+), which has similar resolution (28.5 m/pixel) and the same spectral bands (seven) plus a panchromatic one (15 m/pixel), and each image covers the same area. The satellite images were acquired in 1989, 2002 and 2005 and cover a region of approximately 16,831 km2(4605×4500 pixels with a 28.5-m/pixel effective resolution). A mask of the Mandimba district and areas not covered by nebulosity in any of the three images was created (Figure1b), reducing the total covered area to 3367 km2. We used five spectral bands, namely Green-Band 2, Red-Band 3, Near-Infrared (c)-Band 4, Short Wave Infrared 1 (SWIR-1)-Band 5 andSWIR-2-Band 7, together with two vegetation indices, to ensure the distinction of vegetation types: the Normalized Difference Vegetation Index (NDVI) [39] and the Vegetation Index (VI) proposed in [40], respectively depicted by Equations (1) and (2). In their original equations, they provide normalized values in the interval [−1, 1], but here, they were rescaled to a normalized 8-bit unsigned scale [0, 255]. These vegetation indices have the advantage of being less dependent on illumination and having a good discrimination between different land cover types. They show higher values for vegetation, positive low values for water and bare soils and negative index values for clouds and snow.
NVDI = 127× N IR
− RED
N IR+ RED +127 (1)
V I = 127×N IR − SW IR2
N IR+ SW IR2 +127 (2)
−
𝑁𝑉𝐷𝐼 = 127 ×𝑁𝐼𝑅 + 𝑅𝐸𝐷 + 127𝑁𝐼𝑅 – 𝑅𝐸𝐷
𝑉𝐼 = 127 ×𝑁𝐼𝑅 + 𝑆𝑊𝐼𝑅 2 + 127𝑁𝐼𝑅 – 𝑆𝑊𝐼𝑅 2
(a) (b)
“ ”
Figure 1.(a) Landsat 5 image taken in 1989 over the district of Mandimba (RGB-Bands 743) and (b) in black, the mask of the Mandimba district and areas not covered by clouds in the 3 images.
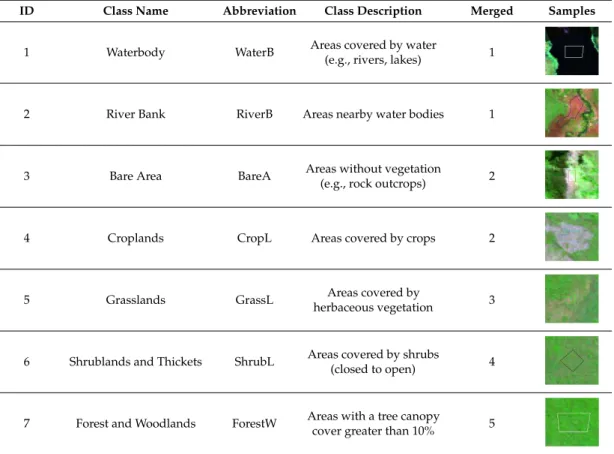
Table 1.Classes used for classification and merged 5-class distribution.
ID Class Name Abbreviation Class Description Merged Samples
1 Waterbody WaterB Areas covered by water
(e.g., rivers, lakes) 1
’
2 River Bank RiverB Areas nearby water bodies 1
’
3 Bare Area BareA Areas without vegetation
(e.g., rock outcrops) 2
’
4 Croplands CropL Areas covered by crops 2
’
5 Grasslands GrassL Areas covered by
herbaceous vegetation 3
’
6 Shrublands and Thickets ShrubL Areas covered by shrubs
(closed to open) 4
’
7 Forest and Woodlands ForestW Areas with a tree canopy
cover greater than 10% 5
’
3.2. Overview of the Fuzzy-Fusion Uninorm Method
The fuzzy-fusion classifier is a supervised system using an inference scheme with specialized reinforcement aggregation operators. The output of each rule is the result of the aggregation of its antecedents, i.e., each rule represents a class, which evaluates a given pixel using its seven spectral information bands. The classification result is the class that obtained the maximum score. To build a classifier based on the fuzzy-fusion approach, three stages are required: (1) create the training set and build the inputs’ membership functions; (2) define the rule-base system; and (3) implement the inference scheme with reinforcement aggregation operators.
3.2.1. Training Set
Since the satellite images for the three years were not calibrated, different supervised training sets for each year were created. Further, as mentioned before, since there is no ground-truth data available, we used the training sets built manually by the experts, Temudo et al. [2], through visual inspection of Landsat and SPOT satellite images and supported by land cover statistics produced by Mozambique National Cartography and Remote Sensing Centre (CENACARTA) (available athttp://www.cenacarta.com). They selected a total of 10,840, 9950 and 10,106 sample pixels (seven bands each), representing the seven aforementioned classes, respectively for the years 1989, 2002 and 2005.
Class1 (WaterB)
No
rm
ali
zed
Oc
curr
ences
Band1 Band7
Class7 (ForestW)
No
rm
ali
zed
Oc
curr
ences
⋮ ⋮
Pixel Intensity Pixel Intensity
’
’
–
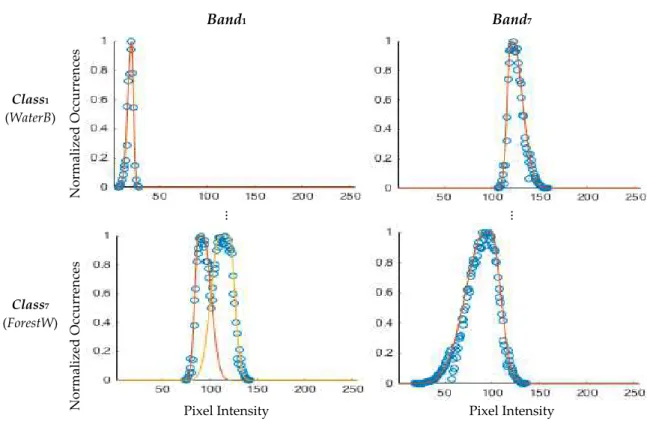
Figure 2. Example of histograms and unimodal and bimodal membership function fits for classes Waterbodies and Forests and Woodlands.
There are several methods to create fuzzy membership functions. A good overview can be found in [34]. In our case, we followed an inductive method using histograms and fitted Gaussian functions, which on the one hand, can be generated automatically from the training set and, on the other hand, provide a smooth model of the histogram distribution. Knowing that histograms describe the frequency of pixel values within a class, pixels more likely to appear have higher membership values, while the inverse applies to pixels with lower occurrences.
Since the area covered by one pixel (28.5 m×28.5 m) may contain more than one land type or, in other words, the class selected can be composed of multiple land or vegetation types (example of Shrublands that are a mixture of bushes and soil), these histograms are not always smooth, unimodal or symmetrical. Bimodalities and asymmetries may occur like the ones illustrated in Figure2. Fitting just one single Gaussian function did not always converge to the best solution. Therefore, we devised five steps to obtain the pseudo-optimal membership functions:
1. Fit the histogram with one asymmetrical Gaussian membership function;
2. Apply Otsu’s thresholding method [23] to the histogram to find the two main clusters;
3. Obtain for each cluster an asymmetrical Gaussian membership function, using the cluster’s mean and standard deviation values above and below the mean value;
4. Fit each cluster by an asymmetrical Gaussian membership function;
5. Use the root mean square error to select the membership function that best fits the cluster (choosing the resulting membership function of Step 1, 3 or 4).
with few samples (bare areas) or in someVIhistograms where sparsity occurred due to rounding effects, a final manual adjustment of the Gaussian fitting was required.
3.2.2. Rule-Based System
The rule set defined for our method is composed of seven rules, one for each land cover class. The fuzzy variables are the spectral bands, with a specific membership function for each class. In general, if a class receives high scores through all Nbands, then it should be assigned to the pixel. A set ofKrules (K-number of classes) is then automatically identified in the fuzzy rule-based inference system. It should be noticed that when classes contain a mixture of land or vegetation types and it is possible to have a more detailed training set, it is better to have more rules for each land type, although the output class is the same. In our case, the rule-set is composed of seven rules:
Rule 1: If Band 1 is Waterbody (WaterB) and Band 2 is WaterB . . . and Band 7 is WaterB Then output is WaterB; Rule 2: If Band 1 is River Bank (RiverB) and Band 2 is RiverB . . . and Band 7 is RiverB Then output is RiverB; Rule 3: If Band 1 is Bare Area (BareA) and Band 2 is BareA . . . and Band 7 is BareA Then output is BareA; Rule 4: If Band 1 is Cropland (CropL) and Band 2 is CropL . . . and Band 7 is CropL Then output is CropL; Rule 5: If Band 1 is Grassland (GrassL) and Band 2 is GrassL . . . and Band 7 is GrassL Then output is GrassL; Rule 6: If Band 1 is Shrubland (ShrubL) and Band 2 is ShrubL . . . and Band 7 is ShrubL Then output is ShrubL; Rule 7: If Band 1 is Forest and Woodlands (ForestW) and Band 2 is ForestW . . . and Band 7 is ForestW Then output is ForestW.
The firing level of every rule (i.e., rule output score) is calculated with a reinforcement aggregation operator, detailed in the next section. This technique also generates a certainty measure for all classes, thus enabling producing certainty distribution maps.
3.2.3. Reinforcement Inference Scheme
As mentioned before, here, we follow an inference scheme that uses reinforcement aggregation operators to perform the fusion of images [1]. This fusion process with specialized aggregation operators is based on other work performed by some co-authors [18]. Reinforcement aggregation operators penalize results with lower scores (negative reinforcement) and reward high scores (positive reinforcement) allowing one to discard alternative classes with very low scores (details about these operators can be seen in [26,27]). Formally, the discussed inference scheme includes, as the premise, the scores from each band and then the firing level determination (aggregation operation) selection of the best score, i.e., the class identification is as follows:
Score=maxi ⊕jClassi bandj
(3)
where:
• ⊕j= aggregation operator;
• i ∈ [0,NClasses]= the class number; • j ∈ [0,NBands]= the band number; • Classi= class under evaluation; • bandj= input bands.
It should be noted that performing inference with reinforcement operators is an innovative method to determine a more positive or negative reinforcement of the rule’s firing level and respective classification certainty for each class (for more details, see [1]). In the same article, it was found that the Uninorm reinforcement aggregation operator was better for classification of satellite images; hence, it is the one considered in this comparative study.
4. Assessment and Discussion
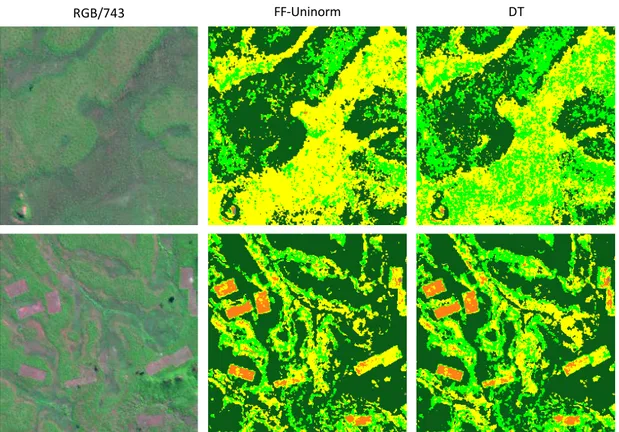
Mandimba. In the ground-truth study [2], the inputs were preprocessed by a mean filtering to produce more homogenous land cover maps. Then, the authors used a decision tree classifier to generate their land cover maps. The effect of filtering on the land cover maps can be seen in Figure3where the original image was compared with the FF-Uninorm method before and after applying a 3×3 mean filtering. Figure3b contains a noisier image than the ground-truth one, and Figure3c contains the same level of smoothness as Figure3a. Following this observation, we preprocessed all the images in the same fashion.
(a) (b) (c)
“ samples”
– –
Figure 3.(a) Land cover ground-truth classification as published by Temudo et al. [2]; (b) Fuzzy-Fusion (FF)-Uninorm classification; (c) FF-Uninorm classification after applying a mean filtering.
The Decision Tree (DT) ground-truth classifier was created with the CART algorithm, while the ANN and k-means algorithms were developed using MATLAB Toolboxes. The ANN configuration was a feedforward network composed of seven input neurons, one hidden layer with eight neurons and seven output neurons fully interconnected. The k-means was configured to detect eight clusters, being this extra one the background mask, and then, it was applied to the full image. Its training accuracy was computed by locating in the image the training samples, obtaining their outputs and computing the accuracy scores. Since the ground-truth study [2] aggregates the seven classes into a smaller set of five classes, we merged the classes according to the same merged column in Table1.
4.1. Comparison of Training Results
We compare our fuzzy-fusion model, configured with the Uninorm reinforcement aggregation operator (FF-Uninorm), against other CI techniques, namely with DT (ground-truth study), ANN and k-means (an unsupervised approach). All techniques share the same training sets, previously presented on Section3.2.1, one for each year. The accuracy was computed as the rate of correct classifications versus the total number of training samples.
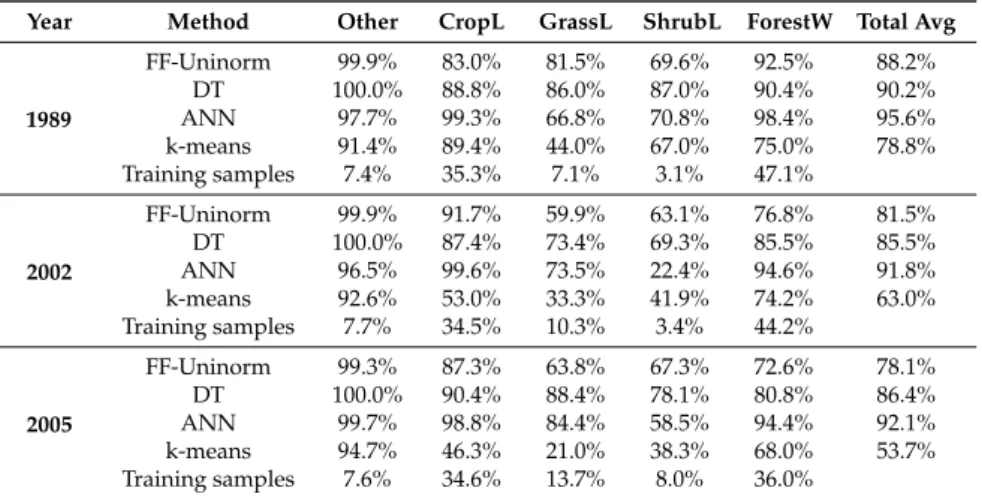
Table 2.Accuracy of classifying the training set with FF-Uninorm, DT, ANN and k-means.
Year Method Other CropL GrassL ShrubL ForestW Total Avg
1989
FF-Uninorm 99.9% 83.0% 81.5% 69.6% 92.5% 88.2% DT 100.0% 88.8% 86.0% 87.0% 90.4% 90.2% ANN 97.7% 99.3% 66.8% 70.8% 98.4% 95.6% k-means 91.4% 89.4% 44.0% 67.0% 75.0% 78.8% Training samples 7.4% 35.3% 7.1% 3.1% 47.1%
2002
FF-Uninorm 99.9% 91.7% 59.9% 63.1% 76.8% 81.5% DT 100.0% 87.4% 73.4% 69.3% 85.5% 85.5% ANN 96.5% 99.6% 73.5% 22.4% 94.6% 91.8% k-means 92.6% 53.0% 33.3% 41.9% 74.2% 63.0% Training samples 7.7% 34.5% 10.3% 3.4% 44.2%
2005
FF-Uninorm 99.3% 87.3% 63.8% 67.3% 72.6% 78.1% DT 100.0% 90.4% 88.4% 78.1% 80.8% 86.4% ANN 99.7% 98.8% 84.4% 58.5% 94.4% 92.1% k-means 94.7% 46.3% 21.0% 38.3% 68.0% 53.7% Training samples 7.6% 34.6% 13.7% 8.0% 36.0%
From these training accuracies, it was expected to have a more reliable classification from ANN, but to confirm this, we classified the full image and discuss the results in the following section.
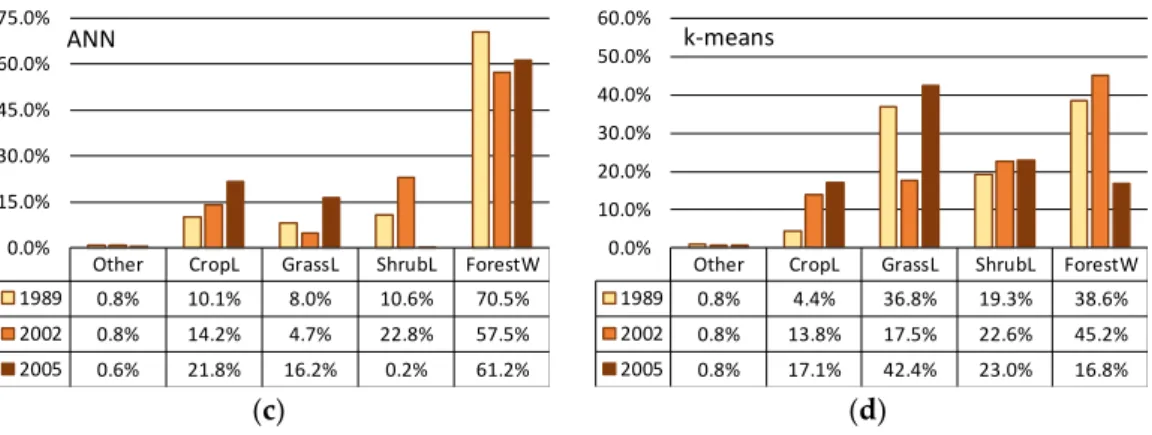
4.2. Comparison of Classification Results
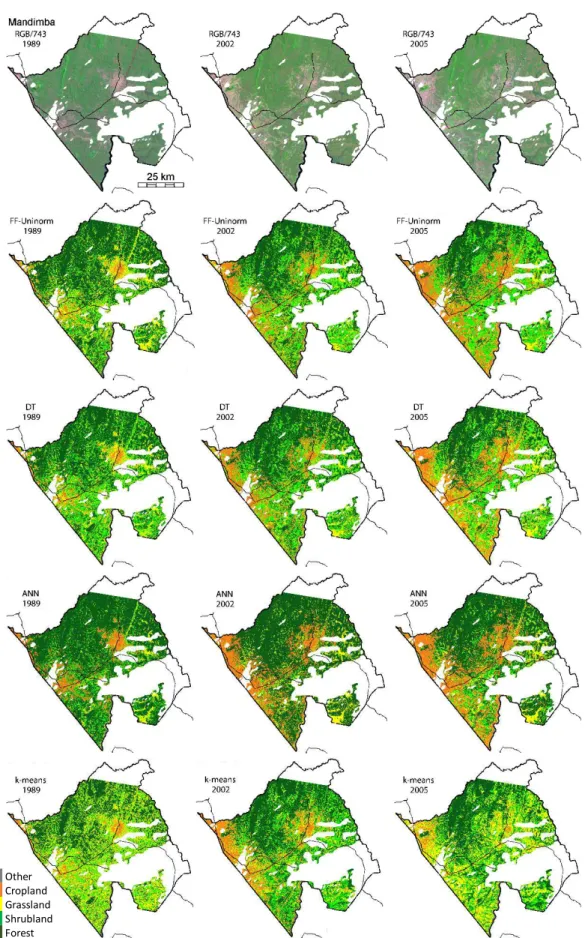
The full size image of the Mandimba region was also classified and results compared with the ground-truth. The comparison was made by analyzing the total areas covered by each land cover type, computing the Rand Index clustering agreement validity measure (explained in the next section) and by visual inspection of the land cover classified images. In the study run by Temudo et al. [2], the main objective was to analyze the land cover changes that occurred in the period 1989–2005. The authors found that, mainly observed near the border with Malawi (west), there was a shifting in the use of lands from forest and shrublands to areas devoted to crops.
The land cover area distribution over the three-year study for the four methods can be found in Figure4, while Figure5demonstrates land cover classified images. Analyzing the areas of ANN and k-means, only croplands showed the evolution mentioned by the ground-truth study, and all the other land cover types had irregular behaviors, which does not reflect the reality in this district. In the case of ANN, which in the training obtained the best accuracy results, the irregularity can be justified by a possible overfitting. Concluding, ANN does not adapt to small training sets, while other techniques do. The k-means could identify the main land cover types, as depicted in Figure5and in more detail in Figure6, where a road is clearly detected, and the other main classes were correctly classified. Perhaps more tests with a higher number of clusters can identify more subtypes, which can be merged into the land cover groups previously defined and achieve a higher accuracy.
–
(a) (b)
Other CropL GrassL ShrubL ForestW 1989 1.2% 4.5% 23.0% 14.8% 56.5% 2002 0.9% 12.6% 18.7% 22.7% 45.0% 2005 1.1% 21.9% 15.7% 27.3% 34.0% 0.0% 10.0% 20.0% 30.0% 40.0% 50.0% 60.0% FF-Uninorm
Other CropL GrassL ShrubL ForestW 1989 1.0% 5.0% 19.8% 23.0% 51.3% 2002 1.0% 12.3% 17.1% 21.7% 48.0% 2005 0.9% 17.8% 23.9% 20.9% 36.5% 0.0% 10.0% 20.0% 30.0% 40.0% 50.0% 60.0% DT
(c) (d)
– –
Other CropL GrassL ShrubL ForestW
1989 0.8% 10.1% 8.0% 10.6% 70.5%
2002 0.8% 14.2% 4.7% 22.8% 57.5%
2005 0.6% 21.8% 16.2% 0.2% 61.2%
0.0% 15.0% 30.0% 45.0% 60.0% 75.0%
ANN
Other CropL GrassL ShrubL ForestW
1989 0.8% 4.4% 36.8% 19.3% 38.6%
2002 0.8% 13.8% 17.5% 22.6% 45.2%
2005 0.8% 17.1% 42.4% 23.0% 16.8%
0.0% 10.0% 20.0% 30.0% 40.0% 50.0% 60.0%
k-means
Figure 4.Land cover areas distribution along the three-year study for the four classification methods: (a) FF-Uninorm; (b) Decision Tree; (c) Artificial Neural Network; (d) k-means clustering.
Regarding FF-Uninorm and DT, it clearly depicts the trend presented in the ground-truth study as croplands area increased (4.5% » 21.9% for FF-Uninorm and 5.0% » 17.8% for DT) and forest decreased its area (56.5% » 34.0% for FF-Uninorm and 51.3% » 36.5% for DT), while the Others class remained with approximately the same area (1.2 » 1.1% for FF-Uninorm and 1.0 » 0.9% for DT). When analyzing the areas of grassland and shrubland, the results differ. FF-Uninorm identified a negative trend for grassland and a positive trend for shrubland, while DT obtained approximately stable areas for both types along this time period. These results are difficult to distinguish even by visual inspection (top row of Figure7), since small bushes can be interleaved with grasslands and only a detailed analysis can identify which classification method was more accurate. To improve their classification a neighboring analysis should be undertaken to detect mixed land cover areas. If we sum the areas of these two classes, their differences are lower and show a slight positive trend.
Another validity measure, especially to assess k-means performance, was the use of the Rand Index (RI) cluster agreement measure. RI is an external clustering validity measure based on pairwise comparison of clustering assignments of points belonging to the same/different clusters (in both of compared clustering solutions) [41]. A value of one of RI indicates that both investigated clusterings are identical and zero that they do not agree on any pair of points. In Table3, the agreements between the four methods for each year and the average along the three-year study can be seen.
The agreement results reinforced the conclusion that FF-Uninorm and DT are the most similar ones among them (0.8 on average). Furthermore, it showed that the k-means clustering technique, although being an unsupervised technique, was quite consistent along the study and obtained relatively high scores when compared with FF-Uninorm and DT (0.73–0.84 with FF-Uninorm and 0.69–0.76 with DT).
In summary, our model with the FF-Uninorm operator produced results that are adaptable and consistent with DT (bottom row of Figure6). k-means was shown to be an adequate technique whenever there is no prior knowledge on the land cover classes.
Table 3.Rand Index agreement validity measure among FF-Uninorm, DT, ANN and k-means.
1989 2002 2005 Average
DT ANN k-Means DT ANN k-Means DT ANN k-Means DT ANN k-Means FF-Uninorm 0.77 0.73 0.75 0.85 0.79 0.73 0.80 0.71 0.84 0.80 0.74 0.77
DT 0.75 0.69 0.75 0.74 0.75 0.76 0.75 0.73
Other Cropland Grassland Shrubland Forest
RGB/743 FF-Uninorm K-means
Figure 6.Detail of the land cover classification using FF-Uninorm and k-means, where a road is clearly seen and correctly identified by both methods.
RGB/743 FF-Uninorm DT
Figure 7. (Top row) Detail on the Grassland and Shrubland classification comparison between FF-Uninorm and DT. (Bottom row) Correct and detailed classification obtained by FF-Uninorm and DT.
5. Conclusions
our comparison study, the k-means unsupervised clustering technique, to assess its suitability as an alternative classification method.
Our fuzzy-fusion approach improved the training of common fuzzy classifiers by: (a) proposing a hybrid algorithm that performs clustering of the pixel intensity histograms and fits them with Gaussian functions; (b) uses a reinforcement operator (Uninorm) as a novel inference scheme for the rule-based classification. Furthermore, this method can produce classification certainty maps that help to assess the results and detect possible improvements (although this functionality was not used in this study).
When comparing the accuracy of our FF-Uninorm approach with the other three computational intelligence techniques (decision trees, artificial neural networks and k-means), the general accuracy was lower than DT and ANN. However, when applied to the full images, it performed similarly to DT, and we manage to successfully reproduce the ground-truth results. A higher disparity in the classification of grassland and shrubland between FF-Uninorm and DT was noticed, although this might be due to these classes being composed of a mixture of bare and vegetation areas, and these methods are not able to process this spatial distribution just with a single pixel classification.
The introduction of the k-means unsupervised technique in this study gave positive insights on the ability of the method to analyze unknown areas or to prepare training sets for other methods. In most tests, it produced reasonable classifications and obtained a good agreement with FF-Uninorm and DT.
As future directions, we can identify the need for improvements on the training set generation and consequent improvements on the membership function creation, mainly to deal with the small number of samples of less frequent classes. Furthermore, we plan to introduce a pixel neighboring analysis upon the pixel classification, to improve the classification of land cover classes that have a mixture of land types (ex. Shrublands).
Acknowledgments: This work was partially funded by FCT Strategic Program UID/EEA/00066/203 of the Center of Technologies and System (CTS) of UNINOVA—Institute for the Development of new Technologies. It is also partially based on work from COST Action TD1403 “Big Data Era in Sky and Earth Observation”, supported by COST (European Cooperation in Science and Technology).
Author Contributions: A.M., T.M.A.S. and S.Ł. prepared and ran the experiments. All the authors have scientifically contributed to the proposed method and collaborated in writing and reviewing the article.
Conflicts of Interest:The authors declare no conflict of interest.
References
1. Santos, T.M.A.; Mora, A.; Ribeiro, R.A.; Silva, J.M.N. Fuzzy-fusion approach for land cover classification. In Proceedings of the 2016 IEEE 20th Jubilee International Conference on Intelligent Engineering Systems (INES), Budapest, Hungary, 30 June–2 July 2016; pp. 177–182. [CrossRef]
2. Temudo, M.P.; Silva, J.M.N. Agriculture and forest cover changes in post-war Mozambique.J. Land Use Sci.
2012,7, 425–442. [CrossRef]
3. Friedl, M.A.; Brodley, C.E. Decision tree classification of land cover from remotely sensed data.
Remote Sens. Environ.1997,61, 399–409. [CrossRef]
4. Schowengerdt, R.A.Remote Sensing: Models and Methods for Image Processing; Academic Press: Cambridge, MA, USA, 2006.
5. Ishibuchi, H.; Nozaki, K.; Yamamoto, N.; Tanaka, H. Construction of fuzzy classification systems with rectangular fuzzy rules using genetic algorithms.Fuzzy Sets Syst.1994,65, 237–253. [CrossRef]
6. Nguyen, C.H.; Pedrycz, W.; Duong, T.L.; Tran, T.S. A genetic design of linguistic terms for fuzzy rule based classifiers.Int. J. Approx. Reason.2013,54, 1–21. [CrossRef]
7. Shackelford, A.K.; Davis, C.H. A combined fuzzy pixel-based and object-based approach for classification of high-resolution multispectral data over urban areas.IEEE Trans. Geosci. Remote Sens.2003,41, 2354–2363. [CrossRef]
8. Barros, R.C.; Basgalupp, M.P.; de Carvalho, A.C.P.L.F.; Freitas, A.A. A Survey of Evolutionary Algorithms for Decision-Tree Induction.IEEE Trans. Syst. Man Cybern. Part C (Appl. Rev.)2012,42, 291–312. [CrossRef] 9. Belgiu, M.; Drăgu¸t, L. Random forest in remote sensing: A review of applications and future directions.
10. Millán, V.E.G.; Sanchez-Azofeifa, G.A.; Malvárez, G.C. Mapping Tropical Dry Forest Succession With CHRIS/PROBA Hyperspectral Images Using Nonparametric Decision Trees.IEEE J. Sel. Top. Appl. Earth
Obs. Remote Sens.2015,8, 3081–3094. [CrossRef]
11. Ahmed, B.; Al Noman, M.A. Land cover classification for satellite images based on normalization technique and Artificial Neural Network. In Proceedings of the 2015 1st International Conference on Computer and Information Engineering (ICCIE), Rajshahi, Bangladesh, 26–27 November 2015; pp. 138–141. [CrossRef] 12. Castelluccio, M.; Poggi, G.; Sansone, C.; Verdoliva, L. Land Use Classification in Remote Sensing Images by
Convolutional Neural Networks.arXiv, 2015.
13. Sharapov, R.; Varlamov, A. Using neural networks in remote sensing monitoring of exogenous processes. In Proceedings of the Sixth International Conference on Graphic and Image Processing (ICGIP 2014), Beijing, China, 24–26 October 2014.
14. Schmidhuber, J. Deep learning in neural networks: An overview.Neural Netw.2015,61, 85–117. [CrossRef] [PubMed]
15. Ayhan, E.; Kansu, O. Analysis of image classification methods for remote sensing.Exp. Tech.2012,36, 18–25. [CrossRef]
16. Mather, P.; Tso, B.Classification Methods for Remotely Sensed Data, 2nd ed.; CRC Press: Boca Raton, FL, USA, 2009. 17. Fauvel, M.; Chanussot, J.; Benediktsson, J.A. Decision Fusion for the Classification of Urban Remote Sensing
Images.IEEE Trans. Geosci. Remote Sens.2006,44, 2828–2838. [CrossRef]
18. Ribeiro, R.A.; Falcão, A.; Mora, A.; Fonseca, J.M. FIF: A fuzzy information fusion algorithm based on multi-criteria decision making.Knowl.-Based Syst.2014,58, 23–32. [CrossRef]
19. Rudas, I.J.; Pap, E.; Fodor, J. Information aggregation in intelligent systems: An application oriented approach.
Knowl.-Based Syst.2013,38, 3–13. [CrossRef]
20. Beliakov, G.; Pradera, A.; Calvo, T.Aggregation Functions: A Guide for Practitioners; Springer Publishing Company: Heidelberg, Germany, 2007; Volume 221.
21. Ribeiro, R.A.; Pais, T.C.; Simões, L.F. Benefits of Full-Reinforcement Operators for Spacecraft Target Landing.
InPreferences and Decisions, Models and Applications; Greco, S., Marques Pereira, R.A., Squillante, M.,
Yager, R.R., Kacprzyk, J., Eds.; Springer: Berlin/Heidelberg, Germany, 2010; pp. 353–367.
22. Torra, V.; Narukawa, Y. Modeling Decisions: Information Fusion and Aggregation Operators; Springer: Berlin/Heidelberg, Germany, 2007; Volume XIV.
23. Otsu, N. A Threshold Selection Method from Gray-Level Histograms.IEEE Trans. Syst. Man. Cybern.1979,9, 62–66. [CrossRef]
24. Marquardt, D.W. An algorithm for least-squares estimation of non-linear parameters.J. Soc. Ind. Appl. Math.
1963,11, 431–441. [CrossRef]
25. Sugeno, M. An introductory survey of fuzzy control.Inf. Sci.1985,36, 59–83. [CrossRef]
26. Yager, R.R.; Rybalov, A. Full reinforcement operators in aggregation techniques. IEEE Trans. Syst. Man
Cybern. Part B1998,28, 757–769. [CrossRef] [PubMed]
27. Calvo, T.; Mayor, G.; Mesiar, R. Aggregation Operators: New Trends and Applications; Physica: Berlin/Heidelberg, Germany, 2012.
28. Rekik, A.; Zribi, M.; Benjelloun, M.; Ben Hamida, A. A k-means clustering algorithm initialization for unsupervised statistical satellite image segmentation. In Proceedings of the 2006 1ST IEEE International Conference on E-Learning in Industrial Electronics, Hammamet, Tunisia, 18–20 December 2006; pp. 11–16. [CrossRef]
29. Mitra, S.; Kundu, P.P. Satellite image segmentation with Shadowed C-Means.Inf. Sci.2011,181, 3601–3613. [CrossRef]
30. Pal, S.K.; Mitra, P. Multispectral image segmentation using the rough-set-initialized EM algorithm.
IEEE Trans. Geosci. Remote Sens.2002,40, 2495–2501. [CrossRef]
31. Bandyopadhyay, S.; Maulik, U. Genetic clustering for automatic evolution of clusters and application to image classification.Pattern Recognit.2002,35, 1197–1208. [CrossRef]
32. Omkar, S.N.; Kumar, M.M.; Mudigere, D.; Muley, D. Urban Satellite Image Classification using Biologically Inspired Techniques. In Proceedings of the IEEE International Symposium on Industrial Electronics, Vigo, Spain, 4–7 June 2007; pp. 1767–1772. [CrossRef]
33. Kanellopoulos, I.; Wilkinson, G.G. Strategies and best practice for neural network image classification.Int. J.
34. Ross, T.J.Fuzzy Logic with Engineering Applications; John Wiley & Sons: Chichester, UK, 2009.
35. Mendel, J.M.Uncertain Rule-Based Fuzzy Logic Systems: Introduction and New Directions; Prentice Hall PTR: Upper Saddle River, NJ, USA, 2001.
36. Mamdani, E.H.H.; Assilian, S. An experiment in linguistic synthesis with a fuzzy logic controller.Int. J. Man
Mach. Stud.1975,7, 1–13. [CrossRef]
37. Nedeljkovic, I. Image classification based on fuzzy logic.Int. Arch. Photogramm. Remote Sens. Spat. Inf. Sci.
2004,34, 685.
38. Ruthenberg, H.; MacArthur, J.D.Farming Systems in the Tropics; Clarendon Press: Oxford, UK, 1980. 39. Rouse, J.W.; Haas, R.H.; Schell, J.A.; Deering, D.W.Monitoring the Vernal Advancement and Retrogradation
(Green Wave Effect) of Natural Vegetation; Technical Report for Texas A&M University; Texas A&M University:
College Station, TX, USA, 1974.
40. Garcia, M.L.; Caselles, V. Mapping burns and natural reforestation using Thematic Mapper data.Geocarto Int.
1991,6, 31–37. [CrossRef]
41. Rand, M. Objective Criteria for the Evaluation of Methods Clustering.J. Am. Stat. Assoc.1971,66, 846–850. [CrossRef]
![Figure 3. (a) Land cover ground-truth classification as published by Temudo et al. [2]; (b) Fuzzy-Fusion (FF)-Uninorm classification; (c) FF-Uninorm classification after applying a mean filtering.](https://thumb-eu.123doks.com/thumbv2/123dok_br/16697054.743862/8.892.125.767.288.510/classification-published-uninorm-classification-uninorm-classification-applying-filtering.webp)