IOP Conference Series: Materials Science and Engineering
PAPER • OPEN ACCESS
Hydraulic Conductivity of the Permeable Asphalt Pavement – Laboratory
vs In Situ Test
To cite this article: Marcia Lopes Afonso et al 2019 IOP Conf. Ser.: Mater. Sci. Eng. 471 022023
View the article online for updates and enhancements.
Content from this work may be used under the terms of theCreative Commons Attribution 3.0 licence. Any further distribution of this work must maintain attribution to the author(s) and the title of the work, journal citation and DOI.
Published under licence by IOP Publishing Ltd
WMCAUS 2018
IOP Conf. Series: Materials Science and Engineering 471 (2019) 022023
IOP Publishing doi:10.1088/1757-899X/471/2/022023
1
Hydraulic Conductivity of the Permeable Asphalt Pavement –
Laboratory vs In Situ Test
Marcia Lopes Afonso 1, Tiago Silva Santos 2, Cristina Sena Fael 1,Marisa Dinis-Almeida 1
1 C-MADE, Centre of Materials and Building Technologies, University of Beira
Interior, Calçada Fonte do Lameiro, Edifício II das Engenharia, 6200-358 Covilhã, Portugal
2 University of Beira Interior, Calçada Fonte do Lameiro, Edifício II das Engenharia,
6200-358 Covilhã, Portugal [email protected]
Abstract. Permeable asphalt pavements (PAP) are a key measure for mitigating the climate change effects in urban areas. Cities are becoming increasingly dense and have large areas of waterproofing due to the excessive construction of buildings and highways that prevent the rainwater drainage into the soil. Recently, the PAP study with a double layer porous asphalt (DLPA) has been an alternative to the use of a porous asphalt single layer (PA), with recognized advantages in increasing water infiltration and, consequently, in decreasing surface runoff. It was developed in field a PAP of small dimensions to assess its capacity to respond to floods. The purpose of this study is to evaluate the hydraulic conductivity (K) of the DLPA applied on the PAP, both in laboratory conditions and in field conditions, and verify the representativeness of the laboratory results in relation to the results obtained in situ. In laboratory terms, the LCS permeameter was used, which evaluates the vertical and horizontal hydraulic conductivity, both in specimens produced in the laboratory and in cores extracted in situ. In the field, the LCS permeameter and the falling head permeameter were used to measure the hydraulic conductivity and the relative hydraulic conductivity (HC), respectively. The laboratory tests were performed according to Standards EN 12697-19 and NLT 327 and the in situ tests according to Standards EN 12697-40 and NLT 327. It was verified that the specimens produced in the laboratory of the two porous layers showed values of K (vertical and horizontal) lower than those obtained in the field cores, both for the individual layers PA and for the DLPA. Thus, it was found that the study in controlled environment differs in terms of results. This divergence justified the need to perform a field study in order to perceive the actual performance of the PAP surface layer. This study was characterized by the values of K (m/s) and HC (s-1), from which it was not possible to
obtain a relation. From this study it was concluded that the measuring methods of the hydraulic conductivity in the laboratory were close to the behaviour of the same in situ, however its evaluation under real conditions is always essential.
1. Introduction
Excessive construction and waterproofing of natural soils in cities has been a problem for society. The main consequences associated with this waterproofing have a negative impact on the increase in the rainwater volume (flooding), the increase of the heat island effect urban and the contamination of the runoff water [1–3]. Permeable pavements emerged as a mitigation measure for these problems,
WMCAUS 2018
IOP Conf. Series: Materials Science and Engineering 471 (2019) 022023
IOP Publishing doi:10.1088/1757-899X/471/2/022023
2
integrating Sustainable Urban Drainage Systems (SuDS) [4–7]. Concretely, permeable asphalt pavements (PAP) have a completely porous structure, which allows the reduction of surface flow and allows the precipitated water to be mostly infiltrated and sent to the subsoil, if it has drainage capacity, or stored in a reservoir for future uses. The permeable surfaces of these pavements, namely the porous asphalt (PA), consist of a aggregates group, mainly coarse, that are arranged in such a way that the voids between them allow the infiltration of the waters, obtaining a voids content between 18 and 20% and thus a high permeability [8]. The pavements clogging with porous surfaces leads to the permeability loss, being this the main problem pointed to the PA application, highlighted in several studies [9,10]. This problem is mainly due to the deposition of long-term sediments from vehicle debris and/or transported by surface runoff from the adjacent impervious areas. Thus, the use of a double layer porous asphalt (DLPA) on the pavement surface attenuates the clogging unfavourable effects and, consequently, facilitates water drainage through the filter effect achieved by the two layers [11].
The in situ infiltration capacity of PAP and their hydraulic performance have been widely evaluated by the measurement of surface hydraulic conductivity. The hydraulic conductivity or permeability translates the greater or lesser ease with which the water moves in a determined pavement and depends on the fluid characteristics, the porous medium (texture and structure) and its water content [12,13]. Different devices and methods are known for directly measuring in situ hydraulic conductivity, such as single-ring and double-ring infiltrometers [9,14,15], falling or constant head permeameter and the LCS permeameter (Laboratorio de Caminos de Santander) [15–17]. Several studies with different surfaces in permeable pavements have been carried out in terms of the superficial hydraulic conductivity evaluation, such as porous concrete (PC), permeable interlocking concrete pavements (PICP), precast concrete blocks and plastic grid pavers [16–22]. Sañudo-Fontaneda et al. [23] carried out an in-depth investigation of the PMPC (polymer-modified porous concrete) permeable pavements hydraulic behaviour and PA, through the LCS permeameter in a parking lot after 5 years in service. Parkings with PMPC reduced the infiltration capacity from 0.020 m/s to 0.0041 m/s (79.43 %), while parking lots with porous asphalt reduced from 0.012 m/s to 0.0022 m/s (82.04 %). The study verified that the PA surface did not present significant differences of infiltration capacity between the different points studied in the parking lots compared to the porous concrete. Using the LCS permeameter in situ, with different surfaces, Fernández-Barrera et al. [16], obtained average discharge times of 21 s for surfaces with precast concrete blocks and porous asphalt under light traffic. While the porous asphalt surface with greater traffic intensity led to irregular values between about 50 s and above 1800 s, indicating that it needs maintenance in some areas to recover the infiltration. In a larger study, Al-Rubaei et al. [9] evaluated, through the double-ring infiltrometer, two porous asphalt pavements, which after 18 and 24
years in service had a substantially lower infiltration capacity than the initial one (> 4.8x10⁻³ m/s to
about 0.8x10⁻⁵ and 0.4x10⁻⁵ m/s) due to surface obstruction. Kumar et al. [14] also analysed the
infiltration capacity with the double-ring infiltrometer of several permeable pavements, including PA,
which decreased its hydraulic conductivity from 31.1x10⁻³ m/s to 9.1x10⁻³ m/s at the end of 4 years of
service. Regarding the infiltration capacity evaluation and the hydraulic performance in laboratory conditions, the permeameter of the European Standard EN 12697-19 [24] and the Spanish Standard NLT-327 [25] have been used, the latter although it has been developed for in situ assays it is also suitable for use in laboratory tests. Marchioni et al. [21] showed in the laboratory that the simulated rainfall intensity did not produce significant differences in the discharge time of PC and PA slabs using the permeameter of EN 12697-19, through which they obtained times between 20 and 105 s in PA slabs. From the different devices in situ, stand out the falling head permeameter and the LCS permeameter. The falling head permeameter method is described in European Standard EN 12697-40 [26], which indicates the results as a relative hydraulic conductivity (in s-1) resulting from the combination of vertical
and horizontal hydraulic conductivity [12]. The LCS permeameter measures the infiltration capacity according to the Spanish Standard NLT-327, which provides a logarithmic equation from which the hydraulic conductivity is determined (in m/s). Similarly, in laboratory the European Standard EN 12697-19 presents a constant head permeameter, similar to the LCS permeameter with the proper adjustments
WMCAUS 2018
IOP Conf. Series: Materials Science and Engineering 471 (2019) 022023
IOP Publishing doi:10.1088/1757-899X/471/2/022023
3
m/s) are obtained. The results obtained with these permeameters depend strongly on the test conditions, namely cracks, humidity and temperature [16]. However, it is difficult to compare the results of hydraulic conductivity, both between the different field methods and between these and laboratory methods. Fernández-Barrera et al. [16] state that samples taken from the pavement surface, subsequently tested in a laboratory, may not simulate the actual conditions to which the pavement is subjected and therefore in situ permeameters must also be used. To compare hydraulic conductivity results, it is essential to obtain the measurement parameter by the same methods wherever possible [12]. The comparative study performed by Maupin [27] between cores pavement and laboratory-produced test specimens, using falling head tests, showed inconsistency in the hydraulic conductivity values, which it was generally higher in field cores due to the existence of excessive voids. Gogula et al. [28] carried out comparative studies of laboratory and field tests, also with the principle of falling head, and obtained hydraulic conductivity values in the field much higher than those of the laboratory. The differences in this study are justified by the lack of horizontal flow limitation in field tests, since the same test principle was used. The results obtained with EN 12697-40 are not directly comparable with the results of other methods, such as those obtained by EN 12697-19. Even the permeameters used in situ, falling head and LCS, are not comparable to each other. The method described in EN 12697-40 only allows to establish changes in infiltration capacity over time, whereas the method described in NLT-327 allows, in addition to the characterization over time, to compare with other methods that follow the falling head principle, obtaining a hydraulic conductivity.
Hydraulic conductivity is one of the most important properties of a water permeable medium, such as permeable asphalt pavements, and has been the research subject by several studies. However, there is still a need to evaluate it in comparative terms between different methods used in the laboratory and in situ. Jiang et al. [29] report the importance of the permeable pavements construction with different materials combination and layers thickness, as well as obtaining relationships between laboratory and field results. In view of this need, a PAP with DLPA was constructed on the applied surface in a parking lot. The research objective was to evaluate the PAP behaviour relating to the hydraulic conductivity and to compare the results obtained by laboratory and in situ methods. To do this, in laboratory were tested laboratory produced test specimens and cores extracted from field slabs and, in situ a scheme was defined with different test points in three parking spaces, measuring the discharge time through the LCS permeameter and the falling head permeameter.
2. Methodology
The present investigation was carried out in a car parking built in August 2017 in the municipality of Covilhã (Portugal) with 37.5 m2, consisting of three spaces with dimensions of 2.5x5 m. The PAP
characterization was performed after 4 and 7 months of the parking lot being in operation for light traffic, without performing any maintenance operation. Since the car park is inserted in a leisure area, it is expected that it will be used mainly by light vehicles which leads to a less pavement surface layer deterioration.
The PAP structure studied is composed of a reservoir with 15/25 aggregate and 25 cm thick, a regularization layer with 5/15 aggregate and 9 cm thick and a 7 cm thick DLPA surface layer. Generally, the DLPA is composed of a porous asphalt with fine aggregates to the surface with 3 cm (PA1), followed by a porous asphalt with thick aggregates of 4 cm thickness (PA2). The set of PA1 and PA2 mixtures acts as a filter that makes it difficult to pass sediments to the next layers, leading to the clogging effect attenuation in PAP. The specific characteristics of DLPA can be verified in the study by Afonso et al. [30].
The study focused on the hydraulic conductivity of PAP characterization in the laboratory and in situ. In the laboratory, cores and test specimens were analysed using the falling head permeameter, in accordance with EN 12697-19 and NLT-327. In situ, two permeameters were used, one according to EN 12697-40 and one according to NLT-327. In order to carry out the in situ tests, a scheme was defined with the mark of 2 points in each parking space, in which 3 measurements were made at each point. The analysis of different points importance within a set of parking lots has been highlighted in previous
WMCAUS 2018
IOP Conf. Series: Materials Science and Engineering 471 (2019) 022023
IOP Publishing doi:10.1088/1757-899X/471/2/022023
4
studies in order to obtain the infiltration capacity behaviour of a car park with permeable pavements [23,31]. The methodology used is described in more detail in the following sections.
2.1. Laboratory hydraulic conductivity
The hydraulic conductivity characterization in the laboratory was performed according to the European Standard EN 12697-19 [24] and the Spanish Standard NLT-327 [25], which refer to different test devices, namely a constant head permeameter and a falling head permeameter, respectively. Both are based in Darcy's law. In this sense, a falling head device was used, similar to the LCS permeameter of
Standard NLT-327 to measure Kv and Kh in cylindrical compacted specimens in the laboratory and in
cores extracted from the field PAP.
The test method was based on the discharge time measurement at which a known amount of water
(1.735 l) takes to drain into a sample. The Kv test, which represents a unidirectional flow, parallel to the
compaction direction, consisted of placing the sample inside a rubber sleeve that wrapped around the
perimeter, leaving only the sample faces free. The Kh test, perpendicular to the compaction direction,
which represents the runoff conditions during a rainfall, consisted of placing paraffin on the underside of the sample and the sealing of the junction between the permeameter tube and the upper face. In both situations, K was determined based on Darcy's law, according to equation (1).
𝐾 =
∆ × ln (1)
where K is the hydraulic conductivity (m/s), a is the area of the permeameter section (m2), A is the
section area of the specimen (m2), L is the average height of the specimen (m), Δt is the time interval for
the water level to pass from h1 to h2 (s), h1 is the maximum hydraulic load above the underside of the
specimen (m) and h2 is the minimum hydraulic load above the underside of the specimen (m). The EN
12697-19 standard recommends intervals for K between 0.5 and 3.5x10⁻³ m/s, but does not specify the
type of mixtures covered.
The samples tested were divided into two groups, corresponding to the test specimens of the PA1 and PA2 mixtures produced in the laboratory and to the cores extracted from the field slabs for the same mixtures. In order to simulate the DLPA in the laboratory, the cores PA1 were overlaid on the cores PA2, thus constituting the PAP complete double surface layer. The number of samples tested corresponded to 4 test specimens with dimensions of about 100 mm in diameter and thicknesses of about 60 mm for the two mixtures. The four samples extracted in the field had dimensions of about 100 mm in diameter and thicknesses of about 30 and 40 mm for the mixtures PA1 and PA2, respectively, totalling in the set (DLPA) a thickness of 70 mm.
2.2. In situ hydraulic conductivity
The in situ hydraulic conductivity of the PAP surface was obtained through the use of two variable load test equipments: the LCS permeameter developed in Spain (Laboratorio de la Cátedra de Caminos de
Santander) in accordance with Spanish Standard NLT-327 [25] and the falling head permeameter in
accordance with European Standard EN 12697-40 [26].
NLT-327 describes the method for obtaining in situ hydraulic conductivity of porous asphalt used in pavement surfaces. The LCS permeameter described in the standard allows to measure the infiltration capacity as a function of the time that a certain surface needs to infiltrate a known water height. The procedure consists in timing the discharge time, in seconds, that the water level takes to percolate through the porous surface, corresponding to the volume between the maximum and minimum hydraulic load of the permeameter tube. The water volume drained by the pipe is 1.735 l, with a diameter of 94 mm and a height of 250 mm. The outflow time (t, in s) corresponds to the surface hydraulic conductivity
(K, x10-2 cm/s) or in situ permeability, determined with a logarithmic expression defined by equation
WMCAUS 2018
IOP Conf. Series: Materials Science and Engineering 471 (2019) 022023
IOP Publishing doi:10.1088/1757-899X/471/2/022023
5
ln 𝐾 = 7.624 1.348 ln 𝑡 (2)
EN 12697-40 describes the method for determining the relative hydraulic conductivity in situ of a permeable pavement surface. The test consists of determining the time required for a water fixed volume (4 l) to drain through a permeable surface. This outflow time (corrected for the 20 °C temperature) corresponds to the recording, in seconds, of the measurements obtained between the hydraulic loads corresponding to 5 and 1 l, identified in the equipment itself with a diameter of 125 mm. permeameter diameter is 125 mm and the diameter of the water infiltration area in the pavement is 48 mm. The relative hydraulic conductivity (HC, s-1) of each test point was obtained by equation (3) referred to in the
standard.
𝐻𝐶 = (3)
where t is the average outflow time (s) and r is the series resistance outflow time (s). The r parameter was determined by the average time recorded to drain the 4 l of water (10 replicates) when the permeameter was positioned with the free exit orifice, where r = 1.1 was obtained. The obtained HC results can’t be compared to other methods that use the hydraulic conductivity as standard measure, since the norm does not allow to obtain K through Darcy's Law, so the obtained results must be compared to each other and over time. An important requirement for measuring in situ hydraulic conductivity is to ensure that there is no water between the pavement surface and the permeameter base. Both equipment must be fixed to the study surface, which must be clean and free from detritus. These tests are of falling and variable load, whose flow is considered as laminar.
3. Results and discussion
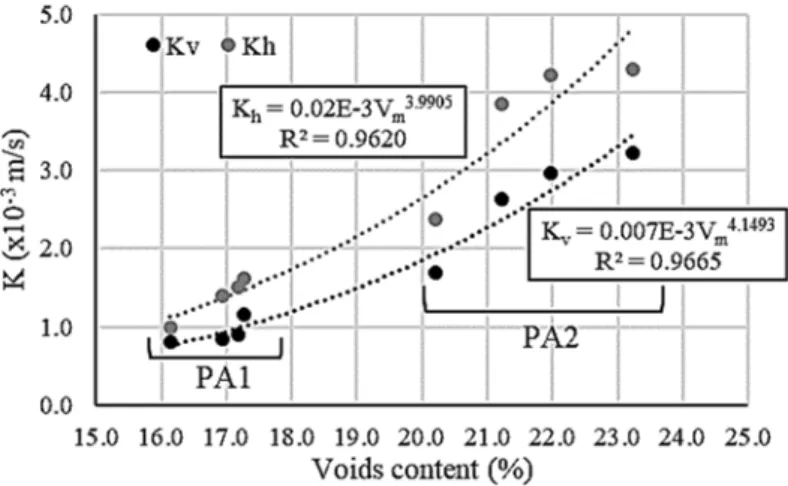
The results of Kv and Kh obtained in each specimen and in each core laboratory test are presented in
figures 1 and 2, respectively. The figures show the values for the PA1 and PA2 mixtures individually according to the voids content obtained, as indicated in EN 12697-19. It can be seen in figure 1 that the samples of the PA1 mixture have lower K values than the PA2 mixture, so the voids content of this mixture is clearly higher, as expected due to its composition with mostly coarser aggregates. By analysing individually, the samples of the PA1 mixture, the values obtained are very close to each other,
with a slight increase of Kv and Kh, depending on the voids content. With respect to the PA2 mixture,
the results are shown to be wider, where the K increase with the voids content is more clearly distinguished. Considering the results obtained and the void content range of the two mixtures (from
16.1 to 23.2 %), it was possible to obtain two equations that relate the hydraulic conductivity (Kv and
Kh) with the voids content (Vm). These equations show strong correlations, above 95 %, as can be observed in the same figure. In this way, the results show that the mixtures show anisotropic behaviour, presenting different hydraulic conductivity values in both directions.
WMCAUS 2018
IOP Conf. Series: Materials Science and Engineering 471 (2019) 022023
IOP Publishing doi:10.1088/1757-899X/471/2/022023
6
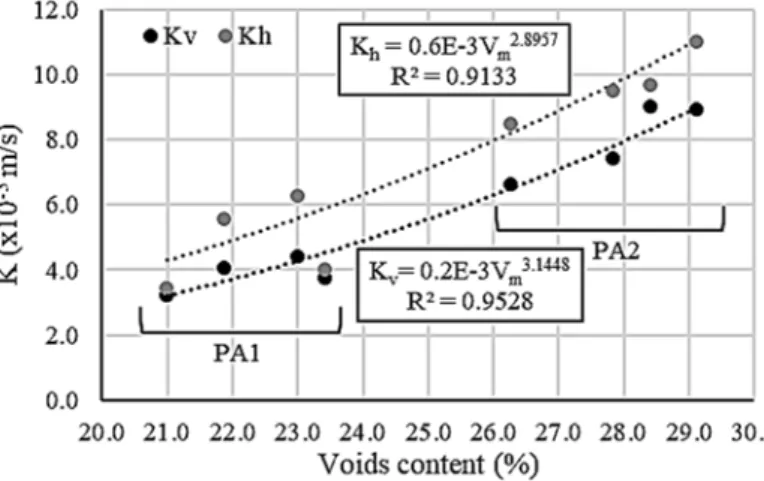
In figure 2, in the case of slabs in situ, higher values of voids content (from 21.0 to 29.1 %) are found than in the specimens, leading to K values also higher. This fact occurred due to the difficulty of extracting the cores in the slabs with excessive voids and disaggregation of the base peripheries, which led to the existence of a greater number of openings through which the water had more promptness to percolate, as observed Maupin [27]. This way, the exceedance of the values range indicated by EN
12697-19 (0.5 and 3.5x10⁻³ m/s) for K of the cores is justified, while the specimens practically meet
these limits. The PA2 mixture, due to the higher void content, shows superior results relative to the PA1 mixture. The results obtained allowed us to define two equations that determine the hydraulic conductivity (Kv and Kh) as a voids content function (Vm). In this case, the correlation was also strong, above 90 %, as can be observed in the figure. In the set of cores PA1 a decrease is noticed in the core conductivity with greater voids content, which would not be expected. This isolated point was due to a possible accumulation of binder located in the core bases that hindered the water passage and for that reason the hydraulic conductivity decreased. Thus, this point was not considered in the equation definition. It should be noted that the 4 cores tested from each mixture were drawn from a PA1 slab and a PA2 slab produced in central asphalt, however the results obtained in the 4 cores of the two slabs were different. This meets what Montes [32] described, noting that although the studied samples are taken from the same slab they can lead to different hydraulic conductivities. Therefore, the cores tested
behaviour, such as the specimens, presents anisotropy of K, as a result of the values of Kh being higher
than the same values of Kv.
Figure 2. Kv and Kh of cores extracted from field slabs
The results of K obtained for each sample, according to the production method, are shown in table 1. Differences between cores and specimens are observed, with K values significantly higher in situ cores, with mean percentage differences in PA1 mixture of 25 and 30 % and PA2 mixture of 34 and 39 % for
Kv and Kh, respectively. In addition to the individual analysis of the PA mixtures, the DLPA applied in
situ was also simulated through the field cores overlaying. As would be expected, the results obtained by the DLPA are close to those obtained with the cores PA1 and PA2, and the behaviour in the vertical and horizontal direction corresponds to that obtained in the cores PA1 and PA2, respectively.
Table 1. Results of K carried out in the laboratory on specimens and cores Kv (x10-3 m/s) Kh (x10-3 m/s) Sample number 1 2 3 4 1 2 3 4 Specimens produced in laboratory PA1 1.2 0.9 0.8 0.8 1.6 1.5 1.4 1.0 PA2 1.7 2.6 3.0 3.2 2.4 3.8 4.2 4.3 Cores extracted from
field slabs
PA1 3.2 4.4 4.1 3.8 3.5 6.3 5.6 4.0 PA2 9.0 8.9 6.6 7.4 9.7 11.0 8.5 9.5 DLPA 3.0 5.6 3.6 4.4 7.2 10.2 12.1 9.6
WMCAUS 2018
IOP Conf. Series: Materials Science and Engineering 471 (2019) 022023
IOP Publishing doi:10.1088/1757-899X/471/2/022023
7
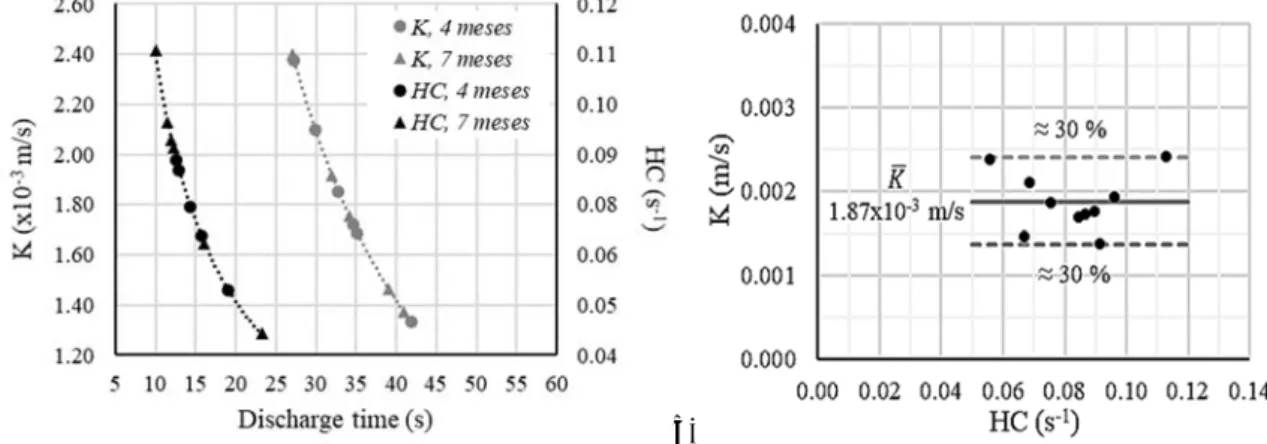
In order to assess the in situ behaviour of the DLPA in relation to the results obtained in the laboratory, the applied PAP was characterized by two permeameters, which measure the hydraulic conductivity as a combination of the flow in the vertical and horizontal directions. The results obtained by the two methods at each test point are shown in figure 3a). The figures presented refer to the two evaluations carried out after 4 and 7 months of parking lot construction. In both curves it is possible to observe a regular and coincident behaviour of the results obtained by K and HC. Due to this behaviour, and taking into account the short time between measurements over the pavement lifetime, the same it was not considered for the results analysis. Thus, the discharge times recorded are between 27.0 and
41.8 s and K varying between 2.4 and 1.3x10⁻³ m/s. K in PAP decreases with increasing discharge time
and differences between test sites are not significant, showing compliance in the results. The values of
K in permeable PA pavements vary according to the mixtures composition, type of aggregates, binders
and additives used, as well as their application in situ, namely by the type and compaction temperatures.
Some studies obtained higher K in permeable pavements with PA, of 12.0 and 31.1x10⁻³ m/s according
to Sañudo-Fontaneda et al. [23] and Kumar et al. [14], while others presented values in the order of
4.8x10⁻³ m/s [9]. It should be noted that the values of the mentioned studies correspond to the initial
infiltration capacity and present a great variability of results. Therefore, the K values obtained in this study, despite being smaller than other studies, are shown to be feasible according to the short pavement age.
The results of HC were obtained with water temperatures of 6 and 10 ºC that led to the discharge
times correction to the temperature of 20 ºC. Thus, HC presents values between 0.045 and 0.129 s-1 with
discharge times between 23.2 and 10.0 s, showing again results overlay. Since the falling head permeameter has distinct characteristics with respect to the LCS permeameter, the discharge times were lower, due to the higher hydraulic load considered in this test. It is also seen that, increasing the discharge time leads to the decrease of HC, as in K. In view of the previously impossibility of relating HC with K, it was considered fundamental to analyse the possible relation between them. Figure 3 b) shows this analysis and does not allow to identify any tendency of K in relation to HC, making it appear that K =
1.87x10⁻³ ± 0.0003 m/s is independent of HC.
a) b)
Figure 3. Analysis K and HC. a) Results obtained in situ; b) Variation of K with HC
Comparing the laboratory and in situ results, and considering K a combination of Kv and Kh, it is
verified that the samples PA1 and PA2 obtained very similar hydraulic conductivities to those obtained in the in situ evaluation. The results obtained by the cores PA1, PA2 and DLPA led to higher results already mentioned. Taking into account the differences in results, it is evident the need for on-site testing in order to characterize the PAP under real conditions.
WMCAUS 2018
IOP Conf. Series: Materials Science and Engineering 471 (2019) 022023
IOP Publishing doi:10.1088/1757-899X/471/2/022023
8 4. Conclusions
The permeable pavements use, such as SuDS systems, has become a more sustainable alternative to rainwater management, reducing the effects of soil sealing to pre-urbanization levels. This study evaluated and compared the DLPA performance for hydraulic conductivity under laboratory conditions and its application to a PAP under field conditions. The hydraulic conductivity values obtained in the laboratory are evidently higher in the samples extracted from the field compared to the samples produced
in the laboratory. The Kv of the cores PA1 determines the DLPA behaviour in the vertical direction of
the flow, while the Kh of the cores PA2 determines its behaviour in the horizontal direction. Given the
differences in results in a controlled environment, the in situ study searched a better understanding of the PAP performance under real conditions. Their characterization led to lower discharge times by the falling head permeameter due to a higher hydraulic load compared to the LCS permeameter. The analysis between K and HC, led to a mean value of PAP hydraulic conductivity characterization corresponding to the HC values obtained. From the research carried out, it is concluded that there is a significant difference between the hydraulic conductivity values obtained in the laboratory and in situ tests using the same measurement principles (variable and falling head permeameters). Since the study was carried out in a restricted area of a PAP, it is fundamental the study extension in the evaluation of the different permeable pavements behaviour in real conditions, both at the beginning of its construction and throughout the years of service. The tests carried out in this research may contribute to future developments and improvements of hydraulic conductivity specifications for porous asphalt.
Acknowledgments
This work is supported with Portuguese national funds by FCT - Foundation for Science and Technology within the UID/ECI/04082/2013 project and in the research work, funded by the Scientific Research grant SFRH/BD/131034/2017. The authors would like to thank the University of Minho for the use of the LCS permeameter.
References
[1] Burton GA, Pitt RE. Stormwater Effects Handbook. CRC Press LLC; 2001.
doi:10.1201/9781420036244.
[2] Fini A, Frangi P, Mori J, Donzelli D, Ferrini F. Nature based solutions to mitigate soil sealing in
urban areas: Results from a 4-year study comparing permeable, porous, and impermeable
pavements. Environ Res 2017;156:443–54.
doi:http://dx.doi.org/10.1016/j.envres.2017.03.032.
[3] Jacobson CR. Identification and quantification of the hydrological impacts of imperviousness in
urban catchments: A review. J Environ Manage 2011;92:1438–48.
doi:10.1016/j.jenvman.2011.01.018.
[4] Brattebo BO, Booth DB. Long-term stormwater quantity and quality performance of permeable
pavement systems. Water Res 2003;37:4369–76. doi:10.1016/S0043-1354(03)00410-X.
[5] Fletcher TD, Shuster W, Hunt WF, Ashley R, Butler D, Arthur S, et al. SUDS, LID, BMPs,
WSUD and more – The evolution and application of terminology surrounding urban drainage. Urban Water J 2015;12:525–42. doi:10.1080/1573062X.2014.916314.
[6] Lin W, Ryu S, Cho Y-H. A case study of flow characteristics of permeable pavements by time
and space model. Can J Civ Eng 2014;41:660–6. doi:10.1139/cjce-2013-0165.
[7] Rodríguez-Rojas MI, Huertas-Fernández F, Moreno B, Martínez G, Grindlay AL. A study of the
application of permeable pavements as a sustainable technique for the mitigation of soil sealing in cities: A case study in the south of Spain. J Environ Manage 2018;205:151–62. doi:10.1016/j.jenvman.2017.09.075.
[8] Roseen R, Ballestero T, Houle J, Briggs J, Houle K. Water quality and hydrologic performance
of a porous asphalt pavement as a storm-water treatment strategy in a cold climate. J Environ Eng 2012;138:81–9. doi:10.1061/(ASCE)EE.1943-7870.0000459.
WMCAUS 2018
IOP Conf. Series: Materials Science and Engineering 471 (2019) 022023
IOP Publishing doi:10.1088/1757-899X/471/2/022023
9
porous asphalt pavements in Northern Sweden. J Irrig Drain Eng 2013;139:499–505. doi:10.1061/(ASCE)IR.1943-4774.0000569.
[10] Haselbach LM. Potential for Clay Clogging of Pervious Concrete under Extreme Conditions. J Hydrol Eng 2010;15:67–9. doi:10.1061/(ASCE)HE.1943-5584.0000154.
[11] Hamzah MO, Abdullah NH, Voskuilen JLM, van Bochove G. Laboratory simulation of the clogging behaviour of single-layer and two-layer porous asphalt. Road Mater Pavement Des 2013;14:107–25. doi:10.1080/14680629.2012.749803.
[12] Kuosa H, Niemeläinen E, Korkealaakso J. Pervious pavement testing methods. State-of-the-Art an laboratory and field guideline for performance assessment. Clim Adapt Surfaces Cl 2014:62.
[13] Kuang X, Sansalone J, Ying G, Ranieri V. Pore-structure models of hydraulic conductivity for permeable pavement. J Hydrol 2011;399:148–57. doi:10.1016/j.jhydrol.2010.11.024.
[14] Kumar K, Kozak J, Hundal L, Cox A, Zhang H, Granato T. In-situ infiltration performance of different permeable pavements in a employee used parking lot - A four-year study. J Environ Manage 2016;167:8–14. doi:10.1016/j.jenvman.2015.11.019.
[15] Li H, Kayhanian M, Harvey JT. Comparative field permeability measurement of permeable pavements using ASTM C1701 and NCAT permeameter methods. J Environ Manage 2013;118:144–52. doi:10.1016/j.jenvman.2013.01.016.
[16] Fernández-Barrera AH, Castro-Fresno D, Rodríguez-Hernández J, Calzada-Pérez MA. Infiltration capacity assessment of urban pavements using the LCS permeameter and the CP infiltrometer. J Irrig Drain Eng 2008;134:659–65. doi:10.1061/(ASCE)0733-9437(2008)134:5(659).
[17] Sañudo-Fontaneda LA, Rodriguez-Hernandez J, Calzada-Pérez MA, Castro-Fresno D. Infiltration behaviour of polymer-modified porous concrete and porous asphalt surfaces used in SuDS techniques. Clean - Soil, Air, Water 2014;42:139–45. doi:10.1002/clen.201300156. [18] Boogaard F, Lucke T, Beecham S. Effect of age of permeable pavements on their infiltration
function. Clean - Soil, Air, Water 2014;42:146–52. doi:10.1002/clen.201300113.
[19] Gomez-Ullate E, Castillo-Lopez E, Castro-Fresno D, Bayon JR. Analysis and contrast of different pervious pavements for management of storm-water in a parking area in Northern Spain. Water Resour Manag 2011;25:1525–35. doi:10.1007/s11269-010-9758-x.
[20] Lucke T, White R, Nichols P, Borgwardt S. A simple field test to evaluate the maintenance requirements of permeable interlocking concrete pavements. Water (Switzerland) 2015;7:2542–54. doi:10.3390/w7062542.
[21] Marchioni M, Andrés-Valeri VC, Giustozzi F, Becciu G. Laboratory study on the rainfall influence over the sediment transport dynamics on pervious pavements’ discharge. Urban Water Syst Floods 2016;165:165–76. doi:10.2495/UW160151.
[22] Valinski NA, Chandler DG. Infiltration performance of engineered surfaces commonly used for
distributed stormwater management. J Environ Manage 2015;160:297–305.
doi:10.1016/j.jenvman.2015.06.032.
[23] Sañudo-Fontaneda LA, Andrés-Valeri VCA, Rodriguez-Hernandez J, Castro-Fresno D. Field study of infiltration capacity reduction of porous mixture surfaces. Water (Switzerland) 2014;6:661–9. doi:10.3390/w6030661.
[24] EN 12697-19. Bituminous mixtures - Test methods for hot mix asphalt - Part 19: Permeability of specimen. Eur Stand ICS 9308020, Eur Comm Stand Brussels 2012.
[25] NLT-327. Permeabilidad in situ de pavimentos drenantes con el permeámetro LCS. Madrid Cent Estud Y Exp Obras Públicas (CEDEX), Lab La Cátedra Caminos Santander 2000.
[26] EN 12697-40. Bituminous mixtures - Test methods for hot mix asphalt - Part 40: In situ drainability. Eur Stand ICS 9308020, Eur Comm Stand Brussels 2012.
[27] Maupin G. Asphalt Permeability Testing in Virginia. Transp Res Rec J Transp Res Board 2000;1723:83–91. doi:10.3141/1723-11.
WMCAUS 2018
IOP Conf. Series: Materials Science and Engineering 471 (2019) 022023
IOP Publishing doi:10.1088/1757-899X/471/2/022023
10
Values for the Superpave Pavements. Proc 2003 Mid-Continent Transp Res Symp Ames, Iowa 2003.
[29] Jiang W, Sha A, Xiao J, Li Y, Huang Y. Experimental study on filtration effect and mechanism of pavement runoff in permeable asphalt pavement. Constr Build Mater 2015;100:102–10. doi:10.1016/j.conbuildmat.2015.09.055.
[30] Afonso ML, Dinis-Almeida M, Fael CS. Study of the porous asphalt performance with cellulosic fibres. Constr Build Mater 2017;135:104–11. doi:10.1016/j.conbuildmat.2016.12.222. [31] Kayhanian M, Anderson D, Harvey JT, Jones D, Muhunthan B. Permeability measurement and
scan imaging to assess clogging of pervious concrete pavements in parking lots. J Environ Manage 2012;95:114–23. doi:10.1016/j.jenvman.2011.09.021.
[32] Montes H. Measuring hydraulic conductivity in pervious concrete. Environ Engeneering Sci 2006;23:960–9. doi:10.1089/ees.2006.23.960.