The water quality investigation using GIS and multivariable analysis
in a semiarid region reservoir
1Investigação da qualidade das águas em reservatório do semiárido usando
geoprocessamento e análise multivariada
Deborah Mithya Barros Alexandre2*, Eunice Maia de Andrade3, Fernando Bezerra Lopes4, Helba Araújo
Queiroz Palácio5 e Andrea Cristina da Silva Ferreira2
Abstract - This study was carried out in the Serrote reservoir, sited in the Groaíras watershed at the northeastern region of Ceará State, Brazil. The aim was to investigate the temporal and spatial variability of water quality. Data investigation was processed using multivariate analysis/cluster analysis and GIS techniques. Samples were taken in four stations spreading out over the water body during five campaigns of collection (February, May, August/2007 and May, August/2008). The water quality parameters analyzed were: Electric Conductivity (EC), pH, Dissolved Oxygen (DO), temperature, chlorophyll ‘a’ concentration and Total Phosphorus (TP). Two homogeneous groups were identified, which expressed the inter-annual seasonality influence in the water quality. The highest concentration of investigated attributes occurred in 2008. At that year, the depth of the annual rainfall was 53% above the annual average. Chlorophyll ‘a’ and total phosphorus defined the dissimilarity between the two groups. Group 1 was composed with the better water quality and concentrations of attributes were close to the recommended limit defined by resolution 357/05 of CONAMA. Whereas Group 2 presented average concentrations of chlorophyll ‘a’ and total phosphorus two times greater than the ones registered in Group 1, there for been above the limit established by CONAMA (357/05) for human consumption. The reservoir presents characteristics that point toward eutrophization due to the use and management of the soil around said reservoir.
Key words - Water quality. Cluster Analysis. Eutrophization.
Resumo - Este estudo foi conduzido no açude Serrote (barragem Edson Queiroz), localizado na bacia do rio Groaíras, no norte do estado do Ceará, objetivando-se investigar a variabilidade espaço-temporal da qualidade da água. Foram coletadas amostras de água em quatro pontos do corpo hídrico, durante os meses de fevereiro, maio e agosto de 2007 e maio e agosto de 2008, totalizando cinco campanhas. Os parâmetros considerados neste estudo foram Condutividade Elétrica da água (CE), potencial hidrogeniônico (pH), oxigênio dissolvido (OD), temperatura (T), fósforo total (P) e clorofila ‘a’. As investigações dos dados foram realizadas pelo emprego de análise multivariada (análise de agrupamento) e técnicas de geoprocessamento. Dois grupos homogêneos foram formados independentes do ponto de amostragem, expressando assim, a maior influência da sazonalidade interanual. O estudo mostrou que as maiores concentrações dos elementos investigados foram registrados no ano de 2008, que apresentou totais pluviométricos superiores a média normal em 53%. A dissimilaridade entre os dois grupos foi definida pela clorofila ‘a’ e o fósforo total. O grupo 1 apresentou águas de melhor qualidade, com concentrações em torno dos limites estabelecidos pelo CONAMA (357/05). Já o grupo 2 apresentou concentrações médias da clorofila ‘a’ e do fósforo total duas vezes superiores as registradas no grupo 1, estando as mesmas sempre superiores aos limites estabelecidos pelo CONAMA (357/05) para consumo humano. O reservatório apresenta características próprias indicativas de eutrofização, em decorrência do clorofila ‘a’ e do fósforo total, que variaram de acordo com o uso e o manejo do solo no entorno do reservatório.
Palavras-chave - Água-qualidade. Análise por agrupamento. Eutrofização. * Corresponding author
1Received 05/02/2010; accepted 26/09/2010
Pesquisa desenvolvida com dados disponibilizados pela Companhia de Gestão de Recursos Hídricos do Estado do Ceará/COGERH
2Companhia de Gestão dos Recursos Hídricos do Estado do Ceará/COGERH, Ceará, Brasil, deborahm_barros@yahoo.com.br; andcrisfe@gmail.com 3Departamento de Engenharia Agrícola, CCA/UFC, Fortaleza-CE, Brasil, eandrade@pq.cnpq.br
4Departamento de Engenharia Agrícola, CCA/UFC, Fortaleza-CE, Brasil, lopesfb@yahoo.com.br
Introduction
In the nowadays the humanity is facing a situation where sustainable natural resource management has become more important than supplying products for development, due to the need and the urgency for the preservation of these resources for human survival (DUMANSKI; PIERI, 2000). In fact, studies related to the water quality, the usage and coverage of soil, the structure of the landscape and the risk of erosion are indispensable for learning the support level of the natural resources and for defining a sustainable form of usage (SHRESTHA; KAZAMA, 2007).
Many research projects attempt to observe the consequences of land use, associating pollution of the water bodies with the urban areas and domestic sewage, partially treated or not, with industrial waste, as well as the impermeability of large watershed areas (KAZI et al., 2009). It is estimated that around 80% of the sewage collected in cities, towns and small villages are not treated and, usually, are dumped into the closest spring (MONAGHAN et al., 2009). In the rural areas, the pollution is from a variety of origins and largely due to the runoff from agricultural areas and the return flow of irrigation, associated with the sediments, nitrogen enriched fertilizers and phosphates as well as pesticides (CASTRO; MEMDONÇA, 2004). The overland flow in livestock areas is also associated with manure, which is rich in nutrients and coliform material (FIGUEIRÊDO et al., 2006; LOPES et al., 2009).
For effective monitoring of water quality, the different variables that characterize them and indicate their quality must be monitored. However, in general, these variables are correlated which makes it difficult to have a clear understanding of how they are inter-related and make a decision of the measures to be implemented (ANDRADE et al., 2007; BRITO et al., 2006). Using multivariate statistics techniques, it is possible to define the relationships among the variables. This technique aids in the definition of the statistically significant variables in the system being studied and gives evidence of the possible similar clusters that may result in a smaller number of samples or collection campaigns (ANDRADE et al., 2008; GIRÃO et al. 2007).
The current study aims to investigate the water quality parameters and identify the spatial or temporal similarity between these parameters by employing hierarchical cluster analysis and geo-processing. The database of the water quality monitoring network of the Serrote reservoir was used to analysis and it was made available by the Ceará Water Resource Management Company.
Materials and methods
The Serrote reservoir is located in the Santa Quitéria County, in northern Ceará, on the Groaíras River, which is part of the Acaraú River drainage system (FIG. 1). The tributary watershed for the Serrote reservoir encompasses an area of 1,765 km2 and the reservoir area is 26,600 ha,
with can stored 251 hm3 of water and regulated a flow of
2.46 m3 s-1 (SRH, 2005).
The climate of the region is classified as BSw’h’ (semiarid and hot with a dry season (July to January) and a rainy season (February to June). The average temperature in the dry season is 26.8 ºC, the average maximum temperature is 34.7 ºC and the minimum average temperature is 22.1 ºC. The average monthly potential evaporation is 197 mm. In the rainy season, the average temperature is 26.4 ºC, the average maximum is 31.4 ºC and the minimum average is 22.0 ºC, the average monthly potential evaporation is 108 mm and the average annual precipitation is 800 mm. The predominant wind direction during the dry season is SE, the velocity varies from 2.6 to 3.7 m s-1 and, in the rainy season it is NE,
varying between 1.7 and 2.5 m s-1 (SRH, 2005).
The water was collected in the months of February, May and August of 2007 and May and August of 2008. The samples were taken sub-superficially (0.30 m) at four locations (P1, P3, P4 and P5), representative of the Serrote reservoir (FIG. 2).
The Electric Conductivity (EC), pH, Dissolved Oxygen (DO) and Temperature (T) were obtained through multi-parametric sensor YSI, while the concentrations of chlorophyll ‘a’ and of total phosphorus were obtained according to the procedures described in the Standard Methods for the Examination
of Water and Wastewater (APHA, 2005).
The similarity of measured variables was defined by the Custer Analysis Technique. Cluster Analysis groups cases into classes based on similarities within a class and dissimilarities among different classes. To perform Cluster Analysis, an agglomerative hierarchical clustering was developed using a combination of the Ward’s linkage method and squared Euclidean distances as a measure of similarity. In this case, the Euclidian quadratic distance measure was adopted, which represents similarity by closeness among observations of given variables (ANDRADE et al., 2008). In this method, the distance between two groupings is the sum of the squares between them, performed on all variables. At each stage of the grouping procedure, the internal sum of the squares is minimized on all partitions (the complete set of ungrouped or separate groupings) that may be obtained by the combination of two aggregates from the previous step (SEIDEL et al., 2008).
Figure 1 - Location of the Serrote reservoir, Santa Quitéria, Ceará
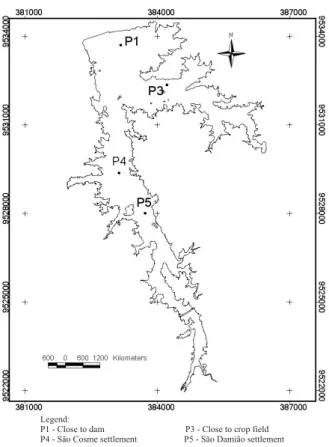
Figure 2 - Location of the Serrote reservoir watershed monitoring points, in Santa Quitéria, Ceará
The software used was the Statistical Package
for the Social Sciences - SPSS for Windows v. 16.0. The
variations of the studied variables were investigated using geo-processing techniques to obtain the variation surfaces. The method adopted was that of kriging interpolation in the software SURFER 7.0.
Results and Discussion
The Serrote reservoir was at approximately half its maximum capacity throughout the entire year of 2007, with a residency time - TR (ratio between the volume of the reservoir and its affluent flow) elevated, in the order of 1,000 days. However, in 2008 the reservoir poured for 48 days between the months of April and May (FIG. 3) and its TR was reduced to 400 days. The TR indicates the strong correlation between the stored volume and the water quality. The greater the TR the greater will be the tendency for organic and inorganic material to remain in the system for a longer time, affecting some limnological characteristics.
Cluster analysis
The number of clusters was defined by the percentage variation between the coefficients of the two consecutive groups (TAB. 1). It can be seen, amongst the 19 grouping numbers, that the first large percent variation
Legend:
P1 - Close to dam P3 - Close to crop field P4 - São Cosme settlement P5 - São Damião settlement
0 140 280 420 560 700 840 980 1120 1260 1400 1 /1 /2 0 0 7 1 /2 /2 0 0 7 1 /3 /2 0 0 7 1 /4 /2 0 0 7 1 /5 /2 0 0 7 1 /6 /2 0 0 7 1 /7 /2 0 0 7 1 /8 /2 0 0 7 1 /9 /2 0 0 7 1 /1 0 /2 0 0 7 1 /1 1 /2 0 0 7 1 /1 2 /2 0 0 7 1 /1 /2 0 0 8 1 /2 /2 0 0 8 1 /3 /2 0 0 8 1 /4 /2 0 0 8 1 /5 /2 0 0 8 1 /6 /2 0 0 8 1 /7 /2 0 0 8 1 /8 /2 0 0 8 1 /9 /2 0 0 8 1 /1 0 /2 0 0 8 1 /1 1 /2 0 0 8 1 /1 2 /2 0 0 8 0 1,2 2,4 3,6 4,8 6 7,2 8,4 9,6 10,8 12 Resid. time Depth (m)
Residency time (days) Mean of depth (m)
Figure 3 - Variations in the time of residence in the Serrote reservoir, Santa Quitéria, Ceará, during the study period
of the coefficient (1,831.014 - 613.956) was 1,217.058 and occurred upon the formation of the two groups.These results reveal the significant internal homogeneity (within
Nº of Groupings Coeficients Difference between coeficients Scaled Distance
19 1,057 1,504 1 18 2,561 1,818 1,020 17 4,379 3,283 1,044 16 7,662 3,454 1,087 15 11,116 3,552 1,132 14 14,668 4,302 1,179 13 18,970 4,437 1,235 12 23,407 4,440 1,293 11 27,847 9,340 1,351 10 37,187 15,794 1,474 9 52,981 18,046 1,681 8 71,027 22,905 1,918 7 93,932 26,292 2,218 6 120,224 53,808 2,563 5 174,032 86,248 3,269 4 260,280 122,113 4,400 3 382,393 231,563 6,001 2 613,956 1217,058 9,038 1 1831,014 25,000
Table 1 - Variation of the agglomeration coefficients for grouping hierarchical analysis
the grouping) and the high external heterogeneity (between the groups), indicating the applicability of grouping analysis in superficial water quality studies (KAZI et al., 2009).
In the dendrogram (FIG. 4) with the coefficients scaled, where the smallest distance corresponds to 1 and the greatest to 25, it is clear that the optimal cutoff point is in the scaled distance where the value is equal to or greater than 6.001, resulting in the formation of the two groups. The analysis of the hierarchical grouping, however, shows two significant groupings, named groups 1 and 2, with 11 and 9 samples, respectively.
Figure 4 - The dendrogram obtained in the grouping analysis of the water samples from the Serrote reservoir, CE
Group 1
Group 2
Table 2 displays the average, standard deviation and the maximum and minimum values for the parameters used in grouping. The determinant attributes for groupings were chlorophyll ‘a’ concentrations, associated to those of DO and total phosphorous in the samples. Group 1 was formed, predominantly, by water from the year 2007 and group 2 by samples from 2008 (FIG. 4). Therefore, it is observed that the groups were brought together, primarily, by the year and period they were collected, which may indicate an inter-annual effect of seasonality on the quality of these waters. This confirms the results obtained by Meireles et al. (2007), which found a significant seasonal variation in the water quality in water from the Serrote reservoir between the years 2002 and 2003, which was attributed to the considerable stratification in the water body.
Group 1 was made up of water samples where the concentrations of the attributes studied were very close to the limits established by CONAMA (357/05) for class 2, probably because they came from the year 2007, where it is supposed that there had been a lower nutrient uptake due to leaching in the watershed, because of a lower variation in the reservoir volume (FIG. 3). The exception in the grouping was sample P4-05/2008, whose presence in this group is probably due to low OD and chlorophyll ‘a’ concentrations.
Statistics Group 1 Group 2 CONAMA Limit (357/05) class 2
Temperature (ºC) Average 27.7 ± 0.96 27.4 ± 1.10 Minimum 26.4 26.0 -Maximum 29.1 28.7 Ph Average 8.43 ± 0.41 8.00 ± 0.83 Minimum 7.40 6.84 6.0 to 9.0 Maximum 9.00 8.86 EC (dS m-1) Average 0.30 ± 0.05 0.28 ± 0.05 Minimum 0.22 0.22 < 0.5‰ Maximum 0.34 0.34 (0.78 dS m-1) DO (mg L-1) Average 8.2 ± 3.54 8.8 ± 3.34 Minimum 4.70 5.2 > 5 mg L-1 O 2 Maximum 15.5 13.6 Chlorophyll ‘a’ (g L-1) Average 30.0 ± 5.45 45.7 ± 3.07 Minimum 20.80 40.7 < 30 Maximum 36.50 49.7 Total Phosphorous (mg L-1) Average 0.018 ± 0.01 0.035 ± 0.019 Minimum 0.002 0.009 < 0.030 Maximum 0.038 0.072
Table 2 - Average values and standard deviation of the variables studied, defined by the cluster analysis technique, for the groups of waters in the Serrote reservoir, Ceará
In group 2, the concentrations exceed the legislated limits, suggesting a grouping of lower quality water, possibly from superficial watershed runoff and the surrounding area. Samples P1-05/2007 and P3-08/2007 are included in this group because they have elevated chlorophyll ‘a’ concentrations, probably due to an algae flourishing phenomenon at this time. In the study about the superficial water quality in the Acaraú watershed, Andrade et al. (2007) it was concluded that the nutrients and sediment transport (anthropic action), along with the salts, are indicators of more weight in the definition of water quality in the region.
The results suggest that water quality in the reservoir is possibly being influenced by the anthropic interventions, associated with the water residence time and the changes in affluent flow due to the inter-annual rainy periods.
Spatial-temporal variations
The results pointed out a significant effect of inter-annual variation of the observed variables, in addition to a tendency toward spatial distribution of DO, chlorophyll ‘a’ and total phosphorous content throughout the period being studied. This study measured variations in chlorophyll ‘a’ concentrations across all points monitored, during the rainy and the dry seasons of 2007 and 2008 (FIG. 5). The highest concentrations of chlorophyll ‘a’ were registered in the year 2008. The seasonal variations are related to the cyanobacteria development, which is heightened in the dry season or right after the rainy season. Two factors contribute to this: the enrichment of the water with macro-nutrients as part of the source of organic material in the rainy season and the increase in solar incidence that occurs in the dry season. This fact was proven by Minillo et al. (2000) in a study of the occurrence of phytoplankton in the Lagoa dos Patos (a lake), in Rio Grande do Sul, where chlorophyll ‘a’ reached a concentration of 265 µg L-1 soon
after the period of water inflow into the reservoir.
This behavior may indicate actions that involve the use of soil management, since the point of greatest variation, P3 (40.7 - 49.7 µg L-1), is located in the area
of influence of a mill, occupied by small areas of corn plantation and with some free-range livestock around the perimeter, in addition to the fact that the reservoir is set in an extremely arid region that has very little vegetation, facilitating the carrying of nutrients to the reservoir. Such concentrations exceed the limit established in Resolution Nº 357/2005 of CONAMA for class 2 water (TAB. 2), a reference for spring waters with no regulatory implementation. Figuirêdo et al. (2006) demonstrate that the Serrote reservoir has a certain risk of eutrophication of 89 to 99% due to the phosphorous and chlorophyll ‘a’ concentrations. The referenced
authors attribute the high level of vulnerability to factors related to sediment transport in its micro-basin, to the phosphorous load coming from sewage and agriculture and the morphological aspects of the reservoir.
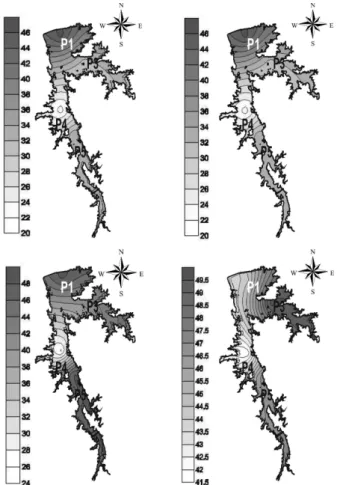
Figure 5 - Variation in Chlorophyll ‘a’ concentrations in May (A) and August of 2007 (B) and May (C) and August of 2008 (D) in the Serrote reservoir, Santa Quitéria, Ceará
The phosphorous is the principle element responsible for the eutrophication of the waters, because it is a macronutrient that contributes to the excessive proliferation of the micro-flora in the water bodies. In Figure 6 an indication of the variations of the total phosphorous concentrations is seen all throughout the points monitored, between the years 2007 and 2008.
It can be seen that total phosphorous values in the Serrote reservoir are characterized by the same seasonal tendency that the chlorophyll ‘a’, varying between 2007 and 2008 and have concentrations much higher in the year 2008, the year with the greatest amount of rain on record. By the spatial distribution, the greatest concentrations were recorded at point P5 (0.038 - 0.044 mg L-1), which
portrays the influence of Vila São Damião, a settlement near the reservoir, whose residents use rudimentary cesspools. In addition, this is the closest point of entrance into the river, receiving significant contributions from the inflow areas.
Figure 6 - Variation in Total Phosphorous concentrations in May (A) and August of 2007 (B) and May (C) and August of 2008 (D) in the Serrote reservoir, Santa Quitéria, Ceará
Two of the primary artificial sources of phosphorous are the domestic sewers and the agricultural fertilizers, as discussed by Shrestha and Kazama (2007), Castro and Mendonça (2004), Räike et al. (2003) and Esteves (1998).
For the DO concentrations, in view of the fact that the sampling was superficial, super-saturation was already expected (FIG. 7) in the upper layer of water body, as has been studied by Datsenko (1999) in several reservoirs sited in Ceará State, a super-saturation of oxygen was found dissolved in the upper layers of most of the reservoirs studied.
Resolution 357/2005 of CONAMA states that the DO concentrations for class 2 must not be less than 5 mg L-1 (TAB. 2). The amounts observed
vary temporally and spatially, similar to what was seen for total phosphorous and chlorophyll ‘a’, so that the lowest recorded concentrations were in the rainfall seasons. At the rainfall season there was an increase in dissolved and particulate organic material, contributing to increase the de-oxygenation of the lake water (ESTEVES, 1998).
Point P3 experienced the greatest DO concentrations (6.5 - 13.2 mg L-1), confirming the
elevated macronutrient input coming from agriculture fields and environmental degradation in the areas close to the referred collection point, which lead to an intense development of cyanobacteria. Tundisi and Masumura (2008) confirmed that in lakes, in eutrophic conditions, with high concentrations of chlorophyll ‘a’ on the surface due to the presence of phytoplankton, a super-saturation of OD occurred.
Figure 7 - Variation in Dissolved Oxygen concentrations in May (A) and August of 2007 (B) and May (C) and August of 2008 (D)
Conclusions
1. Variations in OD, chlorophyll ‘a’ and total phosphorous concentrations, from the year 2007 to the year 2008, may be attributed to flourishing micro-algae, which are indicative of inadequate occupation, use and management of the soil around the reservoir and its contributing watershed;
2. The grouping analysis identified a significant inter-annual variation related to the inflow of nutrients and a greater quality degradation of the water in the years of higher rainfall indices;
3. The reservoir has its own characteristics indicative of eutrophication, pointing to the need for changes in the use of the land;
4. For the year 2008, in group 2, the waters were shown to be inadequate for human consumption.
References
ANDRADE, E. M. et al. Fatores condicionantes de qualidade das águas superficiais do Alto Acaraú, Ceará, Brasil. Ciência Rural, v. 37, n. 06, p. 1791-1797, 2007.
ANDRADE, E. M. et al. Land use and groundwater quality: The case of Baixo Acaraú Irrigated Perimeter, Brazil. Revista Ciência Agronômica, v. 41, n. 02, p. 208-215, 2010.
AMERICAN PUBLIC HEALTH ASSOCIATION - APHA Standard Methods for the Examination of Water and Wastewater. Washington: American Public Health Association, 2005.
BRITO, L. T. de L. et al. Uso de análise multivariada na classificação das fontes hídricas subterrâneas da bacia hidrográfica do Salitre. Engenharia Agrícola, v. 26, n. 01, p. 36-44, 2006.
CASTRO, C. B. de; MENDONÇA, A. S. F. Impactos de ações antrópicas em bacias de manancial rurais de montanha sobre parâmetros de qualidade de água. Revista Brasileira de Recursos Hídricos, v. 09, n. 01, p.17-26, 2004.
CONSELHO NACIONAL DE MEIO AMBIENTE - CONAMA. Resolução nº. 357, de 17 de março de 2005. Dispõe sobre a classificação dos corpos de água e diretrizes ambientais para o seu enquadramento, bem como estabelece as condições e padrões de lançamento de efluentes, e dá outras providências. Disponível em: <http://www.mma.gov.br/ port/conama /res/res86/res2086. html >. Acesso em: 11 nov. 2008.
DATSENKO, I. S; SANTAELLA, S. T. E ARAÚJO, J. de C. Peculiaridades do processo de eutrofização dos açudes
da região semi-árida. In: CONGRESSO BRASILEIRO DE ENGENHARIA SANITÁRIA E AMBIENTAL, 20., 1999, Rio de Janeiro. Anais... Rio de Janeiro: ABES, 1999. 1 CD-ROM. DUMANSKI, J.; PIERI, C. Land quality indicators: research plan. Agriculture, Ecosystems & Environment, v. 81, n. 02, p. 155-162, 2000.
ESTEVES, F. A. Fundamentos da Limnologia. Rio de Janeiro: Interciência/FINEP, 1998. 575 p.
FIGUEIRÊDO, M. C. B., VIEIRA; V. de P. P. B.; MOTA F. S. B. Avaliação do risco de eutrofização em reservatórios da bacia do Acaraú, Ceará, Brasil. Revista Tecnologica, v. 27, n. 02, p. 179-189, 2006.
KAZI, T. G. et al. Assessment of water quality of polluted lake using multivariate statistical techniques: A case study. Ecotoxicology and Environmental Safety, v. 72, n. 02, p. 301-309, 2009.
LOPES, F. B. et al. Proposta de um índice de sustentabilidade do Perímetro Irrigado Baixo Acaraú, Ceará, Brasil. Revista Ciência Agronômica, v. 40, n. 02, p. 185-193, 2009.
MEIRELES, A. C. M.; FRISCHKORN, H.; ANDRADE. E. M. de. Sazonalidade da qualidade das águas do açude Edson Queiroz, bacia do Acaraú, no Semi-Árido cearense. Revista Ciência Agronômica, v. 38, n. 01, p. 25-31, 2007.
MINILLO, A. et al. Concentração de microcistinas e toxicidade nas formas de colônias de Microcystis aeruginosa de florações no estuário da Lagoa dos Patos, RS. In: ESPINDOLA, B. I. et al. Ecotoxicologia: Perspectivas par o Século XXI. São Carlos: RiMA, 2000. p. 521-534,
MONAGHAN, R. M. et al. Linkages between land management activities and stream water quality in a border dyke-irrigated pastoral catchment. Agriculture, Ecosystems and Environment, v. 129, n. 01/03, p. 201–211, 2009.
RÄIKE, A. et al. Trends of phosphorus, nitrogen and chlorophyll a concentrations in Finnish rivers and lakes in 1975-2000. The Science of the total environment, v. 310, n. 01/03, p. 47-59, 2003.
SEIDEL, E. J. et al. Comparação entre o método Ward e o método K-médias no agrupamento de produtores de leite. Revista Ciência e Natura, v. 30, n. 01, p. 7-15, 2008.
SHRESTHA, S.; KAZAMA F. Assessment of surface water quality using multivariate statistical techniques: A case study of the Fuji river basin, Japan. Environmental Modelling & Software, v. 22 n. 04, p. 464-475, 2007.
SECRETARIA DE RECURSOS HÍDRICOS DO ESTADO DO CEARÁ - SRH. Plano Estadual de Recursos Hídricos. Fortaleza, 2005. 4 v.
TUNDISI, J. G.; MATSUMURA, T. Limnologia. São Paulo: Oficina de textos, 2008. 632 p.