Banks’ Cpital Structure: European Evidence
Inês da Silva de OliveiraDissertation
Master in Finance and Taxation
Supervised by
António Cerqueira Elísio Brandão
i
Agradecimentos
Ao longo desta jornada tenho de deixar um agradecimento a todos os meus colegas com quem interagi e de quem tive sempre um apoio incondicional nas dúvidas e incertezas próprias do percurso. Particularmente, um agradecimento à Catarina Cavaleiro, à minha madrinha de curso, que sempre me acompanhou durante todo o meu percurso académico. Ao João Guerreiro pelo apoio fundamental. À Ana Chorosa e à Francisca Salgado que fizeram parte desta aventura de forma tão presente e que permitiram abafar a distância entre Coimbra e Porto.
Agradeço ao Bruno, pelo modo como sempre me apoiou e me acompanhou nesta caminhada. Pela alegria em momentos de tristeza, pela força nos dias de desânimo, pela compreensão nos momentos de angústia. Por tudo.
Um agradecimento especial à minha família, em especial aos meus pais, por serem um modelo de coragem, pelo exemplo de persistência, pelo apoio incondicional. Por tudo aquilo que me ensinaram, e de que dos bancos da velha faculdade não levamos. Ao meu irmão, por toda a competitividade saudável ao longo deste percurso.
Por último, e tendo consciência que sozinha, nada disto seria possível, agradeço ao meu orientador, o Dr. António Cerqueira, por ter excedido a expectativa daquilo que um orientador pode transmitir. Pela sabedoria partilhada, pelo acompanhamento incessante, pela dedicação generosa, pela liberdade de ação, assim como pela exigência imposta.
ii
Abstract
Most of the studies about capital structure are directed towards non-financial firms, paying little attention to the banking sector. The objective of this study is to analyse the determinants of banks’ capital structure, more specifically, analysing if the capital in excess of the regulatory minimum is influenced by the conditions of the market. The sample includes 158 commercial banks and bank holding companies from 28 European Union countries for the time period between 2011 and 2016. In regard to the explanatory variables, we consider those used in past literature either for financial and non-financial firms. These variables are: size, market-to-book ratio, profitability, collateral, dividends and asset risk. Besides these, macroeconomic variables will be use in order to understand the conditions of the market.
Regarding the dependent variable we use three different perspectives. All of them represent the capital in excess of the regulatory minimum stipulated in the Basel (II and III) accords. These perspectives differ by reflecting the market vision, book vision and the risk weighted assets.
The analysis here developed is supported by several theories on the capital structure of non-financial firms, as well as in buffer view – theory of capital structure of non-financial institutions. As an econometric methodology we use a multivariate regression applied to panel data. Empirical evidence laid out in this document suggests that the capital structure of banks is influenced by the conditions of the market. The capital regulation stipulated in the Basel agreements only has a second order of importance in determining the capital structure of European banks. Furthermore, our results are consistent with corporate finance theory meaning that European banks have similarities with financial companies, with respect to capital structure decisions.
Keywords
iii
Index of content
Agradecimentos ... i Abstract ... ii 1. Introduction ... 1 2. Literature review ... 32.1. The determinants of capital structure of the banking sector ... 3
2.2. Banking regulation ... 5
2.3. Buffer View ... 6
3. Research design, methodology and data ... 9
3.1. Variables ... 9
3.2. Sample and descriptive statistic ... 13
3.3. Methodology ... 18
4. Results ... 19
4.1. Buffer View vs Corporate Finance Theory ... 19
4.2. Effects of the change from the Basel II to Basel III accord ... 24
5. Conclusion ... 29
iv
Tables Index
Table 1. Definition of variables……….…10
Table 2. Table summary of predicted effects.………...……….13
Table 3. Number of banks and bank-years across countries………...14
Table 4. Descriptive statistics………...….15
Table 5. Correlations ………...….17
Table 6. Equation (3.1) estimation results………..19
Table 7. Equation (3.2) estimation results ……….…23
Table 8. Equation (3.3) estimation results ………25
Table 9. Effect of the constant value of Tier 1 on the excess capital models (market and book) and excess of the Tier capital ratio. ……….26
v
Figures Index
Figure 1. Distribution of book capital ratios……….….16 Figure 2. Distribution of Tier 1 capital ratios……….16 Figure 3. Average Progression of the Capital Ratios ……….27
1
1.
Introduction
Financial literature is full of studies on capital structure, since Modigliani and Miller (1958). Having said that, this matter is still one of the most complex and discussed topics in finance. In fact, the literature is actually lacking, once a great part of those studies are geared towards non-financial institutions, as opposed to financial ones.
In the financial system there are a number of market failures associated with transaction costs and information asymmetries. This requires banks, as opposed to non-financial firms, to be subjected to economic regulations. The banks should meet the minimum capital requirements stipulated in the Basel agreement. In particular, up to 2008 in the Basel I agreement, from 2008 up to 2013 in the Basel II accord and presently in the Basel III accord. With this in mind and taking into account the systemic risk inherent to the financial sector, as well as the crucial role the banks play in promoting an economy’s growth, it is important to study whether or not the minimum capital requirements are a first order determinant in banks’ capital structure. If they are not, then it is important to know what the determinants of banks’ capital structure are and what their effect is. And also, what impact does changing the minimum capital requirements has on the capital structure of banks.
We focus our investigation on researching these questions in order to analyse the determinants of banks’ capital structure in European Union countries. We divide our objective in three main steps. Firstly, we confirm if the premise reported in (Barth et al. (2005), Berger et al. (2008) e Brewer et al. (2008)) is applicable to our data. This premise states that banks store their own capital above the minimum required in the Basel accord. Secondly, we perform estimates with determinants commonly associated to the capital structure of non-financial firms, in particular market-to-book, profitability, collateral, dividends and asset risk. We aim to estimate whether or not these determinants have a significant impact over the capital in excess of the regulated minimum. Our results show that the variables have, for the most part, an explanatory power which relegates capital requirements capital to second plan, regarding their importance to the excess capital above the regulated minimum. The final step is analysing the signs of the coefficients obtained for the explanatory variables in light of capital structure theory oriented towards financial and non-financial firms.
2
Throughout this work, we consult the articles of Groop and Heider (2010), Teixeira and Silva (2014) and Sorokina et al. (2017). These authors used empirical literature about non-financial institutions to explain the capital structure of commercial banks and bank holding companies. With a sample of 158 commercial banks and bank holding companies from 28 European Union countries for the period 2011 to 2016 evidence has been found that the capital structure of the banks is influenced by the conditions of the market. Furthermore, the determinants commonly associated to the capital structure of non-financial institutions, in particular size, market-to-book ratio, profitability, collateral, dividends and asset risk have a similar impact in the capital structure of European banks. These results are in agreement with previous studies. As an econometric methodology we used multivariate regression applied to panel data.
Our study aims to contribute to the discussion of the importance of regulation and market factors specific to banks and their capital structure. Our contribution is based on three aspects: Firstly, our empirical analysis contemplates the Basel III accord. The period of the sample is extended for previous studies (Groop and Heider, 2010, Teixeira and Silva, 2014 e Sorokina et al. (2017)) seeing as the time period of their sample is centred around Basel I and II accords. Secondly, the study we perform is centred exclusively around the European Union. Therefore, we present a significant contribution of various determinants of the capital structure of European banks. Thirdly, we perform an empirical analysis of the behaviour of the banks given the changes introduced by the Basel III accord in regards to Basel II. With this analysis we pretend to understand the impact of the increase of the minimum capital requirement on the equity of European banks.
This study includes four more sections besides this introductory one. The following section is comprised of a literary review as well as some concept definitions. In the third section we define the variables and the methodology employed. The subsequent results are presented in section 4. Finally, section 5 is the conclusion of all the work developed in this essay.
3
2. Literature review
2.1. The determinants of capital structure of the banking sector
According to Groop and Heider (2010), since the seminal work of Modigliani and Miller (1958), to study the capital structure of non-financial institutions has become a common trend. Empirical studies on the capital structure of banks were deemed unnecessary. The minimum requirements for the regulatory capital were considered to be a first order determinant in the capital structure of the bank. This was supported by the study of Mishkin (2000) where it is claimed that bank managers would rather hold less equity than the amount demanded by the regulatory authorities due to the inherently high costs associated with equity holdings. This suggests that the capital of the bank is essentially determined by the banks’ capital requirements.
Afterwards, the Buffer View is proposed in the studies of Ayuso, Pérez and Suarina (2004), and Peura and Keppo (2006). As opposed to Mishkin (2000), this view claims that banks hold discretionary capital above the regulatory minimum. This is done in order to avoid costs associated with having to issue fresh equity in a short time period. These authors state that increased equity capital or decreased leverage should be expected for banks who have higher equity issuing costs.
An alternative view on the determinants of banks’ capital structure arises when Myers and Rajan (1998), Diamond and Rajan, (2000), and Alleen, Carletti and Marquez (2011) argue that similarly to non-financial institutions, banks can optimize their capital structure. In line with this statement, they do not consider the minimum capital requirements as a first order determinant for the capital structure of the bank. The works of Flannery and Sorescu (1996), Morgan and Stiroh (2001), Martinez Peria and Schmuckler (2001), Calomiris and Wilson (2004), Ashcraft (2008), and Flannery and Rangan (2008) also contribute to this alternative view, suggesting that the banks’ capital structures are a consequence of pressure from unhappy shareholders, holders and depositors and that the regulated capital requirements may not be binding and are therefore second order.
Based on the above arguments, we hypothesize that the capital structure of the banks is influenced by the conditions of the market, meaning that the minimum capital requirements are not first order determinants.
4
A fundamental investigation in this area is developed in the Groop and Heider (2010) study. Using a sample of commercial banks and bank holding societies from Europe and the United States, this study found empirical evidence that the minimum capital requirements do not represent a first order determinant in the capital structure of the banks. These authors found motivation for their study when they discovered that there is a cross-sectional variation in the leverage ratio of banks that fit the regulatory regime of the Basel I accord. This should not happen once this accord defines a uniform capital ratio. Similarly, to Barber and Lyon (1997), the Groop and Heider (2010) study empirically demonstrated that the most reliable determinants that explain the leverage of non-financial firms are equally important to explain the leverage of financial firms. These determinants were obtained in the Frank and Goyal (2009) study, namely: market-to-book ratio, profitability, collateral, dividends and size. Having said that, Groop and Heider (2010) state that the majority of banks optimize their capital structure in the same way as firms, except when their capital is close to the regulated minimum.
We therefore put forth a second hypothesis that allows us to assert whether or not the determinants of the capital structure behave accordingly to financial firm theory.
H2: The determinants of banks’ capital structure behave accordingly to corporate finance
theory
Sorokina, Thornton and Patel (2017) continue the Groop and Heider (2010) study. In their work they investigated new additional factors of banking leverage by including in the Groop and Heider’s central model, secondary variables from the Frank and Goyal (2009) study, as well as bank specific variables such as competition, diversification and liquidity. These variables were suggested by the theoretical work of Allen et al. (2011), Allen et al. (2015) and, DeAngelo and Stulz (2015).
However, despite recent literature side lining the banking regulation concerning capital structure, Brewer (2008) extends the existing literature, modelling the structure of capital as a function of factors encompassing specific variables of the bank as well as macroeconomic and financial characteristics of the banks’ country of origin. The modelling of the capital structure from the Brewer (2008) study also takes into consideration important characteristics of public policies and banking regulation from the banks country of origin. According to Brewer, these factors also affect the capital structure of the banks, in particular the intensity of the competition in the banking sector. The banks operating in a more
5
competitive environment tend to keep higher capital ratios (Čihák and Schaeck (2007)). Besides Brewer (2008), concerning capital regulation, Caprio (2007) predicts that a greater protection of the countries shareholders and investors will result in banks taking a bigger risk and a lower equity ratio. Kalemli-Ozcan (2012) suggests that in a stricter regulated environment, with a greater efficiency in the monitoring of the banks’ activity and a greater business restriction, banks tend to have less equity capital in excess of the regulatory minimum.
2.2. Banking regulation
In 1998 in the city of Basel, Switzerland, an accord named International Convergence of Capital Measurement and Capital Standards was signed. Most commonly addressed as Basel accord, its purpose was to strengthen, ensure stability and solidity in the international banking system whilst reducing the sources of competitive imbalance between banks and national banking systems. This accord was rectified by more than 100 countries and was centred around credit risk and asset risk management. However, the flaws of the accord started to become evident. The credit risk of banks was different and the different types of asset they had were not accounted for, leading to assets with different risks being treated uniformly. Therefore, in 2004, the Basel Committee on Banking Supervision published a new accord, Basel II (International Convergence of Capital Measurement and Capital Standard: a Revised Framework). With the intent of correcting the gaps in its predecessor, the Basel II accord is more sensitive to risk and has made corrections to the calculation of equity requirements. Besides calculating equity requirements for both credit and market risk, the Basel II accord also predicts the determination of requirements for operational risk. This allowed to create an international standard for banking regulators. This deal also contributed to the strengthening of the banking supervision, to a greater transparency of information regarding the banking sector and a greater freedom of risk management for financial institutions. The Basel II accord was only fully implemented in 2008.
The 2008 and 2009 economic crisis weakened the global economy and showcased some faults on the financial system. Therefore, in late 2010 the Basel Committee on Banking Supervision published the Basel III accord. In it new rules of minimum capital, liquidity and loss-absorption are established. The objective of the accord was to bolster the stability and the growth of the financial system on a global scale. The deal was in force in April 2013.
6
Despite the changes between the three Basel accords, establishing minimal capital requirements is common across all of them. This is one of the cornerstones of these accords. The minimal capital requirements correspond to the capital needed by the financial institution, so creditors can see it as viable in the sense of granting continuity and a healthy functioning, minimizing the possibility of failure of the banking system.
The capital of the banking sector was defined in the first Basel accord and was considered in two parts:
i. Core capital or Tier I: constituted by capital stock, reserves, retained earnings, net results for the year and deducting the amounts of own shares, unconsolidated capital, accumulated losses, pre-operating expenses and intangible assets;
ii. Supplementary capital or Tier II: constituted by revaluation reserves, general and credit risk provisions and hybrid equity instruments (composed of perpetual preferred shares and subordinated debt).
The tier1 capital was deemed necessary and enough to support the market’s risks and was therefore kept constant in the Basel I and II accords. However, in the Basel III accord this was not the case. The Tier 1 capital ratio (equity versus risk weighted assets, as defined in Basel I) from Basel I and II is stipulated as 4%, which is increased in the Basel III to a value of 6%.
Taking this into account, in what concerns the Basel III accord, it is expected that in 2013, the impact in the excess capital above the regulated minimum to be negative, seeing as the Tier 1 ratio will be increased from 4% to 6%.
H3: The introduction of the Basel accord had a negative impact on the excess capital above the regulated minimum.
2.3. Buffer View
In the banking sector, the excess capital above the regulated minimum is referred to as buffer. This is often considered an indicator of the financial health of the bank. Associated with empirical evidence supporting that the banks hold capital buffers, a theory called buffer view has arisen. According to this theory, banks hold discretionary capital above the regulated minimum because issuing fresh equity in a short time period can be quite costly. According
7
to Jokipii and Milne (2008), despite idle capital management being onerous, banks tend to use a capital buffer as a protection against the imperfections of the market such as risks and unexpected losses associated with economical fluctuations, loans and investment activities. Wall and Peterson (1987), Barrios and Blanco (2003), Ayuso et al. (2004) and Peura and Keppo (2006) claim that more equity or less leverage should be expected for the banks that face higher equity issuing costs. These costs are caused by information asymmetry as referred in Myers and Majluf (1984).
Barrios and Blanco (2003) analyse how financial firms define their capital ratio. In order to do this, they developed a theoretical model. According to this, the optimum financial decision for these companies consists in establishing a capital ratio given by the sum of the regulatory minimum and a capital buffer. The point of the buffer is to reduce the probability that a crash decreases the capital ratio below the regulatory minimum. The sum of this buffer depends on the equity issuing costs and the volatility of the capital ratio, that is, the Tier 1 ratio.
2.4. Corporate finance theory
In corporate finance literature there are several theories about the capital structure of financial institutions. From these theories there are three particularly relevant and prominent. In particular the trade-off theory (Miller (1977), DeAngelo and Masulis (1980), Kraus and Litzenberger (1973), Jensen and Meckling (1976)) that considers that a firm maximizes its value when the marginal benefit of debt is equal to its marginal cost. When the firm increases their indebtedness level so do their tax benefits associated with indebtedness. This means that the firm can have even greater benefits with financial leverage. This leads the firm to increased results and consequently their value. However, as debt goes up so do costs inherent to indebtedness, for example: interest and financial risk. Faced with this situation the company must now balance the fiscal gains with the funding costs in such way that allows it to reach a leverage point that maximizes its value. The pecking order theory (Myers and Majluf, 1984 and Myers and Rajan, 1989) suggests that the capital structure of a company does not arise from the optimum level of debt that maximizes the value of the company, but rather from various optimum and successive decisions, from the various funding sources, hierarchically. The objective of these decisions is to minimize the costs that stem from information asymmetry. The existence of these information asymmetries leads to the
8
possibility of firms’ securities being incorrectly valued by the market: overvalued or undervalued. In this context and in the case of an undervaluation, if the company must resort to a capital increase to finance a new project, new shareholders will register their wealth as increasing in a greater value than the Net Present Value (NPV). Current shareholders though will be confronted with a decrease in their wealth due to the undervaluation of their assets. This implies the contract of capital which will come with a greater interest rate when compared to the case in which their assets were properly valued. The asymmetry of information will affect the choice of the company’s preferred funding source.
Finally, the market timing theory (Baker and Wurgler, 2002) postulates that the capital structure of companies is the accumulated result of past attempts of the managers at seizing the favourable conditions of the stock market. This is because managers issue new stock when they consider that their assets are overvalued by the market and buy them when those assets are undervalued. According to this theory, managers should not search for a specific optimum capital structure because this will depend on the conditions of the market.
9
3. Research design, methodology and data
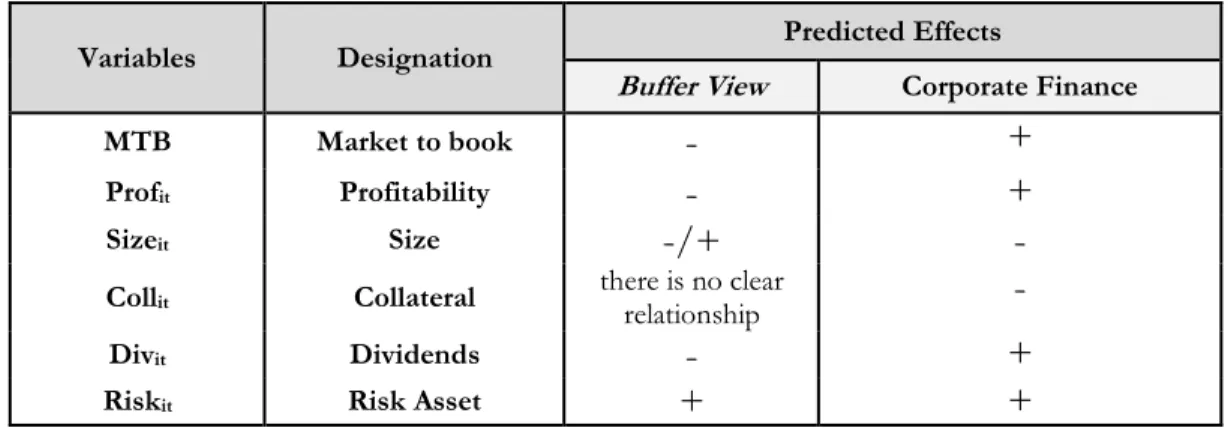
In this chapter we will present the underlying guidelines to our investigation model. Firstly, we will identify the variables used in the study and the expected correlation between the explanatory variables and the dependent variable. This will be done accordingly to corporate finance theory predictions and the Buffer view theory. Tables 1 and 2 depict a summary of these points. Secondly, we perform a brief analysis of the collected data. Finally, we present the methodology used in the study.
3.1. Variables
Similarly, to Teixeira and Silva (2014), the dependent variable of the model represents the excess equity in relation to the regulated minimum. This value is stipulated in the Basel accords as being 4% up to 2012 and 6% from 2013 onwards. The excess capital will be considered in three different measurements, in a way that reflects the market vision, book vision and Tier 1 (risk weighted asset as defined by the Basel accord). The capital ratio in the market vision is measured using the ratio between the market value of equity and the market value of asset. The market value of equity is defined by the product between the number of shares and the value of the share in the last day of the year. The market value of asset is defined by the sum of the market value of equity and the book value of liability. Regarding the capital ratio in the book view, the measurement is based on the ratio between the book value of equity and the book value of asset. In what concerns the Tier 1 capital ratio this is represented by the book value of assets over the book value of the risk weighted assets, as defined by the Basel accord.
The explanatory variables used are the ones from the central model of the Groop and Heider (2009) study. These were subsequently used in several studies on the capital structure of financial institutions. These variables are: market-to-book ratio, profitability, collateral and dividend distribution. With the exception of risk, these represent the most reliable variables concerning the capital structure of non-financial institutions (Frank and Goyal, 2004). Additionally, macroeconomic variables will also be included in the central model of Groop and Heider (2009).
10
Table 1. Definition of variables
Variables Definition
Excess equity capital (market) (Market value of equity / market value of asset) - regulatory minimum capital (4% or 6%) Excess equity capital (book) (Book value of equity/ book value of asset) - regulatory minimum capital (4% or 6%)
Excess equity capital Tier 1 (Book value of equity / capital divided by risk weighted assets, as defined in Basel I - regulatory minimum capital (4% or 6%) Market-to-book Market value of asset / book value of asset
Profitability (Pre-tax profit + interest expenses) / book value of assets Size Log (book value of asset)
Collateral (Total securities + treasury bills + other bills + bonds + cash and due from banks + land and buildings + other tangible assets) / book value of assets Dividends Dummy variable: one if the bank pays a dividend in a given year
Asset risk Annualised standard deviation of daily stock price returns * (market value of equity / market value of bank) GDP growth Annual percentage change of gross domestic product
Log stock market risk Annualised standard deviation of daily national stock market index return Term sctruture spread 10-year interest rate – 3-month interest rate on government bonds Inflation Annual percentage change in average consumer price index
According to the majority of previous studies, the market-to-book ratio (MTBit) variable is
defined as the ratio between the market value of asset and the book value of asset, representing a proxy for growth opportunities. (Rajan and Zingales (1995), Aggarwal and Jamdee (2003), and Frank and Goyal (2009)). The trade-off theory suggests that growth opportunities increase costs in adverse situations, aggravate the agency’s problems regarding debt and reduce the problems associated with the working capital. Most of the studies on financial institutions support this trade-off theory argument, seeing as there is a positive relation between growth opportunities and capital (Rajan and Zingales (1995), Aggarwal and Jamdee (2003) and Frank and Goyal (2009)). The buffer view predicts a negative relation with the excess capital above the regulatory minimum, as opposed to empirical studies on corporate finance. The latter predict a positive relation between the market-to-book ratio and the dependent variable in study. Taking into account that banks with more growth
11
opportunities should incur less equity issuing costs in the short term it is expected that they hold less capital above the regulatory minimum.
As for profitability (Profi) it is defined as the sum of the results pre-tax profit plus interest
expenses over the book value of asset. The buffer view predicts a negative relation between profitability and excess capital seeing as it should be expected that the most profitable banks have less excess capital above the regulatory minimum. This is the case because the most profitable banks face less short-term equity issuing costs. However empirical financial literature predicts a negative relation between profitability and leverage. This is the same as predicting a positive relationship between profitability and excess capital above the regulatory minimum. This happens due to the fact that the most profitable companies tend to use internal funding as opposed to an external source, which means that they tend to be less leveraged.
The size (Sizeit) is defined as the logarithm of the book value of asset. The trade-off theory
predicts that bigger and more mature companies use more debt because, according to Frank and Goyal (2004) the measured size through the asset is an inverted proxy for volatility and the bankruptcy costs. Therefore, empirical financial literature predicts that the size variable has a negative effect because bigger companies tend to be more leveraged. According to Fama and French (2002), bigger companies can have less information asymmetry and will therefore suffer less damage from adverse selection. However, according to the Buffer View, there is no clear relation between the size of the bank and the excess capital above the regulated minimum. Due to the effect of information asymmetry, bigger banks can have an excess capital above the regulatory minimum if they are more complex. On the other hand, bigger banks can present a smaller excess capital above the regulatory minimum as long as they are known in the market and are able to easily issue fresh equity in the market.
The collateral (Coli)can be considered a proxy for the different economic forces (Fama and
French (2002)). This is defined as the ratio between the sum of: total securities, treasury bills, other bills, bonds, cash and due from banks, buildings and other tangible assets over; the book value of asset (Kalemli-Ozcan, 2012). This variable is usually defined as tangibility for non-financial institutions. According to financial corporate theory, tangibility has a negative effect on the equity ratio. This is because the greater collateral, the lower the default costs, which also reduces the agency’s problems. However according to the buffer view, there is
12
no clear prediction on how this variable affects the excess capital above the regulatory minimum.
The dividends variable (Divit) is defined as a dummy assuming the value of 1 if the bank pays
the dividends and 0 if they do not, in a given year. The dividends’ payment can be interpreted as a proxy for the internal trust of the bank (Frank e Goyal 2009). In what concerns the expected results, corporate finance literature predicts a positive relation between the dividends variable and the excess capital above the regulatory minimum. On the other hand, the buffer view predicts a negative effect between these variables. Corporate finance literature’s prediction is supported by the order pricing theory. According to which the companies that present higher profits and dividends prefer to use internal funding as opposed to an external source. The buffer view argues that banks who present greater profits or banks that pay dividends with higher frequency are potentially exposed to less short-term equity issuing costs and therefore tend to hold less equity.
The asset risk (Riskit) is measured through the product of the annual standard deviation of
the daily profitability of the shares and the ratio between the market value of equity and the market value of bank. According to the buffer view and corporate finance theory, asset risk is expected to have a positive effect on the excess capital above the regulatory minimum. The buffer view also supports that the value of the excess capital above the regulatory minimum depends on the probability of the capital of the bank to drop below the regulatory minimum, meaning that banks with a greater risk tend to have a bigger proportion of capital. On the other hand, corporate finance theory, in particular, the trade-off theory, considers that companies with more volatile cash flows face bigger costs in situations of greater financial difficulty, and have a lower probability of seizing tax benefits (Frank e Goyal, 2009). Besides (Frank e Goyal, 2009) consider that the risk becomes detrimental to the shareholder’s investment.
Finally, four macroeconomic variables are added to the study. These are: inflation (Inflit),
which is a measure of the annual percentage change in the average price ratio of the consumer, stock market volatility (MarkVolit) which is defined by the annual standard
deviation of the national daily ratio of the asset market, the GDP’s growth (GDPit) measured
by the annual change of the gross domestic product and the term structure spread (TermSpredit). It is expected that the macroeconomic variables are related to the dependent
13
variable, seeing as the banking sector’s activity is quite exposed to the economic conditions of each country.
Table 2. Table summary of predicted effects
Variables Designation Predicted Effects
Buffer View Corporate Finance
MTB Market to book
-
+Profit Profitability
-
+Sizeit Size
-
/+-
Collit Collateral there is no clear relationship
-
Divit Dividends
-
+Riskit Risk Asset + +
3.2. Sample and descriptive statistic
In this study panel data is used. Using this type of data has advantages, in particular the fact it takes into consideration both the cross section and the time series dimensions.
The data that comprises the base of this study were collected in three databases. In our initial approach we used Orbis Bank Focus from Bureau van Dijk to select a sample containing 158 commercial banks and bank holding societies of 28 different European countries listed in the stock market. From here we also collected data from the results’ demonstration and consolidated balances. In order to obtain the market variables, for instances the stock market volatility, dividends, asset price and interest rate the Thompson Financials’ DataStream was used. Concerning the macroeconomic variables, the World Economic Outlook database, from FMI was used.
Only commercial banks and bank holding societies were considered so as to ensure the sample’s homogeneity. According to Groop and Heider (2010), big open capital banks constitute a homogeneous group of companies operating internationally with a comparable production technology and hence constitute a natural sample.
The sample we used encompasses six years, from 2011 to 2016. Initially we intended that the sample would cover all the years since 2008 so as to coincide with the beginning of the Basel II accord. However, this was not possible because 2011 is the oldest year one can access in the Orbis Bank Focus database, from Bureau van Dijk. This means that the time period analysed encompasses the Basel II (2011 and 2012) and the Basel III (2013-2016) accords.
14
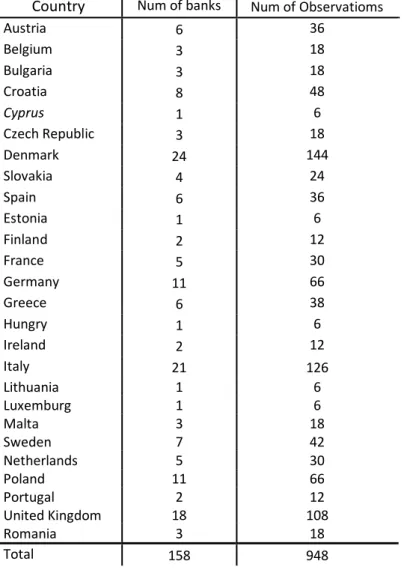
The total sample has 948 observations associated with the 158 banks. This number of observations corresponds to the maximum value which can only be reached for some variables seeing as the maximum observation number for the majority of the variables is inferior to this value. Table 3 provides the number of banks and observations for each country.
Table 3. Number of banks and bank-years across countries
The sample is comprised of 158 commercial banks and bank holding societies listed in the stock market of 28 European countries. The data was collected from the Orbis Bank Focus database for the time period of 2011 to 2016.
Country Num of banks Num of Observatioms
Austria 6 36 Belgium 3 18 Bulgaria 3 18 Croatia 8 48 Cyprus 1 6 Czech Republic 3 18 Denmark 24 144 Slovakia 4 24 Spain 6 36 Estonia 1 6 Finland 2 12 France 5 30 Germany 11 66 Greece 6 38 Hungry 1 6 Ireland 2 12 Italy 21 126 Lithuania 1 6 Luxemburg 1 6 Malta 3 18 Sweden 7 42 Netherlands 5 30 Poland 11 66 Portugal 2 12 United Kingdom 18 108 Romania 3 18 Total 158 948
15
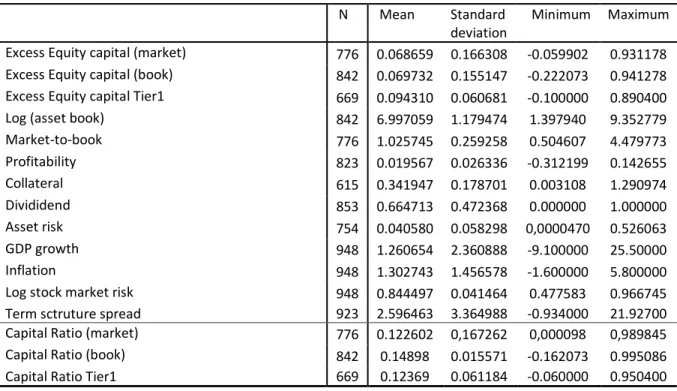
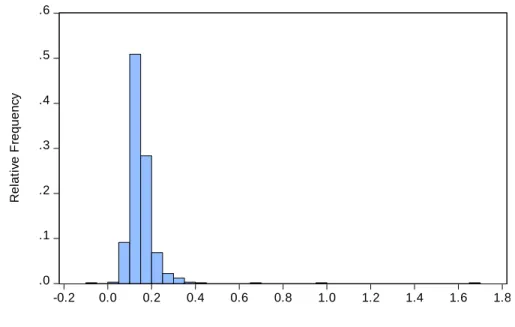
Table 4 contains the descriptive statistics of the variables used in the regressions as well as the capital ratios necessary for the calculation of the dependent variables. The descriptive statistics of the capital ratios show that the banks in our analysis hold capital above the regulatory minimum. This is because the maximum regulatory minimum ratio in our sample is 6% (Basel III accord) and the Tier 1 capital ratio average is 12.3%. This is confirmed by figures 1 and 2 which represent respectively the distribution of the book capital ratio and the distribution of the Tier 1 capital ratio. Both graphics present a distribution tendency to the right of the minimum regulatory values by the Basel II and III accords. This fact is congruent with the Barth et al. (2005), Berger et al. (2008) and Brewer et al. (2008) studies. If the minimum requirements of capital were first order determinants, one would expect the capital ratio distribution to be constant and around the Tier 1 ratio values.
Table 4. Descriptive statistic
The sample is comprised of 158 commercial banks and bank holding societies listed in the stock market of 28 european
countries. The data was collected from the Orbis Bank Focus database for the time period of 2011 to 2016.N represents
the number of observations for each variable.
N Mean Standard
deviation
Minimum Maximum
Excess Equity capital (market) 776 0.068659 0.166308 -0.059902 0.931178
Excess Equity capital (book) 842 0.069732 0.155147 -0.222073 0.941278
Excess Equity capital Tier1 669 0.094310 0.060681 -0.100000 0.890400
Log (asset book) 842 6.997059 1.179474 1.397940 9.352779
Market-to-book 776 1.025745 0.259258 0.504607 4.479773 Profitability 823 0.019567 0.026336 -0.312199 0.142655 Collateral 615 0.341947 0.178701 0.003108 1.290974 Divididend 853 0.664713 0.472368 0.000000 1.000000 Asset risk 754 0.040580 0.058298 0,0000470 0.526063 GDP growth 948 1.260654 2.360888 -9.100000 25.50000 Inflation 948 1.302743 1.456578 -1.600000 5.800000
Log stock market risk 948 0.844497 0.041464 0.477583 0.966745
Term sctruture spread 923 2.596463 3.364988 -0.934000 21.92700
Capital Ratio (market) 776 0.122602 0,167262 0,000098 0,989845
Capital Ratio (book) 842 0.14898 0.015571 -0.162073 0.995086
16
Figure 1. Distribution of the book capital ratio
The figure depicts the distribution of the book capital ratio from 842 observations from the sample of 158 commercial banks and bank holding societies listed in the stock market of 28 European countries for the time period of 2011 to 2016.
.0 .1 .2 .3 .4 .5 -0.2 -0.1 0.0 0.1 0.2 0.3 0.4 0.5 0.6 0.7 0.8 0.9 1.0 1.1 R e la ti v e F re q u e n c y book equity
Figure 2. Distribution of the Tier 1 capital ratio
The figure depicts the distribution of the Tier 1 capital ratio of 669 sample observations of 158 commercial banks and bank holding societies listed in the stock market of 28 European countries for the time period between 2011-2016
.0 .1 .2 .3 .4 .5 .6 -0.2 0.0 0.2 0.4 0.6 0.8 1.0 1.2 1.4 1.6 1.8 R e la ti v e F re q u e n c y tier 1
17
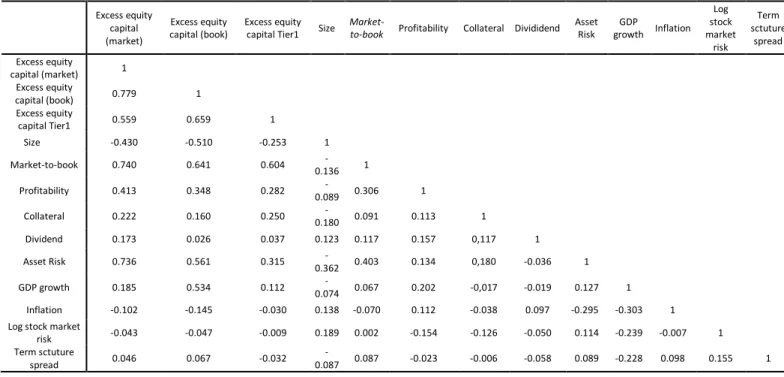
Table 5 presents the correlation coefficient between variables. The capital ratio above the regulatory minimum is negatively related with size. Bigger banks tend to hold less capital above the regulatory minimum because they can have less information asymmetry and therefore will suffer less damage from adverse selection. Inflation and stock market volatility are also negatively related with the capital ratio above the regulatory minimum. Furthermore, the market-to-book ratio seems to be highly correlated with the excess capital (market), with a positive value of 74%. The correlation with the excess capital measured in book values and in Tier 1 is lower. The same can be said about the asset risk which has a 73.6% correlation with the excess capital (market). These results suggest that a bank exposed to more growth opportunities and with a greater asset risk level tends to hold more capital above the regulatory minimum.
Table 5. Correlations
The sample is comprised of 158 commercial banks and bank holding societies listed in the stock market of 28 European countries. The data was collected from the Orbis Bank Focus database for the time period of 2011 to 2016. Excess equity capital (market) Excess equity capital (book) Excess equity capital Tier1 Size
Market-to-book Profitability Collateral Divididend Asset Risk GDP growth Inflation Log stock market risk Term sctuture spread Excess equity capital (market) 1 Excess equity capital (book) 0.779 1 Excess equity capital Tier1 0.559 0.659 1 Size -0.430 -0.510 -0.253 1 Market-to-book 0.740 0.641 0.604 -0.136 1 Profitability 0.413 0.348 0.282 -0.089 0.306 1 Collateral 0.222 0.160 0.250 0.180 - 0.091 0.113 1 Dividend 0.173 0.026 0.037 0.123 0.117 0.157 0,117 1 Asset Risk 0.736 0.561 0.315 -0.362 0.403 0.134 0,180 -0.036 1 GDP growth 0.185 0.534 0.112 0.074 - 0.067 0.202 -0,017 -0.019 0.127 1 Inflation -0.102 -0.145 -0.030 0.138 -0.070 0.112 -0.038 0.097 -0.295 -0.303 1 Log stock market
risk -0.043 -0.047 -0.009 0.189 0.002 -0.154 -0.126 -0.050 0.114 -0.239 -0.007 1 Term sctuture
spread 0.046 0.067 -0.032
18
3.3. Methodology
Following the vast literature on capital structure, we will employ the ordinary least squares method (OLS) in order to estimate the coefficients. This estimation method minimizes the sum of the remaining squares from the regression, in order to improve the fitting of the model to the observed data. One of the requirements to use this method is that the unpredictable factor (the error) is randomly distributed. This distribution must be normal and independent.
The central model of this investigation is given by:
ExcCapit = β0 + β1 Sizeit + β2 MTBit + β3 Profit + β4 Colit + β5 DIvit + β6 Riskit + ɛt
(3.1) On a second stage we add the macroeconomic variables to the central model:
ExcCapit = β0 + β1 Sizeit + β2 MTBit + β3 Profit + β4 Colit + β5DIvit + β6 Riskit + β7 GDPit + β8 Inflit
+ β9 MarkVoit + β10 TermSpredit + ɛt
(3.2) Finally, the dummy variable (ABit) is added to the central model in order to study the effects
of the change from the Basel II to the Basel III accord.
ExcCapit = β0 + β1 Sizeit + β2 MTBit + β3 Profit + β4Colit + β5DIvit + β6 Riskit t + β7 GDP it + β8 Inflit
+ β9 MarkVolit + β10 TermSpredit + β11ABit + ɛt
(3.3) With the exception of the ABit variable, all the variables are defined in section 3.1. The former
is defined as a binary variable which takes the value of 1 during the Basel III accord, (between the years 2013-2016) and the value of 0 during the Basel II accord, meaning the 2010 and 2011 years.
Before estimating any model, a Hausman test will be performed in order to evaluate which method shall be employed: the fixed effect method or the random effect method. In the case of no correlation between the unobserved individual effects and the independent variables, the method employed shall be the random effects method. On the other hand, if there is in fact a correlation between the unobserved individual effects and the independent variables, we shall use the fixed effects method. The null hypothesis associated with the Hausman test indicates that we should use the random effect model. The test result pointed towards the validation of the null hypothesis, meaning that we employed the random effects method concerning the bank.
19
4. Results
4.1. Buffer View vs Corporate Finance Theory
In this section we analyse the results from the regression of equation (3.1) and (3.2). The dependent variable shall be considered in the three different perspectives mentioned in the previous section: the market, book and Tier 1 perspectives.
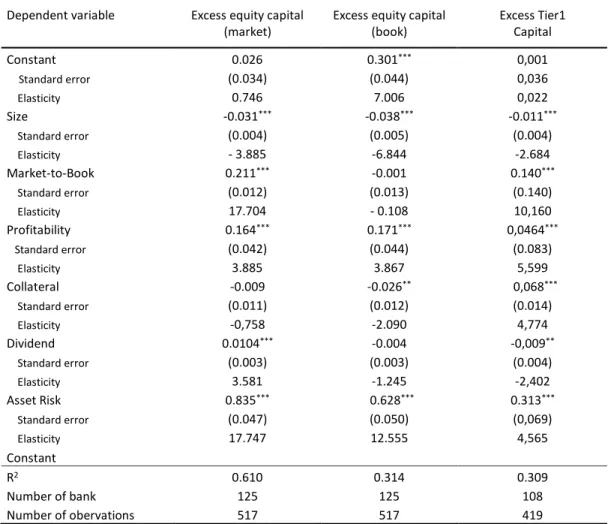
Table 6 presents the estimation of the regressions of the excess capital above the regulatory minimum. The calculation was based on the market, book and Tier 1 ratios. In these regressions only the size, market-to-book, profitability, collateral, dividends and asset risk variables are considered.
Table 6. Equation (3.1) estimation results.
The sample is comprised of 158 commercial banks and bank holding societies listed in the stock market of 28 European
countries. The data was collected from the Orbis Bank Focus database for the time period of 2011 to 2016.The dependent
variable is placed in the first line for each column. *, **, *** indicate the level of statistical significance of 10%, 5% and 1%,
respectively.
Dependent variable Excess equity capital
(market)
Excess equity capital (book) Excess Tier1 Capital Constant 0.026 0.301*** 0,001 Standard error (0.034) (0.044) 0,036 Elasticity 0.746 7.006 0,022 Size -0.031*** -0.038*** -0.011*** Standard error (0.004) (0.005) (0.004) Elasticity - 3.885 -6.844 -2.684 Market-to-Book 0.211*** -0.001 0.140*** Standard error (0.012) (0.013) (0.140) Elasticity 17.704 - 0.108 10,160 Profitability 0.164*** 0.171*** 0,0464*** Standard error (0.042) (0.044) (0.083) Elasticity 3.885 3.867 5,599 Collateral -0.009 -0.026** 0,068*** Standard error (0.011) (0.012) (0.014) Elasticity -0,758 -2.090 4,774 Dividend 0.0104*** -0.004 -0,009** Standard error (0.003) (0.003) (0.004) Elasticity 3.581 -1.245 -2,402 Asset Risk 0.835*** 0.628*** 0.313*** Standard error (0.047) (0.050) (0,069) Elasticity 17.747 12.555 4,565 Constant R2 0.610 0.314 0.309 Number of bank 125 125 108 Number of obervations 517 517 419
20
Analysing the results across table 6 one can conclude that the regression is best described when the variable is calculated with market values (R2 = 0,610). The models where the
calculation of the dependent variables is based on the book vision and in Tier 1 have lower R2 values, respectively 0,314 and 0,309. Besides, most of the variables are statistically
significant around 1%. This suggests that the banking regulation is not a first order determinant in the capital structure of the bank. The capital structure of the baking sector ends up being a consequence of the discipline of the market, which means it is important to analyse the sign of the computed coefficients.
In the regression where the excess capital is measured through market values (column 2 table 6), the collateral and size coefficients have a negative sign. The collateral coefficient is not statistically significant and therefore has no influence whatsoever in the excess capital (market). The estimated coefficient for size is in accordance with corporate finance theory. Banks with greater size tend to have less excess capital above the regulatory minimum. Since the buffer view does not define the existence of a clear relation between the excess capital and size, the negative sign of this coefficient may be related with the premise that bigger banks can present a lower excess capital above the regulatory, as long as they are well known in the market and are able to, in the short term, issue fresh equity in the market.
The market-to-book, profitability dividends and risk coefficients present positive signs and are statistically significant.
The coefficient of the market-to-book variable is also in agreement with corporate finance theory, refuting the buffer view arguments. The buffer view argues that banks with more growth opportunities should be expected to incur in lower short-term equity issuing costs and should therefore hold less capital above the regulatory minimum. Our results are in agreement with the corporate finance theory, confirming that growth opportunities increase the costs in adverse situations, aggravating the agency’s problems with debt and reducing the cash flow problems.
The results for the coefficient of the profitability variable indicate that the most profitable banks tend to have a greater excess capital above the regulatory minimum. According to corporate finance theory this is because the most profitable companies tend to use internal funding as opposed to external sources. This is inconsistent with the buffer view.
21
Contrarily to the buffer view’s prediction, our results suggest that banks who tend to pay dividends have higher excess capital above the regulatory minimum. This is consistent with the order pricing theory: companies who present greater profits and higher dividends prefer to use internal as opposed to external funding sources.
Banks exposed to greater asset risk hold more excess capital above the regulatory minimum. This result is in accordance with the buffer view and with corporate finance theory, however it can have two distinct interpretations. This is because the value of the excess capital above the regulatory minimum depends on the probability of the banks’ capital falling under the regulatory minimum. Therefore, banks with greater risk level tend to have a bigger capital proportion in order to face greater costs in financially difficult situations.
With the exception of the collateral coefficient, which is statistically insignificant, all the estimated coefficients are in agreement with corporate finance theory (Frank e Goyal, 2009). This allows us to state that the main determinants of the capital structure of non-financial institutions are also the determinants of the capital structure in this financial institution group. Even so, the positive sign of the coefficient for the size variable is in agreement with the buffer view, seeing as the latter does not define a clear relation between the explanatory variable (size) and the dependent variable. However, the signs for the market-to-book, profitability, and dividends are opposite to what the buffer view predicts.
Concerning the regression where the dependent variable is the excess capital measured with book values (column 3, table 6) the results are consistent with the previously analysed regression, with the exception of the collateral and dividends coefficients. In this regression the collateral coefficient has a negative sign and is statistically significant meaning that banks which hold a greater collateral value tend to have less excess capital above the regulatory minimum. This is in agreement with the corporate finance theory. The bigger the collateral, the lower the default costs, which reduces the agency’s problems.
Besides, our results also show that banks with bigger size tend to have less capital above the regulatory minimum and banks with greater profits tend to have more capital above the regulatory minimum. These results are congruent with the typical arguments of corporate finance. Notice however how three coefficients are in agreement with the buffer view. One of these is the banks’ size coefficient. Bigger banks have an easier time issuing fresh equity because they are well known in the market. The asset risk coefficient shows that the greater
22
the risk the lower the indebtedness. The third one is the collateral due to the fact that the buffer view does not define a relation for this variable.
Finally, we present the results for the regression where the excess capital is measured based on the Tier 1 ratio values (column 4, table 6). Comparing the results of this regression with the results of previously analysed regressions, a negative relation between size and the dependent variable, as well as a positive relation between market-to-book, profitability and the risk with the dependent variable can be observed. This is in agreement with corporate finance theory. Contrarily to the predicted results from corporate finance theory this regression suggests that banks who distribute dividends have less excess capital above the regulatory minimum. This coefficient is in agreement with the buffer view seeing as banks who present the biggest profits or banks who pay dividends more frequently are potentially exposed to less short-term equity issuing costs and therefore hold less equity.
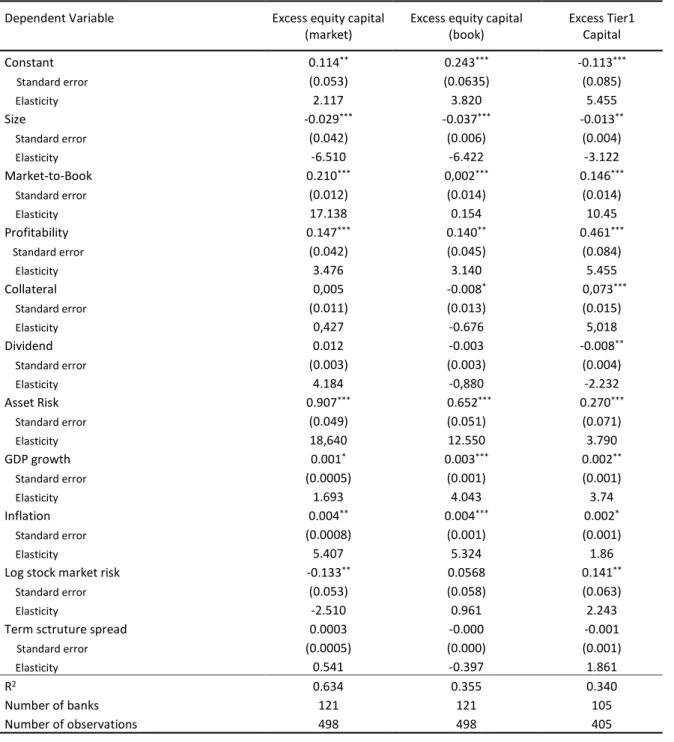
Table 7 exposes the results for the estimations of the excess capital above the regulatory minimum. These calculations were based on the market ratio, book ratio and Tier 1 ratio. In these regressions, besides the size, market-to-book, profitability, collateral, dividends and asset risk variables we will add to the model four macroeconomic variables: inflation, growth rate of the GDP, stock market volatility and the term structure spread these are increasingly exposed to the economic cycle fluctuations compared to non-financial firms. The introduction of the macroeconomic variables in the initial model does not manifest any significant changes in the previous results from table 6, in what concerns the three measurements of the dependent variable. It is also important to highlight that there has been a slight increase in the R2 value which demonstrates that the macroeconomic variables have
some explanatory value towards the excess capital above the regulatory minimum.
The sign of the coefficients as well as their significance remain practically the same. Furthermore, the only variable measuring the spread of the time structure of the rate of interest is the only macroeconomic variable that is not statistically significant. Finally, the inflation and GDP growth rate variables have a positive influence in the excess capital above the regulatory minimum.
23
Table 7. Equation (3.2) estimation results.
The sample is comprised of 158 commercial banks and bank holding societies listed in the stock market of 28 European countries. The data was collected from the Orbis Bank Focus database for the time period of 2011 to 2016. The dependent
variable is placed in the first line for each column. *, **, *** indicate the level of statistical significance of 10%, 5% and 1%,
respectively.
Dependent Variable Excess equity capital
(market)
Excess equity capital (book) Excess Tier1 Capital Constant 0.114** 0.243*** -0.113*** Standard error (0.053) (0.0635) (0.085) Elasticity 2.117 3.820 5.455 Size -0.029*** -0.037*** -0.013** Standard error (0.042) (0.006) (0.004) Elasticity -6.510 -6.422 -3.122 Market-to-Book 0.210*** 0,002*** 0.146*** Standard error (0.012) (0.014) (0.014) Elasticity 17.138 0.154 10.45 Profitability 0.147*** 0.140** 0.461*** Standard error (0.042) (0.045) (0.084) Elasticity 3.476 3.140 5.455 Collateral 0,005 -0.008* 0,073*** Standard error (0.011) (0.013) (0.015) Elasticity 0,427 -0.676 5,018 Dividend 0.012 -0.003 -0.008** Standard error (0.003) (0.003) (0.004) Elasticity 4.184 -0,880 -2.232 Asset Risk 0.907*** 0.652*** 0.270*** Standard error (0.049) (0.051) (0.071) Elasticity 18,640 12.550 3.790 GDP growth 0.001* 0.003*** 0.002** Standard error (0.0005) (0.001) (0.001) Elasticity 1.693 4.043 3.74 Inflation 0.004** 0.004*** 0.002* Standard error (0.0008) (0.001) (0.001) Elasticity 5.407 5.324 1.86
Log stock market risk -0.133** 0.0568 0.141**
Standard error (0.053) (0.058) (0.063)
Elasticity -2.510 0.961 2.243
Term sctruture spread 0.0003 -0.000 -0.001
Standard error (0.0005) (0.000) (0.001)
Elasticity 0.541 -0.397 1.861
R2 0.634 0.355 0.340
Number of banks 121 121 105
24
4.2. Effects of the change from the Basel II to Basel III accord
In this section we analyse the effect that the change of the Basel II to the Basel III accord had, in particular concerning the Tier 1 minimum value. With the introduction of the third Basel accord, the Tier 1 ratio increased 2%, now assuming a value of 6%.
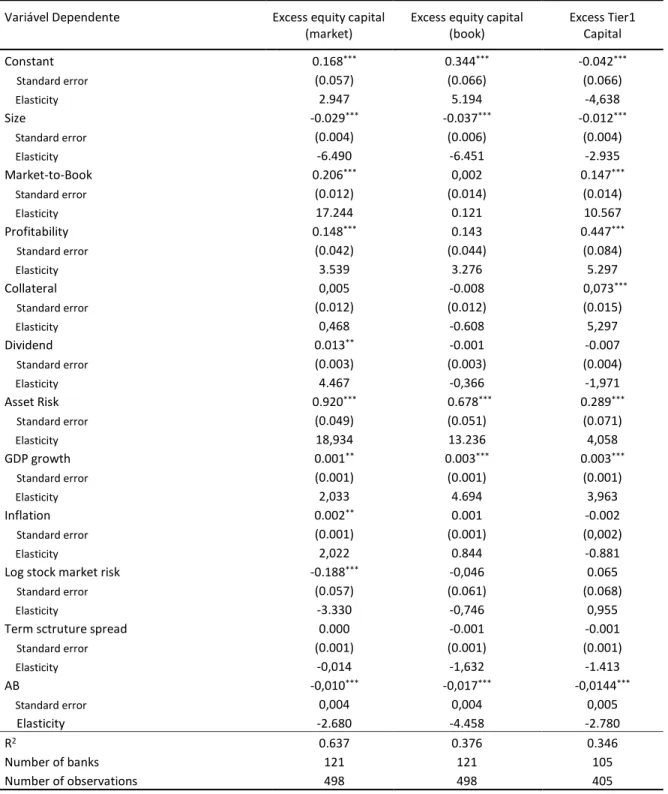
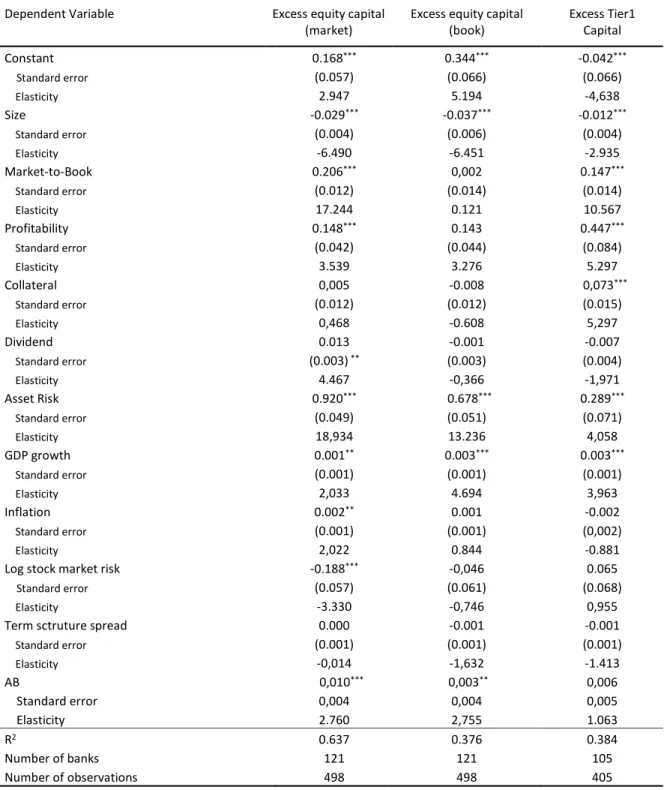
Table 8 exposes the regressions from equation 3.3. It is added to the previous model (comprised by the 6 explanatory variables and the 4 macroeconomic variables) the dummy variable (AB). This takes the value of 0 between for the 2011 and 2012 years (Basel II accord) and the value of 1 for the time period between 2013-2016 (Basel III accord).
We analysed the results from the regression of equation 3.3. and verified that the third accord has a statistically significant and negative effect of 1% over the excess capital, in the market and book models. In what concerns the Tier 1 model, the introduction of the third Basel accord is statistically irrelevant. As one should expect, the increase of the Tier 1 decreases the excess capital above the regulatory minimum available by the banks.
The results present in table 9 suggest that there has been an increase in capital by the banks, after the introduction of the Basel III accord. However, this increase is only suggested by the market and book views since it presents a positive coefficient value which has a significance level of 1% and 5 % respectively. In the regression in which the dependent variable is measured with the Tier 1 ratio, the AB variable does not have statistical relevance. This fact suggests that the Tier 1 value kept by the banks did not have a significant increase with the introduction of the Basel III accord.
The relation between the results of tables 8 and 9 suggests that the banks in study were prepared for the 2% increase on the Tier 1 ratio, as defined in the Basel accord. When considering the Tier 1 ratio constant at 4%, we observe that the third Basel accord positively influenced the excess capital above the regulatory minimum. However, that capital increase was not enough to face the 2% increase, seeing as the dummy (ABit) variable presented a
25
Table 8. Equation (3.1) estimation results.
The sample is comprised of 158 commercial banks and bank holding societies listed in the stock market of 28 European countries. The data was collected from the Orbis Bank Focus database for the time period of 2011 to 2016. The dependent
variable is placed in the first line for each column. *, **, *** indicate the level of statistical significance of 10%, 5% and 1%,
respectively.
Variável Dependente Excess equity capital
(market)
Excess equity capital (book) Excess Tier1 Capital Constant 0.168*** 0.344*** -0.042*** Standard error (0.057) (0.066) (0.066) Elasticity 2.947 5.194 -4,638 Size -0.029*** -0.037*** -0.012*** Standard error (0.004) (0.006) (0.004) Elasticity -6.490 -6.451 -2.935 Market-to-Book 0.206*** 0,002 0.147*** Standard error (0.012) (0.014) (0.014) Elasticity 17.244 0.121 10.567 Profitability 0.148*** 0.143 0.447*** Standard error (0.042) (0.044) (0.084) Elasticity 3.539 3.276 5.297 Collateral 0,005 -0.008 0,073*** Standard error (0.012) (0.012) (0.015) Elasticity 0,468 -0.608 5,297 Dividend 0.013** -0.001 -0.007 Standard error (0.003) (0.003) (0.004) Elasticity 4.467 -0,366 -1,971 Asset Risk 0.920*** 0.678*** 0.289*** Standard error (0.049) (0.051) (0.071) Elasticity 18,934 13.236 4,058 GDP growth 0.001** 0.003*** 0.003*** Standard error (0.001) (0.001) (0.001) Elasticity 2,033 4.694 3,963 Inflation 0.002** 0.001 -0.002 Standard error (0.001) (0.001) (0,002) Elasticity 2,022 0.844 -0.881
Log stock market risk -0.188*** -0,046 0.065
Standard error (0.057) (0.061) (0.068)
Elasticity -3.330 -0,746 0,955
Term sctruture spread 0.000 -0.001 -0.001
Standard error (0.001) (0.001) (0.001) Elasticity -0,014 -1,632 -1.413 AB -0,010*** -0,017*** -0,0144*** Standard error 0,004 0,004 0,005 Elasticity -2.680 -4.458 -2.780 R2 0.637 0.376 0.346 Number of banks 121 121 105 Number of observations 498 498 405
26
Table 9. Effect of the constant value of Tier 1 on the excess capital models (market and
book) and excess of the Tier 1 capital ratio.
The sample is comprised of 158 commercial banks and bank holding societies listed in the stock market of 28 European
countries. The data was collected from the Orbis Bank Focus database for the time period of 2011 to 2016.The dependent
variable is placed in the first line for each column. *, **, *** indicate the level of statistical significance of 10%, 5% and 1%,
respectively.
Dependent Variable Excess equity capital
(market)
Excess equity capital (book) Excess Tier1 Capital Constant 0.168*** 0.344*** -0.042*** Standard error (0.057) (0.066) (0.066) Elasticity 2.947 5.194 -4,638 Size -0.029*** -0.037*** -0.012*** Standard error (0.004) (0.006) (0.004) Elasticity -6.490 -6.451 -2.935 Market-to-Book 0.206*** 0,002 0.147*** Standard error (0.012) (0.014) (0.014) Elasticity 17.244 0.121 10.567 Profitability 0.148*** 0.143 0.447*** Standard error (0.042) (0.044) (0.084) Elasticity 3.539 3.276 5.297 Collateral 0,005 -0.008 0,073*** Standard error (0.012) (0.012) (0.015) Elasticity 0,468 -0.608 5,297 Dividend 0.013 -0.001 -0.007 Standard error (0.003) ** (0.003) (0.004) Elasticity 4.467 -0,366 -1,971 Asset Risk 0.920*** 0.678*** 0.289*** Standard error (0.049) (0.051) (0.071) Elasticity 18,934 13.236 4,058 GDP growth 0.001** 0.003*** 0.003*** Standard error (0.001) (0.001) (0.001) Elasticity 2,033 4.694 3,963 Inflation 0.002** 0.001 -0.002 Standard error (0.001) (0.001) (0,002) Elasticity 2,022 0.844 -0.881
Log stock market risk -0.188*** -0,046 0.065
Standard error (0.057) (0.061) (0.068)
Elasticity -3.330 -0,746 0,955
Term sctruture spread 0.000 -0.001 -0.001
Standard error (0.001) (0.001) (0.001) Elasticity -0,014 -1,632 -1.413 AB 0,010*** 0,003** 0,006 Standard error 0,004 0,004 0,005 Elasticity 2.760 2,755 1.063 R2 0.637 0.376 0.384 Number of banks 121 121 105 Number of observations 498 498 405
27
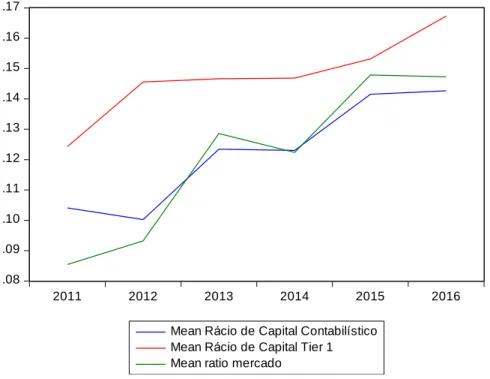
Figure 3 depicts the average progression of the capital ratios (market, book and Tier 1 values) of the sample.
Figure 3. Average Progression of the Capital Ratios
The figure depicts the average progression of the capital ratio regarding the market, book and Tier 1 views for a number of observations of 776, 842 and 669 respectively. The sample of this study was comprised of 158 commercial banks and bank holding societies listed in the stock market of 28 European countries.
.08 .09 .10 .11 .12 .13 .14 .15 .16 .17 2011 2012 2013 2014 2015 2016
Mean Rácio de Capital Contabilístico Mean Rácio de Capital Tier 1 Mean ratio mercado
The plot shows that the market and book capital ratios tend to increase with a slight break from the year 2013 to 2014. It is also evident the almost exponential increase from 2012 to 2013, which is most likely due to the introduction of the Basel III accord. This increased the Tier 1 ratio which lead to banks holding more capital in order to avoid dropping their value below the minimum demanded. In what concerns our figure, the Tier 1 increase is not so evident, remaining practically constant from 2012 up to 2015. This figure depicts several fluctuations of the capital ratios (market, book and Tier 1) outside of the transition period between the Basel II and III accords (from 2012 to 2013). This is consistent with what we previously discussed: the minimum capital requirements do not represent a first order determinant in the capital structure of European banks.
28
Besides, it is also important to highlight that the market ratio was lower than the book ratio up to 2013. This suggests a devaluation of the market value of bank, presumably because this is the post international financial crisis period which carried an increased risk for investors. In a more recent time period, 2015 and 2016, we have the opposite scenario and the plot portrays a valuation of the market regarding the banking sector.
29
5. Conclusion
This essay analyses the determinants of the capital structure of commercial banks and bank holding societies of Europe. The main objective is to understand whether or not the excess capital above the regulatory minimum is influenced by the conditions of the market. Our objective is to find out if the minimum capital requirements are a first order determinant in the capital structure decision.
The sample we used includes data for the time period of 2011 to 2016 and is comprised of 158 commercial banks and bank holding societies of 28 countries from the European Union. In what concerns the explanatory variables the ones used in this study were present in previous studies. These were size, market-to-book, profitability, collateral, dividends and asset risk. Macroeconomic variables were also employed in order to grasp the conditions of the market.
The main contribution of this study is based on the fact that, as far as we know, this is the first analysis of the determinants of European banks for a more recent time period, including data from the Basel III accord. Besides this, our results can represent an important asset for regulators, as well as a challenge for the effectiveness of the capital requirements. Empirical evidence suggests that European banks hold equity above the minimum demanded by the Basel accord. This result is consistent with the Barth et al. (2005), Berger et al. (2008) and Brewer et al. (2008) studies. Besides, our results provide evidence that the capital structure of banks is influenced by the conditions of the market, side-lining the minimum capital requirements established by the Basel accord. This study does not validate the capital structure theory directed towards financial firms – the buffer view. In fact, the coefficients gathered from our study are mostly in agreement with corporate finance theory. In particular, the results indicate that banks with smaller size present less excess capital above the regulatory minimum. On the other hand, banks with more growth opportunities, more profitable and with greater asset risk tend to hold more capital above the regulatory minimum. As for the distribution of dividends and the collateral variables the results are inconclusive. In summary, we validated our first hypothesis (H1) – the capital structure of the banks is influenced by the conditions of the market. We validated our second hypothesis (H2) as well – the determinants of the capital structure of banks behave accordingly to corporate finance theory.
30
Finally, our results also validate the third hypothesis (H3) – the introduction of the Basel accord had a negative impact over the excess capital above the regulatory minimum. In fact, our results suggest that there has been an increase in the capital of banks after the introduction of the Basel III accord. However, this increase in capital was not enough to face the increase in the minimum value demanded from the Tier 1 ratio from 4 to 6 %. In 2016 this situation is reverted meaning that there is an appreciation of the market regarding the banking sector which is supported by the plot from figure 3. Besides, our results suggest an appreciation of the market concerning the banking sector in the post crisis period, which is consistent with an economic recovery.
The main limitation of our study is the lack of data, as mentioned in Chapter 3. The oldest year in the Orbis Bank Focus database was 2011. It would be interesting to consider data from the year 2008 onwards in order to capture the full effect of the Basel II accord. Future research can be based around the analysis of the corporate financial European cloth, in other banks. Or even, studying data from more market-oriented economies or from less developed ones.