Abstract The loss of biotic integrity in ecosystems due to human pressure has been receiving much attention from the scientific community. The primary aim of this study is to understand how the increasing human pressure on natural forests in the Azorean archipelago (North Atlantic) is affecting their epigean arthropod com-munities and which biological parameters it affects most. An expert team did fieldwork covering most of the natural forests (mainly inside nature reserves) of the archipelago using standardized pitfall trapping. To build a multimetric index we tested a number of taxonomic and ecological parameters that can potentially be influenced by disturbance. Sixteen of these were found to be significantly influenced by disturbance in forests. We retained seven metrics due to both, desirable scala-bility properties and relatively low correlation between them. These included the percentages of endemic and predator species richness and also predator abundance, which are inversely related to disturbance; and the percentages of native and saprophagous species richness and introduced and herbivore abundance, which are positively related to disturbance. All seven metrics were combined in an Index of Biotic Integrity (IBI) value. We then proceeded to understand which potential disturbance factors are influencing the biotic integrity of communities and how such influence is felt. Five disturbance factors were found to influence the IBI, although in different ways: the size and fragmentation of reserves, the distance of sites to the reserve borders, the invasion by alien plants and the density of human paths at the sites. Given that only percentages of taxonomical or ecological characteristics were
P. Cardoso (&)
Zoological Museum and Centre for Macroecology, University of Copenhagen, Universitetsparken 15, DK-2100 Copenhagen Ø, Denmark
e-mail: [email protected] P. A. V. Borges Æ C. Gaspar
Departamento de Cieˆncias Agra´rias - CITAA, Universidade dos Ac¸ores, Terra-Cha˜, 9700-851 Angra do Heroı´smo, Terceira, Ac¸ores, Portugal
C. Gaspar
Department of Animal and Plant Sciences, University of Sheffield, Sheffield S10 2TN, UK DOI 10.1007/s10531-006-9078-x
O R I G I N A L P A P E R
Biotic integrity of the arthropod communities
in the natural forests of Azores
Pedro Cardoso Æ Paulo A. V. Borges Æ Clara Gaspar
Received: 2 December 2005 / Accepted: 29 May 2006 / Published online: 16 August 2006 ÓSpringer Science+Business Media B.V. 2006
chosen as metrics, we tested and found the scalability of the IBI to be possible, allowing the comparison of sites with different collecting effort or even the com-parison of reserves with different areas and numbers of collecting sites in each. Finally, we propose a novel graphical representation for multimetric indices like the IBI, one which allows retaining much of the information that is usually lost in multimetric indices.
Keywords Disturbance Æ Endemic species Æ IBI Æ Invasive species Æ
Island ecosystems Æ Macaronesia Æ Metrics Æ Multimetric index Æ Naturalness Æ Scalability
Introduction
The loss of natural forests in the Azorean islands started when the first Portuguese settlers arrived during the 15th century. Nowadays, we have a completely changed landscape and the original ecosystems are restricted to high altitude protected reserves (see Borges et al. 2000, 2005a, 2006). Moreover, we showed elsewhere (Borges et al. 2006) that there are some remarkable differences in the species distribution between sites, those which are located in the centre and those that are found at the borders of reserves: the endemic specialized taxa are restricted to the centre and in less disturbed parts of the reserves. Today the Azorean islands have a combination of pristine forests (notably in Terceira, Pico and Flores) and disturbed primary and secondary native forests mainly as a consequence of the impact caused by the invasion of alien species (see Silva and Smith 2004). However, there is no historical data that can be used to determine the degree of resemblance of the present forests to the ones that occupied the islands before the human settlement.
Biotic (or biological, or biodiversity) integrity was defined as ‘‘the capability of supporting and maintaining a balanced, integrated, adaptive community of organ-isms having a species composition, diversity and functional organization comparable to that of the natural habitat of the region’’ (Karr and Dudley 1981, see also Trombulak et al.2004). Communities showing full integrity are expected, then, to follow their natural path of succession and evolution. Many authors even suggest that the main conservation targets should be the naturalness of the areas and the integrity of respective communities, instead of species diversity or endangered species in particular (Karr 1990; Angermeier 1994; Angermeier and Karr 1994; Majer and Beeston1996; Trombulak et al.2004).
The biotic integrity concept is often used in a sense that implies absence of external human influence, if such conditions exist nowadays (Margules and Usher 1981). In order to measure the degree of integrity of a site we have to define as benchmark of high biotic integrity pristine sites (or ideal theoretical conditions) that, following previously defined criteria, seem to be untouched by human influence. Each site and criterion we want to evaluate is then compared with its corresponding benchmark (Angermeier and Karr 1994; Lyons et al. 1995; Schwartz 1999). The closer the site is to the benchmark, the higher biotic integrity value it has.
The simplest useful surrogate measures of integrity proposed until the present are the site quality indices (SQI of Angermeier and Davideanu2004) and the natural-ness indices (Machado2004). They incorporate rough measures of site disturbance, mainly human related, are very simple to apply and can be extremely useful for rapid
integrity assessment. However, such measures are not always possible to apply and are mostly based on subjective criteria that often depend on the personal experience or opinion of researchers, whose perception of the ecosystem can vary substantially. An index of biotic integrity (IBI) usually incorporates a number of taxonomical and ecological measures that are tested for their ability to respond significantly to human disturbance. Measures that are found to have such characteristics are called metrics and are incorporated, usually summed up, in the index. This way, any index developed for a specific situation is by definition a multimetric index. Although multimetric measures may present some problems, like the possible loss of or masking of important individual metrics, they can, however, be very powerful, allowing for example stakeholders to understand and manage a single value that reflects the overall condition of a site (see discussion in Failing and Gregory2003). Therefore, the integrity indices can provide an easily understandable measure of the degree of health of an ecosystem, which is powerful enough to be scientifically useful, sufficiently flexible to be applied in any place and with any taxon, and easily separated in its various components in order to understand what exactly is happening in a non-pristine site (Karr and Chu2000; Failing and Gregory2003). Moreover, this type of indices can be used both to assess and to monitor the health status of a site, in order to perceive the influence of human pressure in a site over a certain period of time. Biotic integrity indices were primarily developed for inland aquatic systems and have been mostly used with freshwater fish, invertebrate and plant communities (e.g., Anger-meier and Davideanu2004for fishes; Blocksom et al.2002for invertebrates; Ferreira et al.2005 for plants; Griffith et al. 2005for a comparison of all three taxa). They have had an increasing use during the past years with obvious benefits to stake-holders. However, caution should be advised to generalize the scope of an integrity index, it always needs to be modified and tested for different biogeographical areas and/or taxa (e.g., Lyons et al. 1995; Kesminas and Virbickas 2000). In terrestrial ecosystems the IBI approach has seldom been tested, although its usefulness is potentially as large as in aquatic ecosystems (Andreasen et al.2001). Bradford et al. (1998), O’Connell et al. (1998) and Browder et al. (2002) followed similar ap-proaches with the objective of reaching an index based on bird communities. For terrestrial arthropods, Majer and Beeston (1996) have tested the approach in Aus-tralian ant fauna, although this was on a very broad scale and using a very restricted set of metrics. Kimberling et al. (2001) have made a more comprehensive study of arthropod fauna within a delimited area, testing a considerable number of initial potential metrics. The latter authors have also tested some of the disturbance factors present in the study area in order to perceive which ones significantly influence the biotic integrity of a site and to what degree do they influence it.
A desirable attribute of an IBI is that it should be multiscalable and therefore applied at both local and regional levels without any need to change the metrics and respective threshold values (Andreasen et al.2001). It should also not be influenced by collecting effort and consequent differences in communities caused not by intrinsic characteristics but solely by effort and stochastic effects. Although the importance of these attributes in any IBI is relatively straightforward, they have not been taken into account in any previous studies, at least not to our knowledge (but see Andreasen et al.2001).
As already mentioned, a single value can mask or oversimplify a number of other values that led to it. Rightfully, Andreasen et al. (2001) pointed out that a dangerously low metric can be eclipsed by a large value of all the other metrics.
Hence, it is important to understand what exactly is happening to all metrics at a glance, making it perceptible even to the less informed stakeholders. These authors have suggested the use of charts to ease comprehension by scientists and stake-holders alike, also facilitating their communication (also see Machado2004).
This work is a first attempt to develop an index of biotic integrity for the Azorean natural forests using a large dataset of epigean arthropods. Our main aims are: (1) to understand how several taxonomic and ecologic attributes of arthropod communities vary with respect to different levels of disturbance; (2) to develop an index of biotic integrity that can be applied in all Azorean forests; (3) to assess to what extent potential disturbance factors are influencing the integrity of sites; (4) to test the multiscaling possibilities of the proposed IBI; (5) to demonstrate the utility of a novel graphical representation for multimetric indices like the IBI.
Materials and methods Fieldwork
For this work we used data of epigean arthropods obtained in 84 natural forest sites distributed in 21 protected areas (hereafter called reserves for simplification pur-poses) with varying management status. This was in 7 of the 9 Azorean islands distributed over the three island groups, i.e., western, central and eastern (see also Borges et al. 2000,2005afor further details regarding the reserves). The fieldwork was developed under the BALA project—‘‘Biodiversity of Arthropods in the Laurisilva of the Azores’’, which intends to inventory and study the distribution patterns of almost all orders of arthropods (excluding Crustacea, Acari, Collembola, Hymenoptera and Diptera) in the natural forests of the archipelago. Thirty-nine sites out of 84 were located in one of the islands, Terceira, which showed the largest range of disturbance levels in natural forests. Each reserve was represented by at least two sampled sites, larger reserves had more sites (Borges et al. unpublished data). At each site, a 150 m long transect was used to capture epigean fauna. Thirty pitfall traps, which are plastic cups with a top diameter of 42 mm and 78 mm deep, were dug into the ground so that the rim of the cup was flush with the soil surface. Half of the traps were filled with approximately 60 ml of a low-attractive solution (anti-freeze liquid) with a small proportion of ethylene glycol, and the other half with the same volume of a general attractive solution (Turquin), made of dark beer and some preservatives (for further details see Turquin 1973). Traps were spaced 5 m from one another, starting with a Turquin trap and alternating with the ethylene traps and were left in the field for 2 weeks, once per site, usually during the months of June, July or September of different years (Borges et al.2005a).
Choosing and testing candidate metrics
As a starting point for further testing we used a number of taxonomic and ecological measures, which we thought a priori as being potentially influenced by human dis-turbance. These were:
– the total abundance and species richness of studied arthropod taxa (2 metrics); – different ecological diversity indices: Shannon–Wiener, Simpson, Margalef,
statistic, Maximum equitability (J), Average equitability (J) per sample, McIn-tosh equitability, Brillouin equitability (12 metrics). All these metrics were cal-culated using the software Species Diversity and Richness (SDR) version 3.0 (Pisces Conservation) (see Henderson and Seaby 2002);
– the ecological diversity indices above applied only to endemic species (12 met-rics). Calculated also using SDR software;
– the abundance and richness of endemic, native and introduced species and respective percentages in each site (12 metrics);
– the abundance and richness of locally rare species according to three criteria: abundance—species that had only one captured individual (which were 31% of all captured species); distribution—species that were only captured in one site (40% of all species), and habitat—species exclusive to natural forests (50% of all species), and respective percentages (12 metrics);
– the abundance and richness of species belonging to four different trophic groups: fungivores, herbivores, predators and saprophagous, and respective percentages (16 metrics);
– the abundance and richness of species belonging to the five most diverse orders: Araneae, Coleoptera, Diplopoda, Hemiptera and Lepidoptera and respective percentages (20 metrics);
– the abundance of the 16 species that were found to be endemic, exclusive of natural forests and with at least 10 captured individuals, and their respective percentages (32 metrics).
A total of 118 parameters were then available to be tested for their ability to reflect habitat disturbance. The objective was to know which of these parameters are significantly different when looking at disturbed and undisturbed sites. To test the hypothesis we compared two independent datasets from two different islands, Flores (in the western group) and Terceira (in the central group). For each island we chose eight pristine or close to pristine sites and four highly disturbed sites in order to find which parameters were significantly different between disturbed and undisturbed areas. We applied the Mann–Whitney U test to both datasets and retained for further testing only those parameters that were found to be always significantly different between disturbed and undisturbed sites and following the same trend (that is consistently higher or lower according to disturbance level). This way each island acted as an independent test validated by the other island.
Some of the parameters that are chosen in the previous step can be made redundant, either because they reflect the same reality or because they are highly correlated. We assumed that parameters were redundant if chosen as both an absolute value and a relative value (e.g., the richness and the percentage of endemic species). We also built a square spearman rank correlation table to check if any two parameters had r > 0.8 in which case redundancy was considered. All calculations were made with Statistica 6 software (Statsoft Inc.2001).
Calculating the IBI
Once the parameters to enter the index were chosen as metrics we had to stan-dardize them and make them unitless, a fundamental requisite of any multimetric index. For that, and taking into account the 24 initial sites, we divided the range of
values of each metric in three and attributed 0 to the third that was mostly repre-sented at disturbed sites, 1 to the middle third and 2 to the third that was mostly represented by pristine sites. This way we had a number of metrics varying from 0 for much degraded sites to 2 for pristine sites. For the IBI value, we summed up the values of all metrics so that the IBI of a site would potentially vary between 0 and 2n, n being the number of metrics. We then calculated the IBI for all sites, reserves and islands.
Evaluating potential disturbance factors
We evaluated the influence of six human disturbance factors for each of the 84 sampled sites: area of the forest reserve where the site was included, fragmentation of the reserve, distance of the transect to the border of the reserve, dominance of alien plants, presence of grazing cattle and abundance of human paths that often cross natural forests. These factors can be easily evaluated and, according to our previous empirical knowledge, could be the most important sources of disturbance for arthropod communities in the Azores. For each factor at each site, we gave a value according to a semi-quantitative scale ranging from zero for no influence of the potential disturbing factor to three for a high degree of influence (Table1). This evaluation was made by visual assessment of each site by PB and CG, which in some cases may be subjective. As an example, there are several fragmentation indices, but the lack of information regarding many of the areas disallowed their use. In this specific case, fragmentation was visually evaluated by also taking personal field experience of the sites into account, given that it is constantly changing and in most cases not evaluated in a rigorous way.
The Kruskal–Wallis test was used to compare the average IBI of different degrees of each disturbance factor. If disturbance values in a factor were found to be sig-nificantly different, we applied the Mann–Whitney U test for every combination of two values in order to find which pairs were in fact different. This way we can know which of the potential disturbance factors are in fact disrupting the arthropod communities, to what degree they are doing it and how strong a factor has to be in order to cause disruption.
Scaling properties of the index
In order to test the multiscaling properties of the IBI and to find out if it is adequate to compare sites, reserves or islands with different collecting effort, number of
Table 1 Evaluation of the degree of influence of each disturbance factor
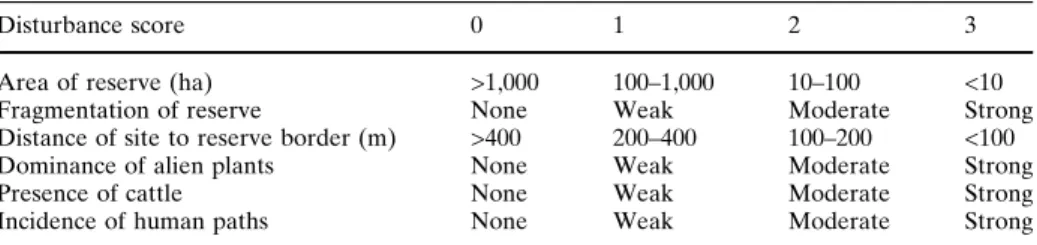
Disturbance score 0 1 2 3
Area of reserve (ha) >1,000 100–1,000 10–100 <10
Fragmentation of reserve None Weak Moderate Strong
Distance of site to reserve border (m) >400 200–400 100–200 <100
Dominance of alien plants None Weak Moderate Strong
Presence of cattle None Weak Moderate Strong
Incidence of human paths None Weak Moderate Strong
collecting sites or area, we did a spearman rank correlation test between the IBI as calculated from the data for an entire reserve or island against the average IBI of all sites inside the respective reserve or island. This way we could confirm if the values were consistent and if the scalability properties of the IBI were real.
Graphical display
As already pointed out by Andreasen et al. (2001), a dangerously low metric can be eclipsed by a large value of all the other metrics. Hence, it is important to under-stand what exactly is happening to all metrics at a glance, making it clear even to the less informed stakeholders. For that, we suggest to represent all metrics graphically, as well as the IBI by itself. In fact, charts ease comprehension by scientists and stakeholders alike, also facilitating their communication (Andreasen et al. 2001; Machado 2004). A pie chart with a number of slices equivalent to the number of metrics, in which the radius of each slice is proportional to the value of the respective metric, allows an easy perception of all metrics. The IBI value itself completes the graphical representation of the index. With such graphical display the index and its metrics can be immediately perceived and evaluated, with no need to look at a quantity of less obvious numbers.
Results
About 28,681 arthropod specimens (excluding Crustacea, Acari, Collembola, Hymenoptera and Diptera) were identified to species or in some cases to morpho-species level and considered in this study. These corresponded to 291 morpho-species of epigeal arthropods (Table2).
Metrics
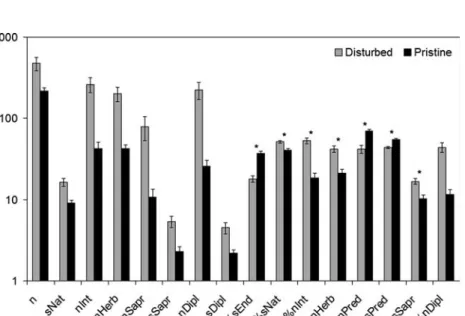
Out of the 118 tested parameters, we found 29 to be significantly different between disturbed and undisturbed sites in Flores and 30 in Terceira. Of these, 17 were common for both islands. The abundance of Aphrodes hamiltoni Quartau and Borges was significantly higher in disturbed sites in Flores but lower in disturbed sites in Terceira. This inconsistency relegated the parameter to be inappropriate for our purposes. Therefore, 16 parameters showed significant and consistent response to disturbance in both islands (Fig.1). Of all the parameters, only the percentage of endemic species and of predator species and individuals were higher in pristine sites, all the other 13 metrics were positively related to disturbance. Many of the parameters (10 out of 16) were represented by both absolute and relative numbers. Given that they are in fact representing the same reality only one of each pair was worth retaining for further testing. In fact, the spearman correlation of all pairs was always higher than the previously set threshold to consider one of them as redundant (spearman r > 0.8). Our aim was to reach a multiscalable index and for that purpose, preference was given to the relative measures, that is, percentages. Of the absolute measures, only three, total abundance, abundance of saprophagous species and richness of Diplopoda, were not represented as relative measures. But the latter two were highly correlated to the percentage of introduced individuals (spearman r = 0.83 and 0.84, respectively), mainly because all these three parameters were
mostly influenced by the presence of introduced saprophagous Diplopoda. For this same reason, the percentages of Diplopoda and introduced individuals were highly correlated (spearman r = 0.85). Therefore, the three measures were found to be redundant if we were to include the percentage of introduced individuals in the IBI. Only the absolute measure n, total number of individuals, was not found to be highly
Table 2 Taxa and specimens
included in the study Order Species Specimens
Araneae 60 5,730 Blattaria 1 126 Chilopoda 6 2,801 Coleoptera 91 4,433 Dermaptera 2 16 Diplopoda 13 5,216 Hemiptera 48 1,987 Lepidoptera 42 1,432 Microcoryphia 2 24 Neuroptera 1 3 Opiliones 2 6453 Orthoptera 1 2 Pseudoscorpiones 3 353 Psocoptera 11 20 Thysanoptera 7 82 Trichoptera 1 3
Fig. 1 The 16 parameters showing significant and consistent response to disturbance in both tested islands (n—number of individuals; sNat—richness of native species; nInt—abundance of introduced species; nHerb—abundance of herbivores; nSapr—abundance of saprophagous species; sSapr—rich-ness of saprophagous species; nDipl—abundance of Diplopoda; sDipl—richsSapr—rich-ness of Diplopoda species; %sEnd—percentage of endemic species; %sNat—percentage of native species; %nInt— percentage of introduced individuals; %nHerb—percentage of herbivorous individuals; %nPred—percentage of predator individuals; %sPred—percentage of predator species; %sSapr—percentage of saprophagous species; %nDipl—percentage of Diplopoda individuals). Error bars represent the standard error. * metrics included in the IBI
correlated with any other parameter (spearman r < 0.6 in all cases). But it is a measure that has a linear correlation with sampling effort or area of the reserve, so it would not allow the scalability of the IBI if included as a metric or the comparison of sites with different collecting effort. Therefore, and taking into account that the other seven parameters left at this point presented desirable scalability properties, we decided not to include it as a metric. Thus the IBI includes seven metrics, all relative measures, three related to the origins of the species (endemic and native species richness and abundance of introduced species) and four related to the trophic group (predator and saprophagous species richness and abundance of herbivores and predators).
Index of biotic integrity
The range of values for each metric present at the 24 initial sites was divided in three (Table3) and it was now possible to calculate the score of each metric and the IBI for all sites, reserves and islands.
The site found to present the most pristine status, with an IBI of 14, was located in the ‘‘Morro Alto e Pico da Se´’’ reserve in Flores, in fact, one of the most pristine forests in the archipelago. The most disturbed sites, with IBI 0, were located at ‘‘Cabec¸o do Fogo’’ and ‘‘Caldeiras Funda e Rasa’’, which are located in two of the most disturbed reserves, lacking a recognizable original forest (in Faial and Flores, respectively).
Disturbance factors
Of the six potential disturbance factors evaluated, only one, the presence of grazing cattle, did not significantly influence the value of the IBI (Kruskal–Wallis test P > 0.05; Fig.2e). All the other five factors were found to be strongly influencing the integrity of forest arthropod communities (Kruskal–Wallis test P < 0.01 in all cases; Fig.2).
We found the area of the reserve to be influencing the IBI only above 100ha (Fig.2a). But the influence is increasingly felt over this value and only above 1,000 ha it is possible to have maximum integrity (Mann–Whitney U test P < 0.01). The fragmentation of reserves shows that below a certain threshold there are no differences in the IBI (Fig.2b). But fragmentation is an important factor at the higher level of the scale, while higher levels cause a decrease in integrity.
Table 3 Quantitative values for each metric and scores for the IBI
Score 0 1 2 %sEnd <24 24–40 >40 %sNat >53 41–53 <41 %nInt >48 27–48 <27 %nHerb >50 30–50 <30 %nPred <43 43–66 >66 %sPred <48 48–60 >60 %sSapr >15 8–15 <8
The distance to borders reveals that only above 400 m of distance it is possible to have high integrity (Fig.2c). Sites closer to the border are much influenced by edge effects which are as strong at the periphery as up to such distance (Mann–Whitney U test P > 0.05).
The IBI shows an apparently negative linear function with the dominance of alien vegetation (Fig.2d). The more the plant community is disrupted by invasive species, the more the arthropod community decreases its IBI in a regular manner.
The existence of human paths is never strong in these forests but a moderate amount of paths causes a decrease in the IBI (Fig.2f). There is no significant dif-ference however, between sites with no human paths or with only a weak influence of this factor (Mann–Whitney U test P > 0.05).
Scaling
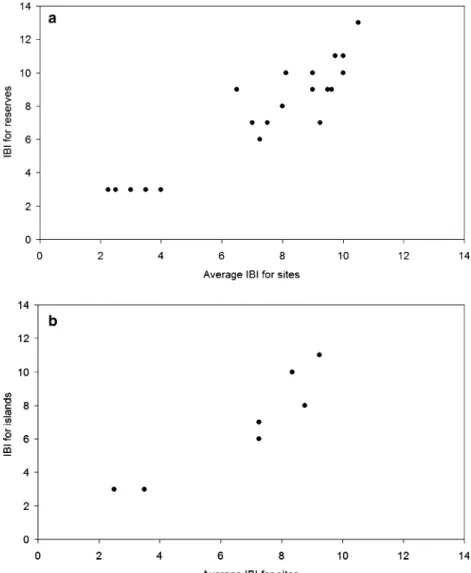
The spearman rank correlation test between the IBI as calculated for entire reserves against the average IBI of all sites inside each reserve was highly significant (r = 0.891, P < 0.001; Fig.3a). This means the IBI is multiscalable and allows the comparison between sites with different numbers of collected sites, collecting effort or area. Likewise, the same happened with the IBI for entire islands (r = 0.945, P < 0.01; Fig.3b). The reserves found to have a higher integrity were ‘‘Topo’’ in Sa˜o Jorge Island (IBI 13) followed by ‘‘Santa Ba´rbara’’ in Terceira and ‘‘Morro Alto e Pico da Se´’’ in Flores (IBI 11). In contrast to these, the reserves with the most decreased integrity were ‘‘Cabec¸o do Fogo’’ (Faial), ‘‘Caldeiras Funda e Rasa’’ (Flores), ‘‘Manhenha’’ (Pico), ‘‘Pico Alto’’ (Santa Maria), ‘‘Algar do Carva˜o’’ and ‘‘Matela’’ (both in Terceira) (IBI 3).
Graphical display
The proposed graphical display for the IBI is demonstrated by the representation of one of the reserves, the one with the highest number of collected sites and respective variation in the value of the index (Santa Ba´rbara at Terceira; Fig.4a). In a different scale, its usefulness is shown by the representation of the island where that reserve is located, which is also one of the islands with the larger number of reserves and with a great variation of IBI values (Terceira; Fig.4b).
Discussion
The Azorean archipelago’s native forests are experiencing multiple impacts due to land use changes, biological invasions and, indirectly, economic growth (see Borges et al. 2006, in press). Moreover, the Azorean terrestrial invertebrates (mainly arthropod fauna) are of overwhelming importance since they compose most of the native fauna of the archipelago (Borges et al. 2005b). It is, therefore, urgent to develop indicators to evaluate and monitor biotic integrity that can specifically be applied to arthropods in terrestrial island ecosystems. There is a long tradition of
Fig. 2 IBI of sites according to the respective disturbance scores (see Table1). (a) area of reserve; (b) fragmentation of reserve; (c) distance of site to reserve border; (d) dominance of alien plants; (e) presence of cattle; (f) incidence of human paths. Error bars represent the standard error
ecologists trying to find reliable biological indicators of human disturbance in natural habitats. Invertebrates have been systematically pointed out as the ideal candidates for such purpose due to their ubiquity, but at the same time due to their limited distribution of many species, enormous diversity, ease of sampling, their ecological importance in ecosystems, and their fast response to environmental changes, with high spatial and temporal precision (see Kremen et al.1993for a review).
Kimberling et al. (2001) were the first to use terrestrial invertebrates to build an Index of Biotic Integrity. Contrary to our results, they observed that richness of several taxa and trophic groups consistently decreased with increasing disturbance. Exceptions of such general trends were the polyphagous carabid species richness and the relative abundance of Collembola that consistently increased. In our case, most
Fig. 3 Comparison of the IBI as determined from the raw data for entire reserves/islands and the average of the IBI values of the respective sites. (a) reserves; (b) islands
Fig. 4 Proposed graphical representation of the index, with the reserve/island limits and the respective site/reserve graphical representation of IBI and its component metrics. (a) ‘‘Santa Ba´rbara’’ forest reserve with sampled sites; (b) Terceira Island with respective reserves. The overall IBI for the reserve/island and the metrics corresponding to each ‘‘slice’’ are shown outside the limits
of the parameters we found to respond to disturbance were positively related to it. Only the percentage of endemic species and of predator species and individuals were found to decrease with disturbance.
Influence of disturbance in community parameters
Although the total species richness of sites is not influenced by disturbance, the number of captured individuals was found to be strongly influenced by it. This may be due to the exploitation of available resources by species with high reproduction capacity.
None of the tested ecological indices, including the once much used ecological diversity indices like Shannon–Wiener or Simpson, responded consistently to dis-turbance. Although disturbance was once advocated to have a strong effect on species diversity (Huston1994), this cannot be supported by our findings. The same result was obtained for at least 28% of the studies relating disturbance and diversity as reported in Mackey and Currie (2001).
All possible origins of species (endemic, native or introduced) respond to disturbance and are related to integrity with respect to at least one of their tested parameters (richness, abundance and respective percentages). The percentage of endemic species was the only one of these to be found to increase with the degree of naturalness of a site. This result was somewhat expected as the endemic species are usually extremely adapted to their habitat, having a high degree of fidelity to it and a low tolerance to changes in environmental or biotic conditions, hence, they usually are the first to suffer from human disturbance. Borges et al. (2006) suggested that there may be two kinds of endemic species in the Azores with regard to resistance to disturbance: a group of fragile oceanic-type forest-dwelling endemic relict arthro-pods, which are less tolerant to disturbance, and a group of more generalist endemic arthropods that are able to survive in disturbed marginal sites particularly rich in introduced species (e.g., the abundance of the endemic cicadellid Aphrodes hamil-toni was significantly higher in disturbed sites in Flores). This pattern may also explain why native species richness was found to increase with disturbance, as generalist endemic and native species may have contributed to the increase of the metric with disturbance. Although disturbance may lead to a significant decrease of native species diversity (e.g., McIntyre and Lavorel 1994; Kimberling et al.2001), this is not always true. In several studies it has been observed that a moderately to heavily disturbed area experiences a raise in the number of species compared to a pristine state (Majer and Beeston 1996; Brown 1997; Lawton et al. 1998). This implies that a peak of diversity could occur at intermediate intensities of disturbance (the so-called ‘‘intermediate-disturbance hypothesis’’) due to the coexistence of competitive species and disturbance-tolerant species (see Mackey and Currie2001). The same pattern was found in our study for native species. The negative relation between species richness and integrity may seem a dilemma, suggesting that a trade-off between diversity and integrity needs to be made. However, it helps to underline the usefulness of these indices, by showing that diversity measures are often no surrogates of biotic integrity. The importance of the IBI becomes even more obvious if we consider that most of those species that gained with increasing disturbance are of limited importance for conservation, as they represent those species which are widely spread in different types of habitats or have even been introduced. In fact, the percentage of introduced species abundance is one of our final metrics. Other studies
showed that biotic integrity is strongly influenced by deliberate or incidentally introduced species, since their richness seems to consistently decrease integrity values (Angermeier 1994; Angermeier and Karr 1994). Usually, no conservation value is attributed to the introduced species diversity. In fact, given that those species may partly exploit the same resources as native ones, which ultimately leads to their local or global extinction (e.g., Human and Gordon1997), such an apparent increase in diversity may have a negative conservation value (Chown et al. 2001; Kier and Barthlott2001; Borges et al.2006). Borges et al. (2006) proposed that, in Terceira, richness of introduced species is spatially related to disturbance related factors at the edges of reserves, whereas richness of endemic species is driven by abiotic factors. It was also proposed that richest endemic assemblages are more prone to invasion due probably to a facilitation process (Borges et al.2006). Our IBI takes these invasion patterns into account by locating the sites where the biotic integrity is decreasing due to an increase in abundance of introduced species.
In previous works and in the present study, the number or proportion of locally rare species may not be related to integrity (e.g., Kirkpatrick and Gilfedder1995). This may be due to the fact that species that are rare in an archipelago scale may not be restricted to it, many even had been introduced from outside the region, or species that are abundant, may in fact be restricted to its pristine forests. Many other factors have to be taken into account, namely the invasion patterns, the extent of the natural forests and other historical causes.
Almost all possible trophic groups (except the fungivores which are represented by only 11 species) respond to disturbance and are related to integrity according to at least one of the tested parameters. The only parameters to respond negatively to disturbance were the richness and abundance of predators. This agrees with the studies of Davies et al. (2000) and Kimberling et al. (2001) (see also Gilbert et al. 1997, Didham et al.1998), which may support the common assumption that high trophic level taxa are relatively intolerant to habitat changes,especially those of human related causes. On the other hand, herbivorous and saprophagous arthropods gained with disturbance. Although the reason for this finding is not straightforward, there may be an explanation for the Azorean forests. In both cases, this holds mostly true for introduced herbivorous and saprophagous species that easily occupy degraded forests in search of food resources (e.g., the millipede Ommatoiulus moreleti (Lucas)). Those species probably have a higher capability of invading natural forests since there are plenty of opportunities and resources in a system characterized by herbivorous and saprophagous native species-poor assemblages.
Only one of the tested orders responded to disturbance, the Diplopoda. As explained, this was reflected in the abundance of introduced and herbivore species given that it is partly caused by the above mentioned species of Diplopoda, an opportunistic species.
None of the endemic species that are exclusive to natural forests responded to disturbance, which can be explained by the fact that most of these species are restricted to an island or group of islands, which imply that they are not useful indicators for the whole archipelago.
Disturbance factors of Azorean forests
Five disturbance factors are the main causes for the loss of integrity in the natural forests of the Azores and for the disruption of the arthropod communities. These
factors respond in different ways to their sources of influence. The forest area is a very important factor to take into account. As expected, the larger the area, the more its integrity is preserved. But it is apparent that smaller than 100 ha (1 km2) areas are not capable of maintaining the integrity of their arthropod communities, probably because the edge effects are felt in a constant way down to the core. Although small forests may be important for other reasons (e.g., unique species, high endemicity; see Borges et al. 2005a) it is important to acknowledge the fact that probably many species are being lost due to disturbance. It is imperative therefore to protect as large an area as possible, moreover because above that threshold, the larger the area, the higher the integrity that can be reached.
Fragmentation is another cause of concern. However, a small level of fragmen-tation is not decisive, and it is usually not enough for arthropod communities to change in any perceptible way (see Margules et al. 1994; Didham et al. 1998). Meanwhile, is moderate to strong fragmentation that should be avoided and this is the problem in many of the Azorean forests, mainly caused by the use of large areas for cattle and agriculture (see also Borges et al.2006,in press).
Related to the previous two factors, edge effects have also an impact on the IBI. This type of disturbance is practically the same up to 400 m from the forest border; only above this distance it is possible to have maximum site integrity values. Given that a site can only be at a large distance from the border if the area is large enough and with a limited fragmentation, this is further evidence for supporting the exis-tence of large reserves and for granting them protection status.
The integrity of arthropod communities is a linear function of the dominance of alien vegetation. This comes as no surprise given that arthropods, especially herbi-vores, are strongly influenced by the vegetation species composition (but see Ribeiro et al.2005). But this may also be because both, plant and arthropod communities, are probably influenced by the other disturbance factors (area, fragmentation, distance to border, paths) in much the same way, that is to say, both taxa respond to disturbance in similar manners. Although this assumption requires further and more thorough testing, this finding is especially important if we realize that one group can probably work as an ecological indicator for the other. If it is possible, for example, to know the degree of dominance of alien plants in any area through remote sensing, it will be possible with a certain degree of confidence to predict the IBI values of arthropod communities in such areas. Then, as with any remote sensing tool, field-work can be directed to certain sites in order to corroborate the estimated values.
Natural forests in the Azores usually are not strongly trodden by human beings, mainly because they comprise rather closed and difficult to penetrate vegetation. However, a moderate use of the forest by people can affect integrity, with all the trampling, vegetation cutting and other causes associated. This effect is not signifi-cant though if this use is limited; sites with weak prevalence of paths usually present no decrease in the IBI.
Conclusion
At a moment when there is a strong emphasis on finding measures of ecosystem sustainability and resilience (see Mayer et al.2004), the index now developed is one possible approach to monitor simple island arthropod communities. Moreover, it is a scalable index that does not depend on collecting effort. With this index we expect in
the near future to: (1) map sites of high and low biotic integrity in the Azores; (2) further explore its utility in other important island habitats such as natural and semi-natural grasslands and canopies of endemic tree species; (3) assess its utility to define different scenarios of ecosystem change in the islands and (4) predict spatial patterns of alien species invasion.
Acknowledgements We are indebted to Joaquı´n Hortal for his suggestions which much improved previous drafts of the manuscript. We also acknowledge Regina Meneses for the English editing of the manuscript. We should also thank all the persons committed in collecting and identifying an enormous number of arthropods, namely: C. Aguiar, J. Amaral, G. Andre´, A. Arraiol, A. Baz, H. Enghoff, F. Ilharco, V. Mahnert, C. Melo, F. Pereira, J.A. Quartau, S. Ribeiro, J. Ribes, A.R.M. Serrano, A.B. Sousa, R.Z. Strassen, L. Vieira, V. Vieira, A. Vitorino and J. Wunderlich. PC was supported by CITAA under the Project ‘‘Crite´rios de escolha de a´reas-padra˜o em estudos de In-tegridade Bio´tica e sua influeˆncia na prioritizac¸a˜o de a´reas naturais para conservac¸a˜o’’. CG was supported by Fundac¸a˜o para a Cieˆncia e a Tecnologia BD/11049/2002. This paper is part of the BALA project (Biodiversity of Arthropods in the Laurisilva of the Azores), which is supported by the Azorean Government (PROJ. 17.01-080203).
References
Andreasen JK, O’Neill RV, Noss R, Slosser NC (2001) Considerations for the development of a terrestrial index of ecological integrity. Ecol Indicators 1:21–35
Angermeier PL (1994) Does biodiversity include artificial diversity? Conserv Biol 8:600–602 Angermeier PL, Davideanu G (2004) Using fish communities to assess streams in Romania: initial
development of an index of biotic integrity. Hydrobiologia 511:65–78
Angermeier PL, Karr JR (1994) Biological integrity versus biological diversity as policy directives. Bioscience 44:690–697
Blocksom KA, Kurtenbach JP, Klemm DJ, Fulk FA, Cormier SM (2002) Development and eval-uation of the lake macroinvertebrate integrity index (LMII) for New Jersey lakes and reservoirs. Environ Monit Assess 77:311–333
Borges PAV, Serrano ARM, Quartau JA (2000) Ranking the Azorean Natural Forest Reserves for conservation using their endemic arthropods. J Insect Conserv 4:129–147
Borges PAV, Aguiar C, Amaral J, Amorim IR, Andre´ G, Arraiol A, Baz A, Dinis F, Enghoff H, Gaspar C, Ilharco F, Mahnert V, Melo C, Pereira F, Quartau JA, Ribeiro S, Ribes J, Serrano ARM, Sousa AB, Strassen RZ, Vieira L, Vieira V, Vitorino A, Wunderlich J (2005a) Ranking protected areas in the Azores using standardized sampling of soil epigean arthropods. Biod Conserv 14:2029–2060
Borges PAV, Cunha R, Gabriel R, Martins AF, Silva L, Vieira V (2005b) A list of the terrestrial fauna (Mollusca and Arthropoda) and flora (Bryophyta, Pteridophyta and Spermatophyta) from the Azores. Universidade dos Ac¸ores and Secretaria Regional do Ambiente dos Ac¸ores, Angra do Heroı´smo, Horta, Ac¸ores
Borges PAV, Lobo JM, Azevedo EB, Gaspar C, Melo C, Nunes LV (2006) Invasibility and species richness of island endemic arthropods: a general model of endemic vs. exotic species. J Biogeogr 33:169–187
Borges PAV, Azevedo EB, Borba A (in press) Biodiversidade e conservac¸a˜o da natureza em ilhas oceaˆnicas: o caso dos Ac¸ores. In: Pereira HM (ed) Portugal Millenium Ecosystem Assessment. Celta Editora, Lisboa
Bradford DF, Franson SE, Neale AC, Heggem DT, Miller GR, Canterbury GE (1998) Bird species assemblages as indicators of biological integrity in Great Basin rangeland. Environ Monit Assess 49:1–22
Browder SF, Johnson DH, Ball IJ (2002) Assemblages of breeding birds as indicators of grassland condition. Ecol Indicators 2:257–270
Brown KS (1997) Diversity, disturbance, and sustainable use of Neotropical forests: insects as indicators for conservation monitoring. J Insect Conserv 1:25–42
Chown SL, Rodrigues ASL, Gremmen NJM, Gaston KJ (2001) World heritage status and conser-vation of Southern Ocean islands. Conserv Biol 15:550–557
Davies KF, Margules CR, Lawrence JF (2000) Which traits of species predict population declines in experimental forest fragments? Ecology 81:1450–1461
Didham RK, Lawton JH, Hammond PM, Eggleton P (1998) Trophic structure stability and extinction dynamics of beetles (Coleoptera) in tropical forest fragments. Philos Trans Roy Soc Lond B 353:437–451
Failing L, Gregory R (2003) Ten common mistakes in designing biodiversity indicators for forest policy. J Environ Manage 68:121–132
Ferreira MT, Rodrı´guez-Gonza´lez PM, Aguiar FC, Albuquerque A (2005) Assessing biotic integrity in Iberian rivers: development of a multimetric plant index. Ecol Indicators 5:137–149 Gilbert F, Gonzalez A, Evans-Freke I (1997) Corridors maintain species richness in the fragmented
landscape of microecosystem. Philos Trans Roy Soc Lond B 265:577–582
Griffith MB, Hill BH, McCormick FH, Kaufmann PR, Herlihy AT, Selle AR (2005) Comparative application of indices of biotic integrity based on periphyton, macroinvertebrates, and fish to southern Rocky Mountain streams. Ecol Indicators 5:117–136
Henderson PA, Seaby RMH (2002) Species diversity and Richness-Projecto Mamiraua´, Version 3.0. Pisces Conservation Ltd
Human KG, Gordon DM (1997) Effects of argentine ants on invertebrate biodiversity in Northern California. Conserv Biol 11:1242–1248
Huston MA (1994) Biological diversity—the coexistence of species on changing landscapes. Cam-bridge University Press, CamCam-bridge
Karr JR (1990) Biological integrity and the goal of environmental legislation: lessons for conser-vation biology. Conserv Biol 4:244–250
Karr JR, Chu EW (2000) Sustaining living rivers. Hydrobiologia 422/423:1–14
Karr JR, Dudley DR (1981) Ecological perspective on water quality. Environ Manage 5:55–68 Kesminas V, Virbickas T (2000) Application of an adapted index of biotic integrity to rivers of
Lithuania. Hydrobiologia 422/423:257–270
Kier G, Barthlott W (2001) Measuring and mapping endemism and species richness: a new methodological approach and its application on the flora of Africa. Biod Conserv 10:1513–1529 Kimberling DN, Karr JR, Fore LS (2001) Measuring human disturbance using terrestrial
inverte-brates in the shrub-steppe of eastern Washington (USA). Ecol Indicators 1:63–81
Kirkpatrick JB, Gilfedder L (1995) Maintaining integrity compared with maintaining rare and threatened taxa in remnant bushland in subhumid Tasmania. Biol Conserv 74:1–8
Kremen C, Colwell RK, Erwin TL, Murphy DD, Noss RF, Sanjayan MA (1993) Terrestrial arthropod assemblages: their use in conservation planning. Conserv Biol 7:796–808
Lawton JH, Bignell DE, Bolton B, Bloemers GF, Eggleton P, Hammond PM, Hodda M, Holt RD, Larsen TB, Mawdsley NA, Stork NE, Srivastava DS., Watt AD (1998) Biodiversity inventories, indicator taxa and effects of habitat modification in tropical forest. Nature 391:72–76
Lyons J, Navarro-Pe´rez S, Cochran PA, Santana E, Guzma´n-Arroyo M (1995) Index of biotic integrity based on fish assemblages for the conservation of streams and rivers in west-central Mexico. Conserv Biol 9:569–584
Mackey RL, Currie DJ (2001) The diversity-disturbance relationship: is it generally strong and peaked? Ecology 82:3479–3492
Margules CR, Milkovits GA, Smith GT (1994) Contrasting effects of habitat fragmentation on the scorpion Cercophonius squama and amphipod Arcitalitrus sylvaticus. Ecology 75:2033–2042 McIntyre S, Lavorel S (1994) Predicting richness of native, rare, and exotic plants in response to
habitat and disturbance variables across a variegated landscape. Conserv Biol 8:521–531 Machado A (2004) An index of naturalness. J Nature Conserv 12:95–110
Majer JD, Beeston G (1996) The Biodiversity Integrity Index: an illustration using ants in western Australia. Conserv Biol 10:65–73
Margules CR, Usher MB (1981) Criteria used in assessing wildlife conservation potential: a review. Biol Conserv 21:79–109
Mayer AL, Thurston HW, Pawlowski CW (2004) The multidisciplinary influence of common sustainability indices. Front Ecol Environ 8:419–426
O’Connell TJ, Jackson LE, Brooks RP (1998) A bird community index of biotic integrity for the mid-Atlantic highlands. Environ Monit Assess 51:145–156
Ribeiro SP, Borges PAV, Gaspar C, Melo C, Serrano ARM, Amaral J, Aguiar C, Andre G, Quartau JA (2005) Canopy insect herbivores in the Azorean Laurisilva forests: key host plant species in a highly generalist insect community. Ecography 28:315–330
Schwartz MW (1999) Choosing the appropriate scale of reserves for conservation. Ann Rev Ecol Syst 30:83–108
Silva L, Smith CW (2004) A characterization of the non-indigenous flora of the Azores Archipelago. Biol Invasions 6:193–204
StatSoft Inc. (2001) STATISTICA (data analysis software system), version 6
Trombulak SC, Omland KS, Robinson JA, Lusk JL, Fleischner TL, Brown G, Domroese M (2004) Principles of conservation biology: recommended guidelines for conservation literacy from the education committee of the Society for Conservation Biology. Conserv Biol 18:1180–1190 Turquin MJ (1973) Une biocenose cavernicole originale pour le Bugey: Le puits de Rappe.