Filter PaPer Method For the deterMiNatioN oF the
Soil Water reteNtioN Curve
eurileny lucas de almeida(1)*, adunias dos Santos teixeira(2), Francisco Chagas da Silva
Filho(3), raimundo Nonato de assis Júnior(4) and raimundo alípio de oliveira leão(2)
(1) Universidade Federal do Ceará, Departamento de Ciências do Solo, Programa de Pós-Graduação em Agronomia - Solos e Nutrição
de Plantas, Fortaleza, Ceará, Brasil.
(2) Universidade Federal do Ceará, Departamento de Engenharia Agrícola, Fortaleza, Ceará, Brasil.
(3) Universidade Federal do Ceará, Departamento de Engenharia Hidráulica e Ambiental, Fortaleza, Ceará, Brasil. (4) Universidade Federal do Ceará, Departamento de Ciências do Solo, Fortaleza, Ceará, Brasil.
* Corresponding author. E-mail: eurileny@yahoo.com.br
aBStraCt
high cost and long time required to determine a retention curve by the conventional methods of the richards Chamber and haines Funnel limit its use; therefore, alternative methods to facilitate this routine are needed. The filter paper method to determine the soil water retention curve was evaluated and compared to the conventional method. undisturbed samples were collected from five different soils. Using a Haines Funnel and Richards Chamber, moisture content was obtained for tensions of 2; 4; 6; 8; 10; 33; 100; 300; 700; and 1,500 kPa. in the filter paper test, the soil matric potential was obtained from the filter-paper calibration equation, and the moisture subsequently determined based on the gravimetric difference. The van Genuchten model was fitted to the observed data of soil matric potential versus moisture. Moisture values of the conventional and the filter paper methods, estimated by the van Genuchten model, were compared. The filter paper method, with R² of 0.99, can be used to determine water retention curves of agricultural soils as an alternative to the conventional method.
Keywords: Richards Chamber, Haines Funnel, Whatman No. 42 filter paper.
iNtroduCtioN
The interactions of soil and water are influenced
by numerous soil properties. the variability and energy state of soil moisture are factors that
influence the hydraulic behaviour of the soil. Since the deficit or excess of available water in relation to
that required by plants can affect production, it is essential to analyse the behaviour of water storage
in the soil to take actions that maximize productivity
without wasting water.
the energetic state of the water when interacting
with the soil matrix is expressed as matric potential.
the graph relating soil moisture to the matric potential is called the soil water retention curve - WRC (libardi, 2010). By this relationship, moisture can be inferred from the matric potential and vice versa.
In the conventional method of WRC determination, a Haines Funnel is used for lower, and a Richards Chamber for higher tensions. the high cost and long period required restrict the use of this conventional method to determine the WRC, indicating the need
to find alternative methods.
The filter paper method is a laboratory technique that has been in use for some time in the field of Civil
Engineering, as noted by Chandler and Gutierrez
(1986). The method was first formally described by
Gardner (1937), and has recently been accepted as a standard method of measuring soil potential (AStM, 2003), reaching far higher ranges of water potential in comparison to other techniques (likos and lu, 2004), and is based on the principle of moisture absorption
by filter paper until there is a balance in potential between filter paper and soil (Ng and Menzies, 2007).
the most commonly used filter papers are Whatman No. 42 and Schleicher & Schuell No. 589-WH (leong et al., 2002; Bulut and Wray, 2005; Bulut and leong, 2008). Among all known methods
for measuring soil water potential, the filter paper
technique is the only method to determine both the total soil water potential and matric potential (Bulut and Wray, 2005; Bulut and leong, 2008; Beddoe et al.,
2010). Houston et al. (1994) examined the influence
of variations in particle size on the matric potential
of soils by the filter paper technique. By the same
method, Rao and Revanasiddappa (2000) investigated the effects of variations on matric potential on the behaviour of compacted clay soils.
the aim of this study was to evaluate a method
using Whatman No. 42 filter paper to establish the soil water retention curve for five different soils, and to
compare results with those of the conventional method.
Material aNd MethodS
For the tests with Whatman No. 42 filter paper, undisturbed soil samples were collected
from five different soils of the Irrigated Perimeter
of the lower Acaraú, Ceará, Brasil: Argissolo V e r m e l h o - A m a r e l o; P l a n o s s o l o; L a t o s s o l o Amarelo; Neossolo Quartzarênico and Latossolo Vermelho-Amarelo. Some of the characteristics of the soils are presented in table 1. Fifteen undisturbed soil samples were taken from each soil type at depth of 0.25 m, representing the 0.20 to 0.30 m layer, in PvC cylinders (height 20 mm, diameter 50 mm).
For a matric potential equal to zero, the saturated moisture was used, calculated by the indirect method for porosity, given by equation 1:
Porosity s
p
(%)= −
1 ρ 100
ρ Eq. 1
where ρs is the soil bulk density and ρp, soil
particle density.
reSuMo: Método do PAPeL-FiLtro PArA obter A CurVA de reteNção de ÁguA No SoLo
o elevado custo de aquisição e o longo período de tempo para obter a curva de retenção pelo método convencional utilizando a câmara de richards e o funil de Haines restringem o uso desses, sendo interessante a busca por métodos alternativos que agilizem a rotina. diante disso, avaliou-se o método do
papel-filtro para obter a curva de retenção de água do solo em comparação com o método convencional.
Coletaram-se amostras indeformadas de cinco diferentes solos. utilizando-se o funil de Haines e a câmara de richards, obtiveram-se as umidades nas tensões 2, 4, 6, 8, 10, 33, 100, 300, 700 e 1.500 kPa. No ensaio
com o papel-filtro, obteve-se o potencial matricial da água por meio da equação de calibração do papel-filtro;
posteriormente, a umidade foi estabelecida pela diferença gravimétrica. o modelo de van genuchten foi ajustado aos dados de potencial matricial versus umidade. Comparando-se os métodos convencional e
papel-filtro por meio dos valores de umidade estimados segundo o modelo de van Genuchten, concluiu-se que o método do papel-filtro, com R² = 0,99, pode ser utilizado para obter as curvas de retenção de água
dos solos agrícolas, sendo o seu uso como alternativa metodológica ao método convencional.
the procedure consists of placing a portion of
filter paper, in contact with a soil sample, with a
geometry and area equal to the top of the ring, in such a way that suction equilibrium is established between them (Figure 1). In this situation, the paper and soil have a different moisture content, but are subjected to the same matric potential.
Filter paper Whatman No. 42 was used, and the calibration equations (Equations 2 and 3) of Chandler et al. (1992).
For u>47 % ψ = 10(6.05 - 2.48 log(u)) Eq. 2
For u≤47 % ψ = 10(4.84 - 0.0622u) Eq. 3
where the matric potential (Ψ) in kPa is estimated
by the correlation with the moisture content of the
filter paper (u).
After saturation by capillary action, all samples
were exposed to air. From the water loss by drainage
and evaporation, determined by the gravimetric
difference, it was possible to begin testing the filter paper method using two Whatman No. 42 filter
papers per sample. In the analysis, one soil sample was used for each moisture level, with only the
upper filter paper being weighed, since the paper
in direct contact with the soil served as protection against impregnation by soil particles to avoid errors of measurement.
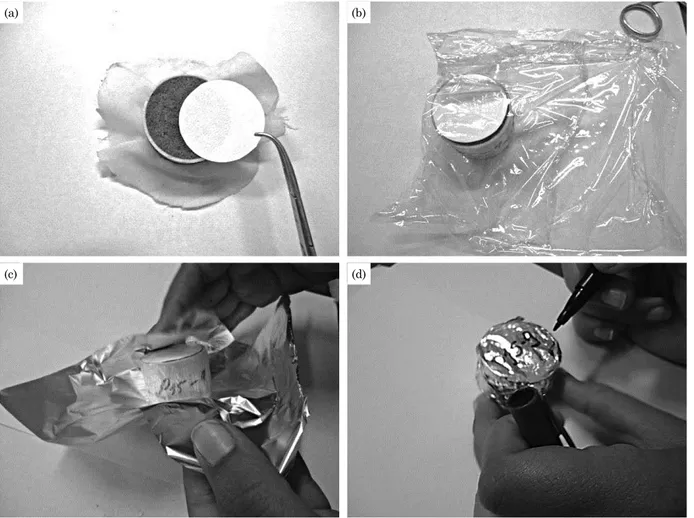
Immediately after contact of the filter paper with the
soil (Figure 2a), the sample was wrapped in PvC plastic
film (Figure 2b) and then in aluminum foil (Figure 2c), identified (Figure 2d) and stored in a styrofoam box,
a procedure designed to prevent the loss or gain of moisture and to maintain a stable temperature.
the period of time the samples remained wrapped
in the PVC film and aluminium foil was based on
the AStM D-5298-93 standard, which determines seven days of storage as necessary for moisture stabilization between soil and paper. Afterwards, the paper was removed from the sample and weighed on an enclosed analytical balance, precise to one 10-thousandth of a gram. the entire procedure was carried out in 3 to 5 s (AStM, 2003), to minimize
moisture loss or gain by the filter paper.
For the WRCs obtained with the Haines Funnel and Richards Pressure Chamber (conventional method) from the five different soils of the Irrigated Perimeter of the lower Acaraú, two new undisturbed samples were collected from a depth of 0.25 m using an Uhland sampler with a cylinder (height 70 mm, diameter 50 mm). these samples were saturated by capillary action, and the moisture content determined by Haines Funnel for the lower tensions: 2, 4, 6, 8 and 10 kPa. A Richards Pressure Chamber was used to determine water content for the higher tensions (33; 100; 300; 700; and 1,500 kPa) (Klute, 1986).
For a matric potential of zero, the saturated moisture was also used, calculated by the indirect method for porosity (Equation 1).
the mathematical model proposed by van
Genuchten (1980) (Equation 4) was fitted to water
retention data for the two methods, by employing the Soil Water Retention Curve software - SWRC (Dourado Neto et al., 2000). For the traditional method, all soil samples from the two replications
were used. For the filter paper method, however,
samples with a matric potential greater than
2,000 kPa, were removed when fitting the curves.
θ θ θ θ
αψ
= + −
+
(
)
r
s r
m
n m
1 Eq. 4
where θr and θs are the contents of residual water
and saturation (m3 m-3), respectively; ψ
m the matric
potential of the soil water (kPa); α (scaler for ψm), m
and n (related to the shape of the curve).
Table 1. Some properties of the five soils from the Irrigated Perimeter of the Lower Acaraú, at depth of 0.20-0.30 m
Soil location
(1)
Sand Silt Clay ρs(2) ρp(3)
longitude latitude
g kg-1 Mg m-3
Argissolo Vermelho-Amarelo (PvA) 376589 9663896 917 24 59 1,614 2,655
Planossolo (S) 379452 9655529 843 53 104 1,614 2,647
Latossolo Amarelo (lA) 379162 9657133 878 38 84 1,666 2,684
Neossolo Quartzarênico (RQo) 379584 9662519 898 38 64 1,698 2,733
Latossolo Vermelho-Amarelo (lvA) 377533 9663981 877 47 76 1,667 2,628
(1) Coordinates UtM, Datum SAD69, Quadrant 24M; (2) ρs: soil bulk density; (3) ρp: soil particle density.
Filter paper
Capillary flow
Soil
the values for moisture content, obtained by adjusting to the two methods, at matric potentials of 1; 2; 4; 6; 10; 20; 30; 40; 50; 60; 70; 80; 90; 100; 200; 300; 400; 500; 1,000; and 1,500 kPa, were correlated using a linear regression equation
(y = a + b x), where y is the moisture content
obtained with the filter paper, x is the moisture content obtained with the traditional method, a and b are the parameters of the regression equation
(intercept and angular coefficient, respectively).
variance analysis of the regression was performed
to statistically verify the existence of the same. The coefficient of determination, root mean square
error (RMSE) (Equation 5), the mean absolute
error (MAE) (Equation 6) and the confidence or performance index (Equation 7) were also obtained. This index is the product of the Pearson correlation coefficient (Equation 8) and Willmott concordance index (Equation 9).
RMSE C O n i i i n = −
(
)
=∑
21 Eq. 5
where rMSe is the root mean square error; n the number of samples; oi the value for the ith datum of soil moisture obtained by the filter paper method, in m3 m-3; C
i the value for the ith datum of soil moisture obtained by the traditional method, m3 m-3.
MAE C O n i i I n = − =
∑
1 Eq. 6
where MAe is the mean absolute error.
c = r d Eq. 7
where c is the confidence or performance index for the method; r the Pearson correlation coefficient;
and the Willmott concordance index.
r
n O C O C
n O O
i i i n i i i n i n i i i n i n =
(
)
− − = = = = =∑
∑
∑
∑
∑
2 1 2 1 − = =∑
∑
n Ci Ci
i n i n 2 1 2 1 1
1 1 Eq. 8
Figure 2. Steps in the sample preparation by the filter paper method: filter paper placed in contact with the surface of the soil sample (a); wrapping the sample in plastic film (b); wrapping in aluminium foil (c); and identifying the sample (d).
(a)
(c)
(b)
d
C O
C O O O
i i i n i i i n = − −
(
)
− + − = =∑
∑
1 2 1 21
(
)
Eq. 9
where Ō is the mean value of soil moisture data by the filter paper method, m³ m-3.
In the case of a perfect correlation without bias, a = 0 and b = 0, R2 = 0, MAe = 0 and rMSe = 0. The
index c ranges from 0, when the confidence level is null, to 1 when perfect. table 2 shows the criteria
used to interpret the performance of the filter paper method by index c.
reSultS aNd diSCuSSioN
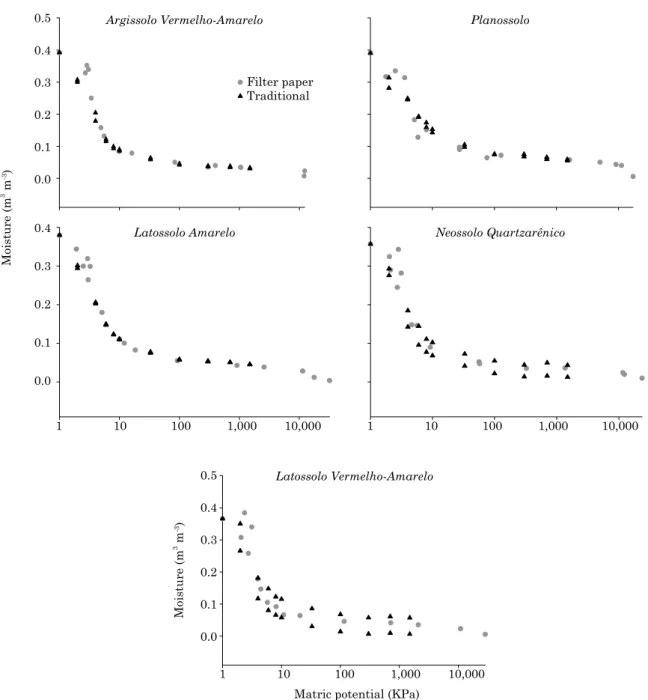
With the filter paper method, the results were
recorded in 20 days, whereas by the traditional method, 120 days were necessary (Figure 3). the greater speed of the filter paper method was emphasized in other studies (Chandler and Gutierrez, 1986; Bulut and leong, 2008; lucas et al., 2011).
the values for matric potential as a function of moisture content followed the same trend in both methods (Figure 3), differing only slightly at higher moisture levels. Similar results were found by Almeida et al. (2011) for one of the soils of the Irrigated Perimeter of the lower Acaraú.
Overestimation of the matric potential by the filter
paper method at higher moisture levels may be due to the higher evaporation rate compared to the lower moisture levels, leading to greater evaporation in the
short time between removal of the filter paper from
the sample and weighing on the precision balance. the problem of evaporation during removal of the
filter paper from the sample and weighing on the
scale was addressed by villar (2002) and Moncada
(2004). In fact, the first author noted the difficulty
and proposed a graph of the variation in moisture
content of the filter paper for the time elapsed after
its removal from contact with the sample. this graph showed that from 25 to 100 s after removal of the
filter paper evaporation took place at a rate of about
1.35 × 10⁻⁵ g s-1, while from 100 to 225 s the rate
was 2.48 × 10⁻⁶ g s-1, about five times less; in other
words, if the variation is not corrected, large errors of interpretation can occur.
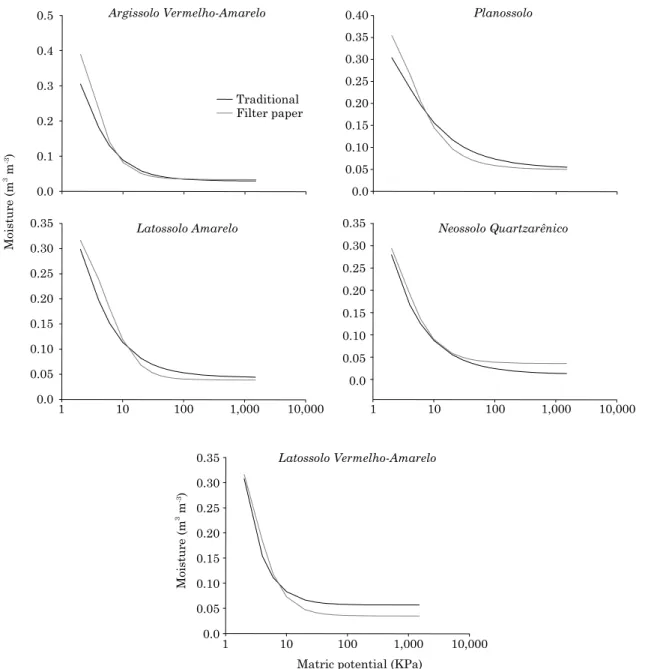
The coefficients of determination of all curves
using the van Genuchten model were higher than 0.99 (table 3 and Figure 4), indicating correspondence between the observed values and those estimated by the adjustment. In addition, the adjustment parameters for the Neossolo Quartzarênico were the closest for both methods,
with the filter paper method possibly being more
suitable for this type of soil. For the S, lA and lvA soils, at around a tension of 10 kPa, there is an equivalence of the moisture content estimated by both methods (Figure 4), where the filter paper method changes from an overestimation to an underestimation of the moisture content in relation to the traditional method. this equivalence in estimated moisture at 10 kPa also occurs for the other two soils, PvA and RQo, however with an increase in soil water tension. While for the PvA, the estimated moisture remains constant,
the overestimation of moisture by the filter paper
method for the RQo, in relation to the traditional method is more pronounced again.
The estimated values of θ (m³ m-³) for the two
methods were similar for the five different soils
(Figure 5), especially for the Neossolo Quartzarênico.
Lucas et al. (2011), using a 0.045 m diameter filter paper between two filter papers of 0.05 m, placed
between two soil samples with the same moisture content, also found fairly similar results between
the filter paper and the conventional methods for
a Latossolo.
By the filter paper method, the higher values
for moisture content were overestimated for the Argissolo Vermelho-Amarelo, Latossolo Amarelo and Latossolo Vermelho-Amarelo (Figure 5). Water content was underestimated for the Planossolo, whereas for the Neossolo Quartzarênico, the R² was 0.99.
the results of the comparison by simple regression analysis between the values obtained
with the filter paper method and the traditional
method, showing the error associated with each method by means of statistical indices and the
confidence or performance index, are shown in table 4. The filter paper method was considered
the dependent variable and the values from the traditional method, the independent variable. the values for the parameters of the regression equation (a and b) were highly significant (p<0.01)
for the five soils.
table 2. interpretation criteria for performance of the filter paper method by the concordance or performance index (c)
value for c(1) Performance
>0.85 Excellent
0.76 at 0.85 very good
0.66 at 0.75 Good
0.61 at 0.65 Moderate
0.51 at 0.60 tolerable
0.41 at 0.50 Poor
≤0.40 very poor
Argissolo Vermelho-Amarelo
0.4 0.5
0.3
0.2
0.1
0.0
0.4 0.5
0.3
0.2
0.1
0.0 0.4
0.3
0.2
0.1
0.0
Moisture (m
3 m -3)
Latossolo Amarelo
Traditional Filter paper
1 10 100 1,000 10,000 1 10 100 1,000 10,000
1 10 100 1,000 10,000
Moisture (m
3 m -3)
Matric potential (KPa) Latossolo Vermelho-Amarelo
Planossolo
Neossolo Quartzarênico
Figure 3. Volumetric moisture content and matric potential obtained by the conventional and filter paper methods, for five different soils of the Irrigated Perimeter of the Lower Acaraú.
Table 3. Adjusted parameters of the soil water retention curves by the conventional method and filter paper method for soils of the irrigated Perimeter of the lower acaraú
Parameter
Pva S la rQo lva Pva S la rQo lva
Conventional method Filter paper
α 0.0537 0.0500 0.0608 0.0648 0.0602 0.0444 0.085 0.0521 0.0592 0.0458 m 0.3400 0.4388 0.2554 0.1016 0.0723 0.1311 0.075 0.1439 0.0983 0.2373 n 3.2785 1.6772 3.4123 9.1374 14.9684 9.8263 7.872 5.9388 10.3682 5.366
θr (m³ m-³) 0.03 0.05 0.04 0.03 0.03 0.03 0.04 0.03 0.03 0.04
θs (m³ m-³) 0.39 0.39 0.38 0.36 0.37 0.39 0.39 0.38 0.36 0.37
R2 0.996 0.997 0.998 0.999 0.997 0.997 0.999 0.999 0.999 0.995
PvA: Argissolo Vermelho-Amarelo; S: Planossolo; lA: Latossolo Amarelo; RQo: Neossolo Quartzarênico; lvA: Latossolo Vermelho-Amarelo; θr and θs: residual moisture and saturated moisture, respectively, α, m and n: empirical parameters, and
Argissolo Vermelho-Amarelo
0.4 0.5
0.3
0.2
0.1
0.0
0.40
0.25 0.30 0.35
0.20
0.15
0.05 0.10
0.0
Moisture (m
3 m -3)
Moisture (m
3 m -3)
Latossolo Amarelo
Traditional Filter paper
0.35 0.35
0.25 0.25
0.30 0.30
0.20 0.20
0.15 0.15
0.10
0.10
0.0
0.0 0.05
0.05
0.35
0.25 0.30
0.20
0.15
0.10
0.0 0.05
1 10 100 1,000 10,000 1 10 100 1,000 10,000
1 10 100 1,000 10,000
Matric potential (KPa) Latossolo Vermelho-Amarelo
Planossolo
Neossolo Quartzarênico
Figure 4. Water retention curves obtained by the conventional and filter paper methods for five different soils of the irrigated Perimeter of the lower acaraú, adjusted by the van Genuchten model.
The confidence or performance index was excellent (Table 4), and the mean absolute error
(MAe) and the root mean square error (RMSE)
were close to zero for the five soils of the Irrigated
Perimeter of the lower Acaraú, showing that the
filter paper method can be used to obtain the water
retention curve for the soils under study.
As the estimated regression equation simply establishes a functional relationship between the variables x and y, but does not explain whether a variation in x significantly influences a variation in y (Ribeiro Filho, 2004), it was necessary to perform analysis of variance of the regression of
the results obtained with the filter paper method
and the traditional method. the regression
analysis at a significance level of 99 % (significance
F, see table 4), showed that the proposed model is suitable for studying the variable moisture
level by the filter paper method, as a function
of the variable moisture level obtained with the traditional method.
Argissolo Vermelho-Amarelo
ŷ = -0.0045 + 1.1526x R2 = 0.9805
y = x 0.6
0.4 0.5
0.3
0.2
0.1
0.0
θ
- filter paper (m
3 m -3)
Latossolo Amarelo
ŷ = -0.0127 + 1.0882x R2 = 0.9812
y = x 0.6
0.4 0.5
0.3
0.2
0.1
0.0
0.0 0.1 0.2 0.3 0.4 0.5
θ
- filter paper (m
3 m -3)
θ traditional (m3 m-3) Latossolo Vermelho-Amarelo
ŷ = -0.025 + 1.1014x R2 = 0.986
y = x 0.6
0.4 0.5
0.3
0.2
0.1
0.0
0.0 0.1 0.2 0.3 0.4 0.5
Planossolo
ŷ = -0.0251 + 1.1808x R2 = 0.9892
y = x
Neossolo Quartzarênico
ŷ = 0.0176 + 0.9465x R2 = 0.9927
y = x
0.0 0.1 0.2 0.3 0.4 0.5
Figure 5. Volumetric moisture content estimated by the conventional method and the filter paper method for the Argissolo Vermelho-Amarelo, Planossolo, Latossolo Amarelo, Neossolo Quartzarênico and Latossolo Vermelho-Amarelo.
Table 4. Evaluation of the filter paper method
Soil a b Significance F RMSE MAE r d c Performance PvA -0.0045 1.1526* 2.58E-20 0.021 0.009 0.990 0.990 0.980 Excellent S -0.0251 1.1808* 4.06E-23 0.018 0.015 0.995 0.990 0.985 Excellent lA -0.0127 1.0882* 1.72E-20 0.015 0.013 0.991 0.993 0.984 Excellent RQo 0.0176 0.9465* 5.02E-25 0.017 0.015 0.996 0.992 0.989 Excellent lvA -0.0250 1.1014* 6.91E-22 0.021 0.020 0.993 0.986 0.979 Excellent PvA: Argissolo Vermelho-Amarelo; S: Planossolo; lA: Latossolo Amarelo; RQo: Neossolo Quartzarênico; lvA: Latossolo Vermelho-Amarelo; a: linear coefficient of the regression equation; b: angular coefficient of the regression equation; rMSe: root mean square error; MAe: mean absolute error; r: Pearson correlation coefficient; d: Willmott concordance index; c: confidence or
CoNCluSioN
the technique using Whatman No. 42 contact
filter paper proved to be a quick and simple method
to determine the soil water retention curve.
reFereNCeS
Almeida EL, Teixeira AL, Silva Filho FC, Cruz TML, Lima
RMM. Obtenção de curvas características de retenção de água no solo obtidas por diferentes métodos. In: Anais do 33º Congresso Brasileiro de Ciências do Solo [CD-ROM]; 2011; Uberlândia. Uberlândia: Sociedade Brasileira de Ciências do Solo; 2011. American Society for testing Materials - AStM. AStM-D 5298-03. Standard test method for measurement of soil potential
(suction) using filter paper. West Conshohocken, PA: 2003.
Beddoe RA, take WA, Rowe RK. Development of suction measurement techniques to quantify the water retention behaviour of GCls. Geosynth Int. 2010;17:301-12.
Bulut R, leong EC. Indirect measurement of suction. Geotech Geol Eng. 2008;26:633-44.
Bulut R, Wray WK. Free energy of water-suction-in filter papers.
Geotech test J. 2005;28:355-64.
Camargo AP, Sentelhas PC. Avaliação do desempenho de diferentes métodos de estimativa da evapotranspiração potencial no Estado de São Paulo, Brasil. R Bras Agrometeorol. 1997;5:89-97. Chandler RJ, Crilly MS, Montgomery-Smith G. A low-cost method of assessing clay desiccation for low-rise-buildings. Proc Inst Civil Eng. 1992;92:82-9.
Chandler RJ, Gutierrez CI. The filter-paper method of suction
measurement. Geotechnique. 1986;36:265-8.
Dourado Neto D, Nielsen DR, Hopmans JW, Reichardt K, Bacchi OOS. Software to model soil water retention curves (SWRC, version 2.00). Sci Agric. 2000;57:191-2.
Gardner R. A method of measuring the capillary tension of soil moisture over a wide moisture range. Soil Sci. 1937;43:227-83. Griffith GW, Roughley RJ, Pitman tM, Spohr lJ. Factors affecting the determination of the moisture characteristics of peat
by the filter paper method. Soil Biol Biochem. 1991;23:1065-70. Houston SL, Houston WN, Wagner AM. Laboratory filter paper
suction measurements. Geotech test J. 1994;17:185-94. Klute A. Water retention: laboratory methods. In: Klute A, editor. Methods of soil analysis. 2nd.ed. Madison: American Society of
Agronomy; Soil Science Society of America; 1986. Pt 1. p.635-62.
Leong EC, He L, Rahardjo H. Factors affecting the filter paper
method for total and matric suction measurements. Geotech test J. 2002;25:322-33.
libardi Pl. Água no solo. In: De Jong van lier Q, editor. Física do solo. viçosa, MG: Sociedade Brasileira de Ciência do Solo; 2010. p.103-52. lu N, likos WJ. Unsaturated soil mechanics. New Jersey: John Wiley & Sons; 2004.
lucas JFR, tavares MHF, Cardoso Dl, Cássaro FAM. Curva de
retenção de água no solo pelo método do papel-filtro. R Bras Ci
Solo. 2011;35:1957-73.
Moncada MPH. Estudo em laboratório de características de
colapso e transporte de solutos associados à infiltração de licor
cáustico em solo laterítico [tese]. Rio de Janeiro: Pontifícia Universidade Católica do Rio de Janeiro; 2004.
Ng CWW, Menzies B. Advanced unsaturated soil mechanics end engineering. Abingdon [UK]: taylor & Francis; 2007.
Rao BSM, Revanasiddappa KJ. Role of matric suction in collapse of compacted clay soil. Geotech Geoenviron Eng. 2000;126:85-90.
Ribeiro Filho JI. Analises estatística no Excel: guia prático.
viçosa, MG: Universidade Federal de viçosa; 2004.
van Genuchten Mth. A closed-from equation for predicting the conductivity of unsaturated soils. Soil Sci Soc Am J. 1980;44:892-8. villar lFS. Estudo do adensamento e ressecamento de resíduos
de mineração e processamento da bauxita [tese]. Rio de Janeiro: