EVALUATION OF TECHNOLOGICAL INTENSITY OF EXPORTS IN THE
FORESTRY SECTOR
1Orlando Monteiro da Silva2* and Júlia Maria Novaes Dias3
1 Received on 16.04.2014 accepted for publication on 17.02.2015.
2 Universidade Federal de Viçosa, Centro de Ciências Humanas Letras e Artes, Departamento de Economia, Viçosa, MG
-Brasil. E-mail: <odasilva@ufv.br>.
3 Fundação Arthur Bernardes, FUNARBE, Viçosa, MG - Brasil. E-mail: <Julianovaesdias@gmail.com>. *Corresponding author.
ABSTRACT – One of the fastest growing sectors in the domestic industry is the forestry, which has contributed significantly to economic development, job creation, income taxes, putting Brazil in a prominent position in the world market. This paper analyzes the evolution of the technological intensity of 12 main products exported by the sector, from 2000 to 2011. For that, utilizes an indicator called PRODY, which allows classifying different products according to their technological intensity or income content and considers the GDP per capita of exporting countries of each product, weighted by its revealed comparative advantage. It can be seen by the results, a continuous growth in all products’ technology indicators and their decomposition into income effects, comparative advantage and joint effects, allowed to verify the main causes of this growth. Products with lower PRODY values are those that presented a higher evolution during the period studied. Products of higher processing, and those from pulp and paper industry, had greater technological advances, thanks to a joint effect, while the ones of lower processing, had a technological improvement due to the increase in GDP per capita in exporting countries. Sawn wood was the standout product, being the only one who proved to be dependent of comparative advantage effect, confirming that this industry has been reinventing itself and incorporating, in fact, more technology. This study revealed the importance of technological intensification to generate comparative advantage and be able to stand against international competition.
Keywords: Technological intensity; Forestry sector; Exports.
AVALIAÇÃO DA INTENSIDADE TECNOLÓGICA DAS EXPORTAÇÕES NO
SETOR FLORESTAL
RESUMO – Um dos setores de maior crescimento na indústria nacional é o florestal que tem contribuído significativamente para o desenvolvimento econômico, geração de empregos, renda, impostos, colocando o Brasil em posição de destaque no mercado mundial. Esse trabalho analisa a evolução da intensidade tecnológica dos 12 principais produtos exportados pelo setor, no período de 2000 a 2011. Para tanto, fez-se uso de um indicador chamado PRODY, que permite classificar os diferentes produtos de acordo com a sua intensidade tecnológica, ou conteúdo de renda, levando em consideração o PIB per capita dos países exportadores de cada produto, ponderado pela sua vantagem comparativa revelada. Pelos resultados encontrados percebe-se um crescimento contínuo no indicador de tecnologia de todos os produtos, enquanto a sua decomposição nos efeitos renda, vantagem comparativa e misto, permitiu verificar as principais causas desse crescimento. Os produtos com menores valores PRODY são os que apresentaram uma maior evolução no período estudado. Os de maior processamento, e aqueles da indústria de papel e celulose, tiveram maior incremento tecnológico, graças a um efeito misto, enquanto que, os de menor processamento, tiveram um incremento tecnológico explicado pelo aumento no PIB per capita dos países exportadores. A madeira serrada foi o produto de destaque, sendo o único que se mostrou dependente do efeito vantagem comparativa, confirmando que tal indústria tem se reinventado e incorporado, de fato, mais tecnologia. O estudo revelou a importância da intensificação tecnológica em gerar vantagem comparativa e, por conseguinte, se destacar frente à concorrência internacional.
1. INTRODUCTION
Brazilian exports have been presenting a continuous growth in the last years, what allowed the country to change from the position 26th, in 2002, to the 22nd, in 2012, according to the World Trade Organization (WTO, 2013). Also, the percentage share of Brazilian exports increased from 0.96%, in 2002, to 1.44% in 2011, which occurred, primarily, due to the increased flow of trade with Asian countries (DEPLA, 2012). In terms of value, Brazil‘s total exports nearly have quadrupled, in the period between 2002 and 2012, from 57 to 235 billion of dollars.
Several products have contributed to this growth in Brazilian exports, mainly primary ones, whose demand from emerging countries such as China, India and Russia have grown a lot in the period. However it is important to highlight the role of forestry products in this scenario, which has been outstanding among the fastest growing in the domestic industry, contributing significantly to the economic development of the country. Accordingly to the “Instituto de Pesquisas e Estudos Florestais” (IPEF, 2002) the forestry sector contributed, in 2002, with nearly 5% in the formation of the national gross domestic product, and 8% of exports. Furthermore, it generated, on that same year, 1.6 million of direct employments, 5.6 million of indirect employments and an annual income of R$20 billion. Because of the diversification of the agenda, this sector’s participation in Brazilian exports has decreased over the years, being currently in 3.3%, but in terms of exported values, the current are four times larger than those from 10 years ago.
According to Valverde et al. (2004), it was the policy of tax incentives to the reforestation, which occurred between 1965 and 1988, that allowed a large increase of the reforested areas in the country. The favorable conditions of weather, land, territorial extension, labor, infrastructure and productive management skills, led Brazil to develop a great competitive advantage on the wood production, which allowed the development of a manufacturing sector, also competitive and who has generated many resources for the country.
Considering a group of 12 forestry products with a larger participation in Brazilian exports, it can be verified from figure 1, that occurred a positive evolution of the exports, with a group of selected products1, as a whole, representing in 2012, a share of 3.30% of Brazil‘s total exports.
Selected products are part of different industries both within the forest sector, for example, the pulp and paper industry and the sawn wood industry, of which, each one of the segments have different characteristics and, because of it, they contribute differently to the participation of the forestry sector in Brazilian economy. Pulp and paper industry was represented here by the following products: chemical wood pulp, other than dissolving grades; uncoated paper and paperboard; chemical wood pulp, dissolving grades; paper and paperboard, coated on one or both sides with Kaolin; paper, paperboard, cellulose wadding and webs of cellulose fibers, coated.
Nowadays, the pulp and paper industry is the most successful of Brazilian forestry sector and is distinguished by the fact that, since the beginning of its activities in the country, it has focused on exports and sought operate in a position to compete with major producing countries, since the market is characterized by a strong international competition (CARVALHO et al., 2005).
Other industries in the forestry sector were also analyzed by Carvalho; Soares e Valverde (2005) who highlighted the importance of reconstituted wood panel industry. According to the authors, these industries are smaller than cellulose, but have been following quickly the tendency of modernization to ensure competitiveness. Between the main characteristics, stand out the fact of being presented in large sets and in small number of production units, of being capital intensive, vertically integrated, opened and the fact that they have a high degree of professionalization. The products considered on this case were: panels of wood fibers or other ligneous materials.
Figure 1 – Export value of forestry products group selected from the period 2000-2012. Billion US$. Figura 1 – Valor das exportações do grupo de produtos florestais
selecionados no período 2000-2012. Bilhões US$.
1 0 2 3 4 5 6 7 8 9
2000 2001 2002 2003 2004 2005 2006 2007 2008 2009 2010 2011 2010
Bi
lli
on
s U
The sawn wood industry considers the lumber or chipped lengthwise, of tropical wood, which is distinguished from the sectors mentioned above because the production comes from small businesses and usually, with a high operational cost. According to Noce et al. (2003), the increase in exports of sawn wood, between 1997 and 1999, has occurred due to the economic boom of the countries to which Brazil exported and the competitiveness effect, deriving from factors such as: low costs, quality of the product and favorable exchange rates.
The plywood industry, represented here by the plywood/veneer, has a large part of its produced volume directed for export, having also, great emphasis in the world market. On this case, as well, the competitiveness demonstrated between 1998 and 2000, has occurred due to favorable relative prices, good quality of the product, favorable growth of world trade and the right choice of hot markets (NOCE et al., 2007). As obstacles still remaining are mentioned: the low investments in technology, deficient production structure and high costs of raw material (native forests of the northern region), increasing economic, social and environmental costs.
Other selected products are part of a sector in the industry, with products of a higher aggregated value, being represented by the joinery or carpentry for construction and also, by wooden furniture of a kind used in the bedroom. According to ABIMCI (2000) apud Carvalho; Soares; Valverde (2005) this industry was formed in the late 80‘s, it has derived from the sawn wood industry, which tented to aggregate value to its products, seeking the commercialization on the furniture segment, nationally and internationally. These industries are, usually, in a lower number and in higher units of production, besides having average investments in technology, having low degree of vertical integration and being opened.
In view of the economic relevance of each one of these industries, it would be important to evaluate the degree to which each of these sectors is evolving, in terms of productivity and of technological content. The quantification of these variables in each sector is hard, but recent developments allow us to calculate close substitutes to the technological content of different products exported, based on comparative advantage and per capita income growth of countries. This is
the goal of the present study, which intends to calculate the annual income content of 12 forestry products exported by Brazil, that were selected according to their share of international trade flows in the sector. The analysis comprises the period between 2000 and 2011, utilizing world data of export and indicators of technological intensity, classifying different products according to their productivity. It also intends to break down the indicators calculated in effects: comparative advantage, income growth and joint effect.
Besides the introduction, on section 2 of this study, there is a theoretical simplified revision and a presentation of the methodology for calculating the technological intensity indicators. On section 3, are presented and discussed the results, while the section 4 concludes the study.
2. MATERIAL AND METHODS
The empirical model utilized on this study allows calculating the income content or technological sophistication of different products exported by Brazilian forestry sector, and its decomposition in terms of comparative advantage obtained by the increase on productivity and, in terms of per capita income growth of exporting countries.
There are alternative methods for calculating income content or sophistication of products exported by determined countries, that are based on the analysis of research and development content (R&D) of each one of considered products. However, it is hard to collect and measure the variables related to R&D from each product. Thus, the empirical model utilized on the present work is based on the income content index, which is a weighted average of the Gross Domestic Product (GDP) per capita of exporting countries, by the revealed comparative advantage, representing so, the income level associated to it.
possible to empirical measure, as deterministic in terms of implications to the growth.
For each product i, the sophistication index, commonly called PRODY, is calculated as:
Where, c = VCRic/ , with VCR = / / / ,
c=(1,2,3,...,M) and Yc=gross domestic product per capita of each country. M is the number of countries and the weights (ci) normalize the revealed comparative advantage index (RCA) of Balassa, of country C, relative to all other countries that export product i.
In equation (1), PRODYi indicates the level of sophistication of product i and it is measured as a weighted average of GDP per capita of all countries from group C that export product i. On the variable weighting (ci), ( / ) corresponds to product i share in the total value of country C exports, showing the importance of this product on the total exports of that country. Ratio VCRic/ VCRid make the sum of the weights equal to the unit, such that weights show the importance of product i on country C exports, relative to all countries who export that product.
By construction, products with a high PRODY value are those for which countries with higher incomes have a leading role in relation to other trading partners. The implicit assumption is that high wages are present where comparative advantages are determined by factors, such as technology, public infrastructure, research centers, etc, instead of labor costs.
PRODY values can change over time, due to changes on countries‘ GDPs per capita (income), due to changes on revealed comparative advantages (competitiveness), or to a mixture of both.
Called Pi the value PRODY of product i on period
t, it is possible to obtain the decomposition of changes on the index from period t to period t+n, such as:
First component on the right side of expression (6) represents the income effect, and shows how PRODY index changes when revealed comparative advantages (RCA) from different products don‘t change, between periods t and t+n. The third component represents the RCA effect, and shows how PRODY index changes when there aren‘t changes on countries‘ income between periods t and t+n. The component in the middle shows a joint effect, and considers the fact that the impact of changes on values RCA and GDP, from a determined country, depends on changes of trade structure.
The logic behind utilizing RCA as a weight, is that it guarantees that the country‘s size don‘t distort the ranking of goods. The authors Hausmann; Hwang; Rodrik (2007) consider an example involving clothing from Bangladesh and USA. In 1995, USA exported for 6-digit category 6203332, the value of US$28,800,000.00, exceeding values of Bangladesh‘s exports, which were US$19,400,000.00. Although, this commodity constituted only 0.005% of USA‘s total exports, comparing to 0.6% for Bangladesh. As defined before, PRODY index allows to weigh Bangladesh‘s income more strongly than USA‘s income, by calculating the level of productiveness associated to clothing, even that American exports are much larger in volume than that from Bangladesh. 2.1. Data
Data utilized on this work are annual and are referred to the period between 2000 and 2011. Trade data were extracted from the data base of United Nations Commodity Trade Statistics (UNCOMTRADE) called World Integrated Trade Solution (WITS, 2013), and income data (GDP) were extracted from World Bank (World Bank Open Data). To calculate PRODY index, export data covered 5,111 different products from 167 countries and referred to the level of 6-digit Harmonized System of Commodity Classification (SH6), available on the Table of Tax incidence on Industrialized Products (TIPI) found on the Federal Revenue Service‘s website. In such classification, forestry products considered were: 440122 - Wood in chips or particles; 440729 - Wood sawn or chipped lengthwise; 440920 - Wood continuously shaped; 441119 - Panels of wood fibers or other ligneous materials; 441219 - Plywood, veneered
PRODY =i
cc ic*YcXi c Xc
Xi X
Xi cX c
t
(2)
(3)
(4)
(5) (1)
panels and similar laminated wood; 441820 - Builders’ joinery and carpentry of wood; 470200 - Chemical wood pulp, dissolving grades; 470329 - Chemical wood pulp other than dissolving grades; 480252 - Uncoated paper and paperboard; 481091 - Paper and paperboard, coated on one or both sides with Kaolin; 481139 - Paper, paperboard, cellulose wadding and webs of cellulose fibers, coated; 940350 - Wooden furniture of a kind used in the bedroom.
3. RESULTS
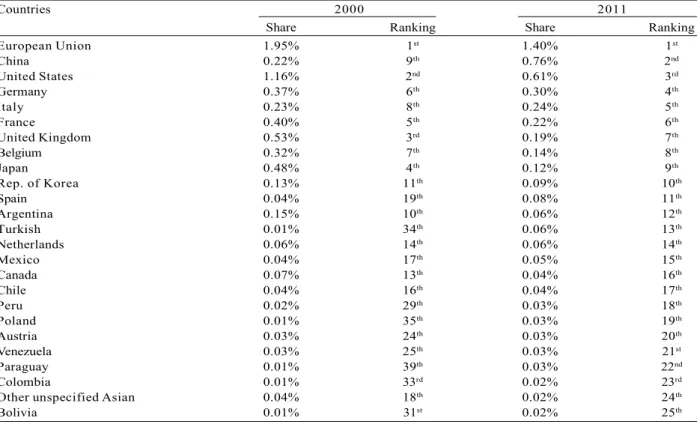
Table 1 shows the main destinations for Brazilian exports of forestry products, considered here. Were used the shares of importers of such products in the total exported by Brazil, considering the 25 most important countries. It was also examined the evolution of this share during the period between 2000 and 2011. First destination for Brazilian exports of forestry products was European Union, that even having a small fall, has maintained such placing in the period. China stood out too, to rise from 9th place in 2000 to 2nd in
2011, showing an increase of 0.54 percentage points in its share. Other important changes were those that occurred on the Turkish market, which kept the 34th position in 2000 and became the 13th importer of Brazilian forestry products, in 2011. Significant changes were also from Peru and Colombia, where the first went from the 29th position to the 18th and the second from the 33rd to the 23rd position.
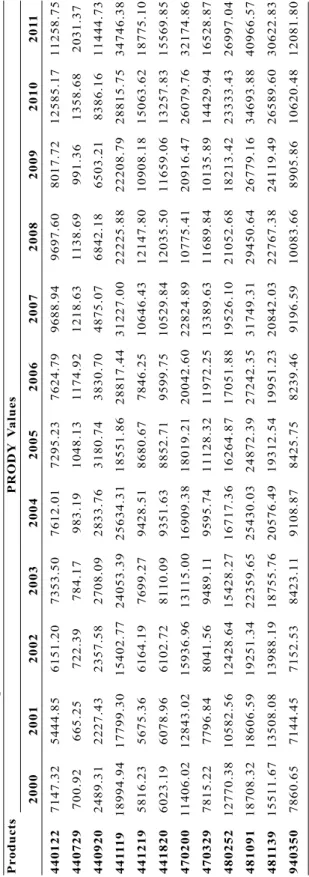
PRODY values (income content index) calculated for 12 forestry products selected in the study are shown in table 2 and the evolution of larger and smaller values are found in figure 2.
All selected products are exported by more than one country, and so, PRODY values (income content) represent the sum of per capita incomes of each country, weighted by the importance of each of the products in international trade, or by its revealed comparative advantage. Products with lower PRODY values were the ones with codes HS 440729 (Wood sawn or chipped lengthwise) and HS 440920 (Wood continuously shaped), while the
Countries 2000 2011
Share Ranking Share Ranking
European Union 1.95% 1st 1.40% 1st
China 0.22% 9th 0.76% 2nd
United States 1.16% 2nd 0.61% 3rd
Germany 0.37% 6th 0.30% 4th
Italy 0.23% 8th 0.24% 5th
France 0.40% 5th 0.22% 6th
United Kingdom 0.53% 3rd 0.19% 7th
Belgium 0.32% 7th 0.14% 8th
Japan 0.48% 4th 0.12% 9th
Rep. of Korea 0.13% 11th 0.09% 10th
Spain 0.04% 19th 0.08% 11th
Argentina 0.15% 10th 0.06% 12th
Turkish 0.01% 34th 0.06% 13th
Netherlands 0.06% 14th 0.06% 14th
Mexico 0.04% 17th 0.05% 15th
Canada 0.07% 13th 0.04% 16th
Chile 0.04% 16th 0.04% 17th
Peru 0.02% 29th 0.03% 18th
Poland 0.01% 35th 0.03% 19th
Austria 0.03% 24th 0.03% 20th
Venezuela 0.03% 25th 0.03% 21st
Paraguay 0.01% 39th 0.03% 22nd
Colombia 0.01% 33rd 0.02% 23rd
Other unspecified Asian 0.04% 18th 0.02% 24th
Bolivia 0.01% 31st 0.02% 25th
Table 1 – Countries with the greater import share of Brazilian forestry products in 2000 and 2011.
Tabela 1 – Países com maior participação na importação de produtos florestais do Brasil nos anos 2000 e 2011.
products with higher values were HS 441119 (Panels of wood fibers), HS 481139 (Paper, paperboard, cellulose wadding and webs of cellulose fibers, coated) and, HS 481091 (Paper and paperboard, coated on one or both sides with Kaolin).
Upper lines of figure 2 represent products with higher PRODY values (sophistication) of the sector. Although an almost continuous growth, is important to highlight that the decrease on PRODY values, of most of the products between years 2008 and 2009, had occurred due to the international financial crisis, which reduced trade across the board and the GDP of exporting countries, influencing the technological intensity indexes directly. Except for the product HS 481139, the largest declines occurred exactly in the more sophisticated products, but, with recovery already in 2010, for most of the products considered here.
The breakdown of values PRODY for each of the forestry products in the effects: revealed comparative advantage, income and joint, between years 2000 and 2011, are shown on table 3.
4. DISCUSSION
The growth in trade flow of forestry products to China followed the growth trend of total bilateral trade Brazil-China in recent years and which consists, mainly, in primary products and semi manufactured, that supply the demand, each time higher, from Chinese industries. According to Machado e Ferraz (2006) the trade flow bewteen both countries started to increase, more consistently after 2001, due to the change on currency politicy and, also, due to the increase on Chinese demand
Figure 2 – PRODY index evolution of selected products from the period 2000-2011.
Figura 2 – Evolução do PRODY de produtos selecionados no período 2000-2011.
5000 0 10000 15000 20000 25000 30000 35000 40000 45000
2000 2001 2002 2003 2004 2005 2006 2007 2008 2009 2010 2011
by products traditionaly sold by Brazil, such as the derived from wood. Such movement allowed, between 2000 and 2003, Brazilian exports to China to advance from US$1.1 billion to US$4.5 billion, evolution that kept increasing in subsequent years.
It is also worth highlighting individual countries from European Union, such as Germany, France, United Kingdom, Belgium and, United States and Japan, that despite of having a decrease on their percentage share, as buyers of Brazilian forestry products, are still the most important importers. Among them, the one that showed the most significant drop was the United States that reduced their participation from 1.16% to 0.61%. Noce, et.al. (2005) had already noticed this fall, explained by the economic slowdown in traditional markets such as that from European Union and United States, and by a larger participation of alternative markets, such as China. This direct relationship between economic growth of countries and a higher demand for forestry products, can be also seen by the increased participation of Turkey, Peru and Colombia.
The product who exhibited the lower PRODY value (lower technological intensity) was the wood sawn or chipped lengthwise, corresponding to the code 440729 from Harmonized System (SH6). Such a product is part of the sawn wood industry that really adds little technology in the forest sector and, therefore, this was an expected result, considering the low degree of “sophistication” of this product related to the others. Although the indicator has shown a value of only 700.92 in 2000, occurred a significant growth over the period
(190%), going to 2,031.37 in 2011, and, corresponding to the third product with the highest growth rate. It can be inferred from this result, that sawmills have aggregated a larger technological value to its products, but they still show a high potential of growth.
To Rodrigues et al. (2004), the sawn wood industry is characterized by the diversity of final products and production processes, employing modern technologies and specializing in product lines with target on the world market, which helps to clarify the expressive variation on its PRODY index.
Product classified by code 440920 (Wood continuously shaped) presented much like the wood sawn behavior, described before, but with a higher growth of the indicator, on the end of the period. The index of technological intensity or “sophistication” of 2,489.47, in 2000, reached 11,444.31 in 2011, with a variation of 376% in 11 years. A similar movement occurred, also, with the product 441219 (Plywood, veneered panels and similar laminated wood). It had a relatively low value for the indicator in the beginning, presented a great evolution throughout the period under study, indicating a significant incorporation of technology by the primary industries from the forestry sector.
Product 481091 (Paper and paperboard, coated on one or both sides with Kaolin) was the one who exhibited the highest PRODY value. Product 481139 (Paper, paperboard, cellulose wadding and webs of cellulose fibers, coated) also presented a large index, the second highest on the group. Because they belong
Table 3 – Decomposition of PRODY values between 2000 and 2011. Tabela 3 – Decomposição dos valores PRODY entre os anos 2000 e 2011.
Code PRODY 2000 PRODY Variation Ranking Comparative Income Joint
2011 Rate Advantage Effect Effect
(%) Effect (%) (%) (%)
440122 7147.32 11258.75 57.52 11th 85.33 204.51 -232.32 440729 700.92 2031.37 189.81 3rd 1252.90 1249.38 -2312.46 440920 2489.31 11444.73 359.76 1st 72.49 328.69 -41.43 441119 18994.94 34746.38 82.92 10th -59.15 10.01 132.06 441219 5816.23 18775.10 222.81 2nd 6.26 183.57 32.98 441820 6023.19 15569.85 158.50 5th 115.34 229.90 -186.74 470200 11406.02 32174.86 182.09 4th -1.92 239.44 -55.44 470329 7815.22 16528.87 111.50 7th -29.06 63.80 76.76 480252 12770.38 26997.04 111.40 8th -10.30 17.11 104.60 481091 18708.32 40966.57 118.98 6th -78.78 -8.18 205.93 481139 15511.67 30622.83 97.42 9th -29.76 10.82 116.35 940350 7860.65 12081.80 53.70 12th -16.85 80.68 -10.13
to the pulp and paper industry, they corresponded to the expectations; in view that such industry is that one who incorporates more technology in the sector. Coelho Junior, et al. (2010) corroborate the previous statements by noting that the pulp and paper industry is capital intensive and that pulp production is marked by its inherent economies of scale, by the necessity of large initial investments and a long maturation period of the project, besides requiring an existing technological capacity.
Although products 481091 (Paper and paperboard, coated on one or both sides with Kaolin) and 481139 (Paper, paperboard, cellulose wadding and webs of cellulose fibers, coated) have presented the highest values for the index, they occupied, respectively, the 6th and 9th positions on the index growth between 2000 and 2011. This lower relative growth is explained by the fact that they are already in a higher level in terms of technological intensity. However, they still showed growth rates of 118.98% and 97.42%, respectively.
Finally, there is the product 940350 (Wooden furniture of a kind used in the bedroom) that showed more stable values for technological content over time. Such product is part of the furniture industry, a derivation with a higher aggregated value from sawn wood industry, so, characterized by the requirement of medium investments in technology. The rise of the index during the period was 53.70%, showing that the product did not follow the technological evolution of other products from this sector.
By breaking down the total variation, is possible to verify that products with less processing, such as wood continuously shaped (440920); plywood, veneered panels and similar laminated wood (441219) and builders’ joinery and carpentry of wood (441820), depended more on the income growth of exporters countries (income effect). The large variation on technology index of these products verified over the period analyzed was due to the growth of per capita income of these countries, which in general, are the poorest countries.
Among the products of less elaboration in the sector, wood sawn (440729) was the only that showed to be dependent on the comparative advantage effect and not on the income effect. It is important to highlight that the revealed comparative advantage effect compares the share of a product on the total exports of a country, with its share on the total world exports. This way,
is verified that occurred an investment on this sector by exporters countries, which allowed them to rise their comparative advantage over the other countries and, consequently, to reach higher levels of technological intensity. We reaffirm here what has already been cited by Rodrigues et al. (2004), that such firms have been changing their profile during the years and aggregating value to the feedstock by employing new technologies, given that a large proportion of production is directed for export.
Regarding the products of higher processing, such as the ones from pulp and paper industry, referred to the codes 470329, 480252, 481091 and 481139, it was found that the increase on the indexes is explained by the joint effect (income and technology). What means that the variation on PRODY indexes was due to a joint variation on per capita income and on comparative advantages of exporters countries, in other words, it was a result of a change in the commerce structure as a whole. Such products are marketed by richer countries and who have sufficient capital to obtain comparative advantage over the others, in view of a huge international competition.
5. CONCLUSION
As a whole, the group of products selected represented, in 2012, a portion of 3.30% of total Brazilian exports. However, the current values are almost four times greater than those of 10 years ago, enhancing its importance to Brazil’s economy.
In terms of main destinations for exports, was observed that traditional importers of Brazilian forestry products, such as European Union and United States, have been losing ground for the Asian market.
The calculation of PRODY index indicates growth in technological content, or productivity, for all products, which was already expected, considering that the same is weighted by income per capita, an indicator that tends to grow over time. So it was important to breakdown the index in different effects.
Products that showed higher PRODY values were also those with lower growth rates in the period considered. The opposite occurred for products with lower PRODY values.
a joint effect, so, by a structural change in the market. The most disparate product was the wood sawn, that presented an index dependent on comparative advantage effect, so, demonstrating that such industry has been reinventing itself and incorporating more technology.
Brazil has already a great comparative advantage in forestry production and so, is among world leaders in the sector. Regarding the products of lower procedure, results had showed that, the country has the opportunity to stand out even more, if increases this comparative advantage, through technological intensification.
6. REFERENCES
CARVALHO, R.M.; SOARES, T.S.; VALVERDE, S.R. Caracterização do setor florestal: Uma abordagem comparativa com outros setores da economia. Ciência Florestal, v.15, n.1, p.105-118, 2005.
DEPLA; SECEX; MDIC. Balança Comercial Brasileira - dados consolidados. Brasília: 2012.
HAUSMANN, R.; HWANG, J.; RODRIK, D. What you export matters. 2007. (NBER Working Paper, 11905)
INSTITUTO DE PESQUISAS E ESTUDOS FLORESTAIS – IPEF. Ciência e Tecnologia no Setor Florestal Brasileiro:
diagnóstico, prioridades e modelo de financiamento. Piracicaba: 2002. 187p.
COELHO JUNIOR, L.M; REZENDE, J.L.P.; ÁVILA, E.S. Analysis of the brazilian cellulose industry concentration (1998-2007). Cerne, v.16, n.2, p.209-216, 2010.
MACHADO, J.B.; FERRAZ, G.T. Comércio Externo da China: efeitos sobre as
exportações brasileiras. Brasília: 2006.
NOCE, R,; CARVALHO, R.M.M.A.; SOARES,T.S.; SILVA, M.L. Desempenho do Brasil nas
exportações de madeira serrada. Revista Árvore, v.27, n.5, p.695-700, 2003.
NOCE, R.; SILVA, M.L.; CARVALHO, R.M.M.A.; SOARES, T.S. Concentração das exportações no mercado internacional de madeira serrada. Revista Árvore, v.29, n.3, p.431-437, 2005.
NOCE, R.;SILVA, M.L.; MENDES, L.M.; SOUZA, A.L.; SILVA, O.M.; OLIVEIRA,J.M. Preço relativo e competitividade no mercado internacional de compensado. Cerne, v.13, n.1, p.51-56, 2007.
RODRIGUES, M.; RESENDE, L.M.; KOVALESKI, J.L. Tecnologia e exportação: o caso do polo exportador de madeiras serradas e beneficiadas da região de Ponta Grossa-PR. In: SIMPÓSIO DE ENGENHARIA DE PRODUÇÃO - SIMPEP, 11., 2004, Bauru. Anais... Bauru: UNESP, 2004.
VALVERDE, S.R.; SOARES,N.S.; SILVA, M.L.; JACOVINE, L.A.G.; NEIVA,S.A. O Comportamento do mercado da madeira de eucalipto no Brasil. Biomassa & Energia, v.1, n.4, p.393-403, 2004.
WORLD BANK. World Bank Open Data. Disponível em: <http://www.worldbank.org/>. Acesso em: 11 de dez. de 2013.
WITS - WORLD INTEGRATED TRADE SOLUTION. Disponível em: <http://
wits.worldbank.org/wits/>. Acesso em: 03 de nov. de 2013.