Received June 15, 2009 and accepted July 28, 2011. Corresponding author: [email protected]
Carcass traits of Nellore, F
1Simmental × Nellore and F
1Angus × Nellore steers
fed at maintenance or
ad libitum
with two concentrate levels in the diet
1Ivanna Moraes de Oliveira2, Pedro Veiga Rodrigues Paulino2, Sebastião de Campos Valadares Filho2, Edenio Detmann2, Mário Fonseca Paulino2, Lúcio Alberto de Miranda
Gomide2, Marcio de Souza Duarte2, Victor Rezende Moreira Couto2
1Research financed by FAPEMIG. 2Universidade Federal de Viçosa.
ABSTRACT - This trial was conducted to evaluate the quantitative carcass traits of Nellore, F1 Simmental × Nellore and F1 Angus × Nellore steers fed at maintenance level or ad libitum with 1% and 2% of the body weight in concentrate. The animals were allotted to the treatments in a completely randomized experimental design, in a 3 × 3 factorial arrangement. The animals fed the ad libitum diet with more concentrate had greater cold carcass weight, cold carcass yield and longissimus muscle area/ 100 kg of cold carcass weight when compared with animals fed the diet with low concentrate allowance. There was no difference between the ad libitum diets for all of the carcass cuts yields, except for top sirloin. Crossbred animals had cold carcass yield larger than the Nellore animals. F1 Angus × Nellore animals had greater rib fat thickness and smaller longissimus muscle area/ 100 kg than the F1 Simmental × Nellore cattle. The yield of commercial carcass cuts was not influenced by genetic group, except for the shoulder clod yield, which was smaller in crossbred animals compared with Nellore animals. The longissimus
muscle area, rib fat thickness and rump fat, taken by ultrasound were influenced by the body weight of the animals. Crossbred animals fed diets with higher concentrate level produce carcasses most suitable for the requirements of the market.
Key Words: carcass yield, longissimus muscle area, tissue deposition www.sbz.org.br
Introduction
With the recent challenges in the Brazilian beef industry, concepts about the production system adopted by the beef producers must be reviewed. The understanding of production standardization and reduction of the cost of interest on the capital invested in animals is necessary to improve the productivity with the quality standard required by the international market.
Even though Brazil has advantages regarding beef production compared with some other countries, the Brazilian beef chain presents productivity and economic index below the expected for an efficient beef production system. For that reason, the use of feedlot animals has increased in Brazil, as the rate of weight gain with high energy diets is greater than with roughage-based diets which reduce the time that cattle need to be fed (Duarte et al., 2011).
The Brazilian cattle herd is composed mainly of Bos
indicus animals (Alves et al., 2004), mostly by Nellore,
which present lower growth potential compared with Taurine breeds. However, Nellore cattle have more rusticity and adaptability to the tropical environment. Thus, the use
of F1 Bos indicus × Bos Taurus crossbred animals can
maximize the heterosis, mainly with regard to carcass traits. Carcass yield is economically important, as most of the inspected meat commercialized in Brazil is based on carcass weight. In this context, this study was developed to evaluate the influence of the feeding regime on quantitative
characteristics of carcass of Nellore, F1 Simmental × Nellore
and F1 Angus × Nellore.
Material and Methods
This experiment was conducted in the Laboratório Animal of the Departmento de Zootecnia of Universidade Federal de Viçosa (UFV), in Viçosa-MG, from May to September of 2007. Forty-eight steers with average age of
18 months (16 Nellore (N), 16 F1 Simmental × Nellore (SN),
16 F1 Angus × Nellore (AN)) were used.
of adaptation, six animals from each genetic group that were assigned to receive concentrate at levels of 2% of BW were fed concentrate at 1.5% of BW for 7 days and fed concentrate at 2% of BW for 7 days for adaptation to experimental diets. Six animals from each genetic group assigned to receive concentrate at 1% of BW and four animals assigned to be fed at maintenance were fed their treatment diets after the 30 days of adaptation to the experimental conditions.
Analysis of dry matter (DM), organic matter (OM), crude protein (CP), ether extract (EE), and acid detergent fiber (ADF), were performed as described by Silva & Queiroz (2002). For analyzing the neutral detergent fiber (NDF) concentration, samples were treated with alpha thermostable amylase without sodium sulfite and corrected for ash residue (Mertens, 2002) and residual nitrogen compounds (Licitra et al., 1996). The non-fiber carbohydrate content (NFC) was calculated as follows: NFCap = 100 – [(% CP – %CP derived from urea + % urea) + %NDFap + %EE + %Ash]. The apparent total digestible nutrients (TDN) were calculated as (CP intake – fecal CP) + (NDF intake – fecal NDF) + (NFC intake – fecal NFC) + [2.25 × (EE intake – fecal EE)] (Sniffen et al., 1992). Digestible energy was obtained by multiplying the digestible nutrients by their respectively energetic value (NRC, 2001). The concentration of metabolizable energy was considered as 82% of the digestible energy (Coelho da Silva & Leão, 1979).
Chemical composition of the ingredients is presented in Table 1, and ingredients proportion and chemical composition of diets are presented in Table 2.
Animals were confined to individual stalls with feeders
and drinkers and a total area of 30 m2 of which 8 m2 were
covered with asbestos tiles. After analysis of the available ingredients, diets were formulated to be isonitrogenous with 12.5% CP. The animal feed intake was estimated as suggested
Item Cotton seed Soybean hull Soybean meal Corn Corn silage Mineral mixture
Dry matter(% DM) 91.18 88.68 88.61 88.38 28.95
-Organic matter (% DM) 96.91 96.19 94.04 98.97 93.32
-Crude protein(% DM) 23.92 11.85 49.46 8.91 7.13
-Neutral detergent insoluble crude 12.79 40.10 11.68 29.72 19.55 -protein/crude protein (% CP)
Ether extract (% DM) 15.75 1.05 1.48 3.36 2.44
-Neutral detergent fiber, NDF (% DM) 49.63 67.43 17.58 21.95 52.48
-NDFap (% DM)1 45.68 61.68 11.17 18.78 49.13
-Indigestible NDF(% DM) 20.47 6.32 2.60 3.07 19.60
-Non fiber carbohydrates(% DM) 11.56 21.62 31.93 67.92 34.62
-Phosphorus(% DM) 0.94 0.20 1.02 0.50 0.36 15.57
Calcium(% DM) 0.31 0.81 0.56 0.25 0.36 31.54
Magnesium(% DM) 0.29 0.27 0.35 0.11 0.11 0.66
Sodium(% DM) 0.16 0.17 0.11 0.11 0.14 0.23
Potassium (% DM) 1.17 1.31 2.13 0.47 1.28 0.40
1 Neutral detergent fiber corrected for ash and protein.
Table 1 - Chemical composition of the ingredients used in the experimental diets
by Valadares Filho et al. (2006) and the macro and micro minerals requirements were adjusted according to NRC (1996). Concentrates were formulated by using corn meal, soybean meal, cotton seed, soybean hull, urea/ammonium sulphate (9:1) sodium bicarbonate, magnesium oxide, salt and mineral mixture. Corn silage was used as source of roughage. All diets were formulated to contain 20% as the minimum amount of NDF. Through the experiment, the concentrate:roughage ratio was 58.7:41.3 and 24.84:75.16 for diets with concentrate levels at 1% and 2% of BW, respectively.
The experimental period was divided into 3 periods of 28 days each. At the beginning of the experiment, cattle were weighed in order to obtain the average initial body weight (BW), which was 265.6±6.4 kg for N, 325.3±4.7 kg
for F1 Simmental × Nellore and 324.6±6.0 kg for F1 Angus ×
Nellore . Cattle were also weighed on days 28 and 56 of the experimental period.
Diets were fed as total mixed ration (roughage + concentrate) and cattle were fed twice daily (at 6:30 a.m. and 3:30 p.m.) allowing for up to 5-10% of orts. Animals assigned to be fed at maintenance were fed once daily with the same diet of those fed concentrate at 1% of BW. At the first experimental period cattle fed at maintenance were fed concentrate levels of 1.2% BW. However, due to a gain of weight observed in those animals, they were fed concentrate levels of 1% BW after the second experimental period.
At the end of the trial, animals were weighed after a 16-h solid fast and slaughtered by cerebral concussion followed by jugular and carotid venesection following the Normative Instruction no. 3 of 01/13/2000 (Technical Regulation of Methods for Humane Slaughtering of Livestock).
(CCW), 12th rib fat thickness (RFT) and 12th rib longissimus
muscle area (LMA) were measured on the left side of each
carcass. Longissimus muscle areas were traced on
transparency for further measurement and RFT were
measured at ¾ the length ventrally over the longissimus
muscle. Carcass length was recorded by measuring the distance between the anterior edge of the first rib and the anterior edge of the aitch bone (Muller, 1980).
On the right half of each carcass, commercial cut yields were measured, separating the anterior and posterior quarters by cutting between the fifth and sixth ribs. The
forequarter consisted of the chuck, shoulder and flank, and the hindquarter consisted of top sirloin and rump.
Ultrasound measurements of 12th rib fat thickness
(RFT), longissimus muscle area (LMA), and rump fat
thickness (P8) were taken using an Aloka 210DX real-time ultrasound unit (Corometrics Medical Systems, Wallingford, CT) equipped with a 3.5-MHz linear array probe with 17.2 cm of length.
Ultrasound measurements were evaluated by using the simple allometric model: Y = β0 × Xβ1+ ε were: Y = response
variable (LMA, RFT or P8); X = Body weight (kg); β0 =
parameter of scalar adjustment; β1 = allometric coefficient;
and ε = random error. The data were linearized by
anamorphosis, including the effects of feeding regime (1% or 2% of BW) and genetic type to the model described above. The effect of genetic type was analyzed by using Dummy variables (Draper & Smith, 1966).
The experiment was conducted in a completely randomized design in a 3 × 3 factorial arrangement. Treatments
consisted of 3 genetic types (Nellore; F1 Simmental ×
Nellore; F1 Angus × Nellore) and 3 feeding regimes (cattle
fed at maintenance and ad libitum with concentrate levels
at 1 or 2% of BW) with six replicates in each ad libitum
level and four replicates in the group of animals fed at maintenance. Statistical analyses were performed using the PROC GLM procedure of SAS (SAS Inst. Inc., 2000), with significance considered at P<0.05.
Results and Discussion
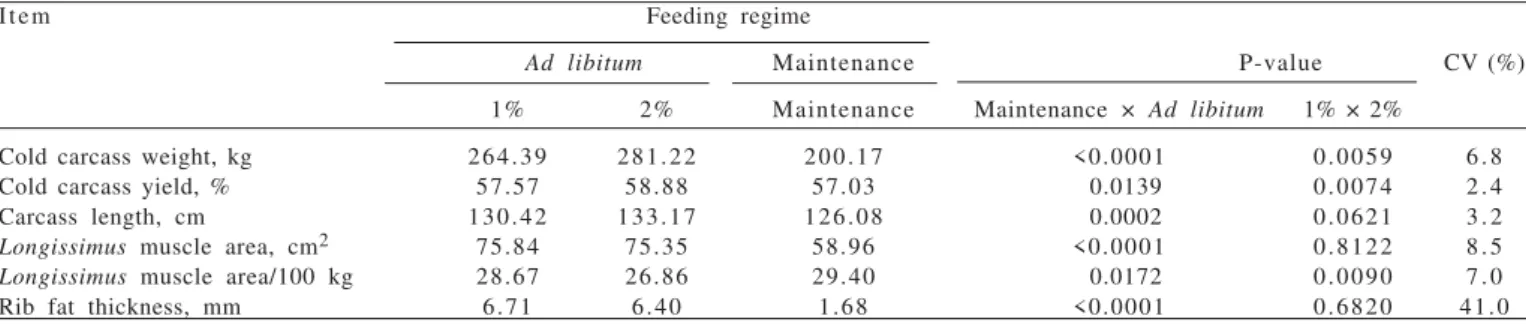
There was no interaction (P<0.05) between feeding regime and genetic type for none of the variables evaluated. Cattle fed at maintenance presented lower values (P<0.05) of all variables evaluated in this trial compared with
cattle fed ad libitum (1% or 2% of BW), with the exception
of LMA/100 kg, which was greater in animals fed at maintenance (Table 3). Animals fed concentrate at 2% of BW presented greater carcass yield (P<0.05) than those fed concentrate at 1% of BW. Cattle fed concentrate at 1% of
CV = coefficient of variation.
Item Feeding regime
Ad libitum Maintenance P-value CV (%)
1% 2% Maintenance Maintenance × Ad libitum 1% × 2%
Cold carcass weight, kg 264.39 281.22 200.17 <0.0001 0.0059 6 . 8 Cold carcass yield, % 57.57 58.88 57.03 0.0139 0.0074 2 . 4 Carcass length, cm 130.42 133.17 126.08 0.0002 0.0621 3 . 2
Longissimus muscle area, cm2 75.84 75.35 58.96 <0.0001 0.8122 8 . 5
Longissimus muscle area/100 kg 28.67 26.86 29.40 0.0172 0.0090 7 . 0
Rib fat thickness, mm 6.71 6.40 1.68 <0.0001 0.6820 41.0
Table 3 - Means and coefficient of variation of carcass traits of beef cattle fed at maintenance and fed concentrate at 1% and 2% of body weight
Ingredient 1% 2%
Concentrate Diet Concentrate Diet
Proportion
Corn silage 58.70 24.84
Cotton seed 12.28 5.07 12.07 9.07 Soybean hull 26.93 11.12 26.66 20.04
Urea 3.17 1.31 1.06 0.80
Ammonium sulfate 0.35 0.14 0.21 0.16 Corn 52.43 21.65 55.07 41.39 Soybean meal 2.02 0.83 2.09 1.57 Mineral mixture 0.69 0.29 0.70 0.52
Salt 0.69 0.29 0.70 0.52
Potassium chloride 0.35 0.14 0.35 0.26 Magnesium oxide 0.32 0.13 0.32 0.24 Sodium bicarbonate 0.64 0.26 0.64 0.48 Limestone 0.14 0.06 0.14 0.11
Dry matter - 53.97 - 74.29
Organic matter 95.72 94.31 95.70 95.11 Crude protein 20.69 12.73 14.96 13.02 Ether extract 4.01 3.09 4.06 3.66 NDFap1 41.18 45.84 35.51 38.89
Non fiber carbohydrates 52.39 41.96 48.21 44.83 Total digestible nutrients - 70.50 - 70.27 Digestible energy - 3.11 - 3.10 Metabolizable energy - 2.54 - 2.54 Phosphorus 0.56 0.44 0.57 0.52
Calcium 0.67 0.49 0.67 0.59
Magnesium 0.35 0.21 0.36 0.30
Sodium 0.55 0.31 0.55 0.45
Potassium 0.95 1.14 0.96 1.04 1 Neutral detergent fiber corrected for ash and protein.
BW presented greater values (P<0.05) of LMA/100kg than those from the group fed concentrate at 2% of BW. No differences were found (P>0.05) for carcass length for cattle fed concentrate at 1% or 2% of BW.
Carcass traits are influenced by growth and development of the animal, which may be defined as mass accumulation and form challenges (Berg & Butterfield, 1976). Animal growth can be affected by genetic and environmental factors, where animal nutrition plays an important role. Cattle fed at maintenance received energy enough only to maintain the vital functions, as the feed level was not enough to provide animal growth, adequate fat and muscle deposition. Thus, animals fed at maintenance presented inadequate carcass traits according to the requirements of Brazilian beef industry, such as at least 3 mm of RFT and 210 kg of carcass weight for castrated cattle (Paulino et al., 2010).
Some internal organs of the body such as liver, kidney, heart and gastrointestinal tract are responsible for up to 40% of energy requirement for maintenance of fasting cattle (Koong et al., 1985). Therefore, it is worth stressing the direct relationship between the size of internal organs and maintenance requirements of beef cattle. These tissues have high protein turnover, relatively higher than those presented by muscle tissue resulting in high cost of energy for a basal metabolism. According to Winter et al. (1976), during feeding restriction there is a reduction in the size of intern organs in relation to the BW, where the growth of liver and intestine is more affected than the growth of the animal, being a tendency to a negative allometric growth. Marcondes et al. (2010) working with the same animals reported that animals fed at maintenance had lower (P<0.05) percentage of organs and viscera (13.63%) compared with
animals fed ad libitum (16.21%). However, animals fed at
maintenance presented lower (P<0.05) carcass yield than
those fed ad libitum, which may be explained by the lower
amount of carcass fat thickness (RFT) and lower muscle mass, evidenciated by the lower LMA (P<0.05). In addition, the carcass from cattle fed at maintenance was shorter
(P<0.05) than those fed ad libitum, which allows inferring
that the growth of animals fed at maintenance was affected. As previously reported, the size of the gastrointestinal tract may vary according to the type of diet that the animals are fed. Cattle fed high levels of concentrate may present a lighter and shorter gastrointestinal tract than animals fed lower levels of concentrate (ARC, 1980), which was not observed in this study. Marcondes et al., (2010) in a study
with the same animals observed that cattle fed ad libitum
had the same percentage of organs and viscera in relation
to empty body weight (16.21%). Thus, it can be inferred
that the greater carcass yield of the animals fed ad libitum
have occurred exclusively due to the greater (P<0.05) carcass weight of these animals (Table 3).
The greater values (P<0.05) of LMA/100 kg observed in animals fed at maintenance may be related to higher proportion of muscle tissue found on the carcass of those
animals (65.11%) compared with those fed ad libitum
(60.5%).
Feed-restricted cattle can minimize the use of energy by reducing the size of organs and viscera (Sainz & Bentley, 1997) as well as modulating the growth of muscle fibers by increasing the frequency of oxidative fibers, which has greater efficiency of energy metabolism than glycolytic fibers (Lefaucher, 2010). Since the intake of metabolizable energy is restricted in animals fed at maintenance, the energy available for fat deposition is critical. Several genes related to structural proteins and enzymes have their expression reduced when the animal is submitted to a feed-restriction, as the energy is mostly used for maintenance of vital functions rather than tissue deposition. According to Faulconnie et al. (2001), feed-restricted animals present a reduction of expression of the lipoprotein lipase, responsible for lipid deposition into the adipocytes. This is a possible explanation for the production of carcass with larger amount of muscles and lower amount of fat in feed-restricted animals. The lower values of LMA/100 kg observed in animals fed concentrate at 2% of BW compared with those fed concentrate at 1% of BW may be related to the excess of available energy that is converted to adipose tissue, consequently reducing the proportion of muscle tissue in the carcass.
According to Owens et al. (1993) the excess of nutrients is converted into lipids, excreted or catabolized. Cattle fed lower levels of concentrate had greater proportion of muscle tissue in the carcass.
The lack of differences (P>0.05) for carcass length
among ad libitum feeding regimes may be explained by
the similar growth presented by the animals fed concentrate at 1% or 2% of BW (1.24 and 1.32 kg/day respectively). The similarity in growth rate implies that those animals had similar deposition of bone tissue in the carcass. On the other hand, the lower value of carcass length (P<0.05) of the animals fed at maintenance compared with those fed
ad libitum may have occurred due to the stabilization of
growth of bone tissue as a consequence of the feed-restriction during a critical early growth phase.
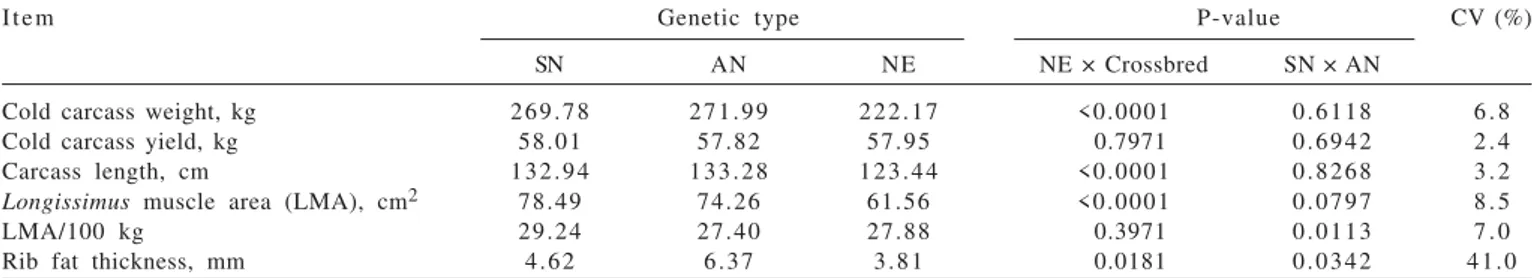
and length of carcass than Simmental × Nellore and Angus × Nellore animals (Table 4). However, no differences
were observed (P>0.05) between F1 Simmental × Nellore
and F1 Angus × Nellore cattle for those variables (Table 4).
With regard to carcass yield, no differences were found (P>0.05) among genetic groups (Table 4). Animals from the Nellore group presented lower values (P<0.05) of LMA than crossbred animals. Similar values of LMA/100 kg (P>0.05) were observed between Nellore and crossbred animals (Table 4). Nonetheless, differences were observed
(P<0.05) for LMA/100 kg of carcass where F1 Simmental
× Nellore animals presented greater values than F1 Angus
× Nellore cattle, which presented greater RFT values (P<0.05) (Table 4).
Feijó et al. (1997), in a study with Simmental × Nellore cattle observed an increase of carcass length of crossbred animals. Vaz & Restle (2001) have found greater values of carcass length in crossbred animals, evidentiating the heterosis of the characteristic.
Differences in carcass yield between genetic types are commonly seen when the time of slaughter is determined by the evaluation of carcass finishing score (Euclides filho et al., 1997), as the some animals can presented the desired finishing score at heavier weights and consequently greater carcass yield. Thus, animals with lighter BW at maturity may present high carcass finishing score and consequently higher carcass yield. However, this was not observed in this study since the time of slaughter was determined by the number of days in feedlot.
The lower carcass weight of Nellore cattle may be explained by the values of carcass length and carcass gain (0.640 kg/d) compared with crossbred animals (0.860 kg/d). Crossbred animals presented greater values of BW gain than Nellore animals, leading to heavier carcasses. Even though SN cattle are considered animals with greater
frame size compared with F1 Angus × Nellore cattle, carcass
length did not differ (P>0.05) between those groups. This may have occurred due to the similar (P>0.05) carcass gain (0.860 kg/d) between those groups. In addition, considering
that Angus cattle have a small frame size, the crossbreeding with Nellore animals may have led to an increase in the size
of these animals compared with those from the F1 Simmental
× Nellore group. Taurine breeds have been intensively selected to produce beef, and thus present high muscle yield in the
carcass when compared with purebred Bos indicus cattle
(Morales et al., 2002). According to Barbosa (1999), Nellore cattle have less growth rate compared with Taurine cattle. Thus, it can be inferred that Nellore animals present late deposition of fat compared with crossbred animals, which might explain the lower values of RFT observed on the carcass of those animals.
Camfield et al. (1997) observed lower deposition of subcutaneous fat tissue in carcass of animals that present greater BW at maturity, which may explain the lower RFT of
the carcass from F1 Simmental × Nellore animals. As there is
a direct relationship in the proportion of muscle:fat tissues
in the carcass, it was expected that F1 Simmental × Nellore
cattle would present greater amount of muscle in the carcass
compared with F1 Angus × Nellore cattle.
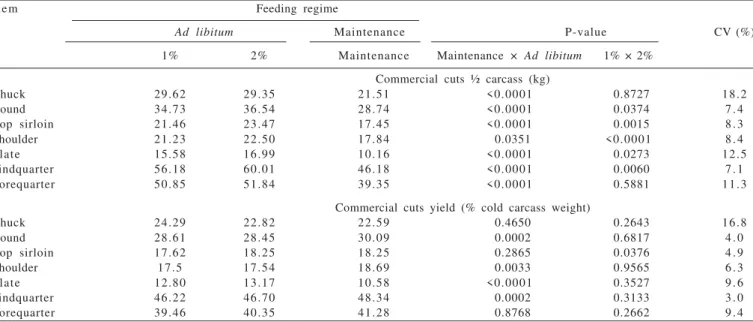
Cattle fed concentrate at 2% BW presented heavier commercial cuts (P<0.05) than animals fed concentrate at 1% BW, with exception of chuck and forequarter, which was similar between those treatments (P>0.05). Animals fed at maintenance had lower (P<0.05) weight of cuts than
animals fed ad libitum. The yield of chuck, top sirloin
and forequarter did not differ (P<0.05) between animals
fed at maintenance and ad libitum. Animals fed at
maintenance had greater yield (P<0.05) of round, shoulder and hindquarter, and lower yield of plate (P<0.05) than
animals fed ad libitum. Cattle fed concentrate at 2% of
BW had greater yield (P<0.05) of top sirloin than those fed concentrate at 1% of BW (Table 5).
Animals were fed at maintenance aiming to maintain the BW without changes in the carcass weight. Consequently, lower weight of commercial cuts was observed in animals
fed at maintenance compared with those fed ad libitum.
The RFT is positively correlated to the amount of fat on the carcass and inversely correlated to commercial cuts
Item Genetic type P-value CV (%)
SN AN NE NE × Crossbred SN × AN
Cold carcass weight, kg 269.78 271.99 222.17 <0.0001 0.6118 6 . 8 Cold carcass yield, kg 58.01 57.82 57.95 0.7971 0.6942 2 . 4 Carcass length, cm 132.94 133.28 123.44 <0.0001 0.8268 3 . 2
Longissimus muscle area (LMA), cm2 78.49 74.26 61.56 <0.0001 0.0797 8 . 5
LMA/100 kg 29.24 27.40 27.88 0.3971 0.0113 7 . 0
Rib fat thickness, mm 4.62 6.37 3.81 0.0181 0.0342 41.0
yield. In addition, fat deposition occurs differently in the different parts of the body of the animal (Berg & Butterfield, 1976). Fat deposition in cattle typically follows the order in which perirenal fat is deposited first, followed by intermuscular, subcutaneous and finally by the intramuscular fat (Sainz & Hasting, 2000). As in any other tissue, adipose development occurs both by hyperplasia and hypertrophy. In the finishing phase, lipocytes that have been developed earlier (intermuscular, perirenal and mesenteric) complete their hyperplasic development and become depots for fat. However, subcutaneous and intramuscular deposits continue to produce new adipocytes, as they accumulate fat (Sainz & Hasting, 2000).
In addition, similarly to bones and adipose tissue, muscle tissue also grows allometrically. Therefore, at birth there is greater development of members and during the post-natal period these muscles present lower growth rate compared with the rest of the muscles (Butterfield & Berg, 1966). It may explain the differences and similarities observed for commercial cuts yield between animals fed at
maintenance and ad libitum (Table 5).
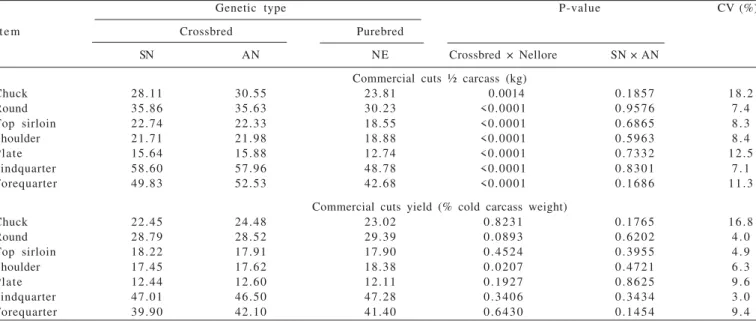
Nellore animals had lighter commercial cuts (P<0.05) than crossbred animals. With the exception of the yield of shoulder from carcass of Nellore animals, no effects (P>0.05) of genetic type on commercial cuts were detected (Table 6). May et al. (1992) reported that carcass from European breeds presents greater commercial cuts yield compared with carcass from Zebu cattle, which was not observed in this study, with the exception of yield of shoulder. In this study, the lack of effects of genetic type, mainly for
proportions of forequarter and hindquarter probably have occurred due to castration of the animals.
In general, differences in proportion of forequarter and hindquarter is commonly seen in non-castrated animals, as in these animals there is greater action of male hormones (testosterone). Due to the lack of action of testosterone, castrated animals present similar proportion of forequarter and hindquarter regardless of the genetic type (Berg & Butterfield, 1976).
According to Costa et al. (2002), the minimum amount of RFT to avoid cold shortening and consequent decrease in beef tenderness is 3 mm. In the Brazilian carcass grade system the lean maturity is evaluated by visual assessment of fat content and fat distribution in the carcass. To be classified as “medium”, carcass must present 3 – 6 mm of RFT. With the exception of animals fed at maintenance, carcass of all animals presented the minimum amount of RFT to be classified for lean maturity as medium.
No differences were found (P>0.05) between genetic types for LMA, RFT and P8 assessed throughout the performance trial. The increase of LMA and fat deposition was affected (P<0.05) by BW, while for the concentrate level there was a trend (P<0.10) for increase of LMA (Table 7). Concentrate level did not affect (P>0.05) fat deposition through the animal growth (Table 7).
Animals fed concentrate at 2% BW had a tendency (P<0.10) to increase LMA throughout the feedlot period compared with animals fed concentrate at 1% BW. This increase in LMA probably occurred due to a better efficiency of metabolizable energy utilization, which can be related to
Item Feeding regime
Ad libitum Maintenance P-value CV (%)
1% 2% Maintenance Maintenance × Ad libitum 1% × 2%
Commercial cuts ½ carcass (kg)
Chuck 29.62 29.35 21.51 <0.0001 0.8727 18.2
Round 34.73 36.54 28.74 <0.0001 0.0374 7 . 4
Top sirloin 21.46 23.47 17.45 <0.0001 0.0015 8 . 3
Shoulder 21.23 22.50 17.84 0.0351 <0.0001 8 . 4
Plate 15.58 16.99 10.16 <0.0001 0.0273 12.5
hindquarter 56.18 60.01 46.18 <0.0001 0.0060 7 . 1
Forequarter 50.85 51.84 39.35 <0.0001 0.5881 11.3
Commercial cuts yield (% cold carcass weight)
Chuck 24.29 22.82 22.59 0.4650 0.2643 16.8
Round 28.61 28.45 30.09 0.0002 0.6817 4 . 0
Top sirloin 17.62 18.25 18.25 0.2865 0.0376 4 . 9
Shoulder 17.5 17.54 18.69 0.0033 0.9565 6 . 3
Plate 12.80 13.17 10.58 <0.0001 0.3527 9 . 6
hindquarter 46.22 46.70 48.34 0.0002 0.3133 3 . 0
Forequarter 39.46 40.35 41.28 0.8768 0.2662 9 . 4
the characteristics of the diet such as its metabilizability (Coelho da Silva & Leão, 1979).
According to Luchiari Filho (2000) the adipose tissue is the most variable tissue in the carcass. Fat deposition occurs primarily in the hindquarter and forequarter, following the vertebral column. As fat deposition goes through the body, there is a tendency of the subcutaneous fat deposition to follow the ventral portions of the carcass (Belk et al. 1991). In addition, fat deposition between the
12th and 13th ribs is lower than deposition on rump until it
reaches 5 mm of thickness (Tait et al., 2005). It might explain the lack of differences of fat deposition on P8 between treatments (Table 7).
The growth of muscle and fat tissue is described by an allometric curve. Thus, the maximum rate of growth occurs
Genetic type P-value CV (%)
Item Crossbred Purebred
SN AN NE Crossbred × Nellore SN × AN
Commercial cuts ½ carcass (kg)
Chuck 28.11 30.55 23.81 0.0014 0.1857 18.2
Round 35.86 35.63 30.23 <0.0001 0.9576 7 . 4
Top sirloin 22.74 22.33 18.55 <0.0001 0.6865 8 . 3
Shoulder 21.71 21.98 18.88 <0.0001 0.5963 8 . 4
Plate 15.64 15.88 12.74 <0.0001 0.7332 12.5
hindquarter 58.60 57.96 48.78 <0.0001 0.8301 7 . 1
Forequarter 49.83 52.53 42.68 <0.0001 0.1686 11.3
Commercial cuts yield (% cold carcass weight)
Chuck 22.45 24.48 23.02 0.8231 0.1765 16.8
Round 28.79 28.52 29.39 0.0893 0.6202 4 . 0
Top sirloin 18.22 17.91 17.90 0.4524 0.3955 4 . 9
Shoulder 17.45 17.62 18.38 0.0207 0.4721 6 . 3
Plate 12.44 12.60 12.11 0.1927 0.8625 9 . 6
hindquarter 47.01 46.50 47.28 0.3406 0.3434 3 . 0
Forequarter 39.90 42.10 41.40 0.6430 0.1454 9 . 4
Table 6 - Means and coefficient of variation (CV) of weight and yield of commercial cuts of Nellore (NE), F1 Simmental × Nellore (SN) and F1 Angus × Nellore (AN) cattle
P-value
Comparisons between genetic type LMA RFT P 8
Nellore × F1 Simmental × Nellore 0.6003 0.9975 0.6212
Nellore × F1 Angus × Simmental 0.7848 0.5665 0.3873
F1 Simmental × Nellore × F1 Angus × Nellore 0.4473 0.5907 0.7409
Direct effects
Body weight 0.0004 0.0178 0.0224
Concentrate level 0.0929 0.6144 0.6023
Interaction effects
Body weight × 1% 0.5819 0.8660 0.7578
Body weight × 2% 0.8096 0.5734 0.5073
Concentrate level ×Body weight 0.1022 0.5978 0.5610
Concentrate level ×F1 Simmental × Nellore 0.7399 0.3412 0.1379 Concentrate level ×F1 Angus × Simmental 0.5731 0.9925 0.1359
Table 7 - Descriptive levels of probability for error type I (P-value) associated to effects evaluated for ultrasound measurements of
longissimus muscle area (LMA), rib fat thickness (RFT) and rump fat thickness (P8)
in different periods, as those tissues present differences in growth and development.
During the animal growth the muscle deposition increases quickly due to the release of growth protein hormones (Cervieri et al., 2005). At puberty, the muscle tissue reaches the maximum growth and decreases until reaching the plateau at maturity. In the following phase the finishing period begins, in which the fat deposition is intensified reducing the rate of growth.
Is noteworthy that growth does not occur linearly and that the body composition is changed throughout the animal lifespan. Assessment of LMA, and fat thickness at
the 12th rib and P8 are important to detect the variations in
tissue deposition allowing the adoption of strategies of production to obtain carcass with characteristics that meet the specific requirement of different markets.
Conclusions
The use of high energy diets for crossbred animals provides heavier carcasses with greater finishing score. Ultrasound measurements allow the evaluation of carcass tissue deposition, with possibility of prediction of the moment in which cattle present better quality of carcass traits.
References
ALVES, D.D.; PAULINO, M.F.; BACKES, A.A. et al. Características de carcaça de bovinos Zebu e cruzados Holandês-Zebu (F1) nas fases de recria e terminação. Revista Brasileira de Zootecnia, v.33, n.5, p.1274-1284, 2004.
AGRICULTURAL RESEARCH COUNCIL - ARC. The nutrient requirements of ruminants livestock. London: Commonwealth Agricultural Bureaux, 1980. 351p.
BARBOSA, P.F. Raças e estratégias de cruzamento para produção de novilhos precoces. In: SIMPÓSIO DE PRODUÇÃO DE GADO DE CORTE, 1999, Viçosa, MG. Anais... Viçosa, MG: Suprema, 1999. p.1-19.
BELK, K.E.; TATUM, J.D.; WILLIAMS JUNIOR, F.L. Deposition and distribution of carcass fat for steers differing in frame size and muscle thickness. Journal of Animal Science, v.69, n.2, p.609-616, 1991.
BERG, R.T.; BUTTERFIELD, R.M. New concepts of cattle growth. Sydney: Sydney University Press, 1976. 240p. BUTTERFIELD, R.M., BERG, R.T. Relative growth patterns of
commercially important muscle groups of cattle. Research in Veterinary Science, v.7, p.389-393, 1966.
CAMFIELD, P.K.; BROWN, A.H.; LEWIS, P.K. et al. Effects of frame size and time-on-feed on carcass characteristics, sensory attributes, and fatty acid profiles of steers. Journal of Animal Science, v.75, p.1837-1844, 1997.
CERVIERI, R.C.; ARRIGONI, M.B.; CHARDULO, L.A.L. et al. Peso vivo final, ganho de peso, características de carcaça e concentrações plasmáticas de IGF-I e hormônios tireoideanos de bezerros mestiços Angus-Nelore recebendo somatotropina bovina recombinante (rbST) até a desmama.Revista Brasileira de Zootecnia, v.34, n.6, p.2009-2019, 2005.
COELHO DA SILVA, J.F.; LEÃO, M.I. Fundamentos de nutrição de ruminantes. Piracicaba: Livroceres, 1979. 380p. COSTA, E.C.; RESTLE, J.; BRONDANI, I.L. et al. Composição
física da carcaça, qualidade da carne e conteúdo de colesterol no músculo L o n g i s s i m u s d o r s i de novilhos Red Aangus
superprecoces, terminados em confinamento e abatidos em diferentes pesos. Revista Brasileira de Zootecnia, v.31, n.1, p.417-428, 2002. (supl.).
DRAPER, N.; SMITH, H. Applied regression analysis. New York: John Willey & Sons, 1966. 407p.
DUARTE, M.S.; PAULINO, P.V.R.; VALADARES FILHO, S.C. et al. Performance and meat quality traits of beef heifers fed with two levels of concentrate and ruminally undegradable protein.
Tropical Animal Health and Production, v.43, n.4, p.877-886, 2011.
EUCLIDES FILHO, K.; EUCLIDES, V.P.B.; FIGUEIREDO, G.R. et al. Efeito da suplementação com concentrado sobre idades de abate e características de carcaça de bovinos nelore.
Revista Brasileira de Zootecnia, v.26, n.6, p.1096-1102, 1 9 9 7 .
FAULCONNIE, Y.; BONNET, M.; BOCQUIER, F. et al. Effects of photoperiod and feeding level on adipose tissue and muscle lipoprotein lipase activity and mRNA level in dry non-pregnant sheep. British Journal of Nutrition, v.85, p.299-306, 2001. FEIJÓ, G.L.D.; EUCLIDES FILHO, K.; FIGUEIREDO, G.R. et al. Avaliação de carcaças de Nelore e F1’s europeu-Nelore a um grau de acabamento constante. In: REUNIÃO ANUAL SOCIEDADE BRASILEIRA DE ZOOTECNIA, 34, 1997, Juiz de Fora. Anais. Juiz de Fora: SBZ, 1997. p.133-135.
KOONG, L.J.; FERRELL, C.L.; NIENABER, J.A. Assessment of interrelationships among levels of intake and production, organ size and fasting heat production in growing animals. Journal of Nutrition, v.115, n.10, p.1383-1388, 1985.
LEFAUCHEUR, L. A second look into fibre typing – relation to meat quality. Meat Science, v.84, p.257-270, 2010. LUCHIARI FILHO, A. Pecuária da carne bovina. São Paulo:
LinBife, 2000. 134p.
MAY, S.G.; EDWARDS, J.W.; WILLIAMS, F.L. et al. Beef carcass composition of slaughter cattle differing in frame size, muscle score, and external fatness. J o u r n a l o f A n i m a l S c i e n c e,
v.70, n.8, p.2431-2445, 1992.
MARCONDES, M.I. Exigências nutricionais e predição da composição corporal de bovinos nelore puros e cruzados. 2010. 210f. Tese (Doutorado em Zootecnia) - Universidade Federal de Viçosa, Viçosa, MG.
MERTENS, D.R. Gravimetric determination of amylase-treated neutral detergent fiber in feeds using refluxing in beakers or crucibles: collaborative study. Journal of AOAC International, v.85, p.1217-1240, 2002.
MORALES, D.C.; CHARDULO, L.A.L.; SILVEIRA.A.C. et al. Características de qualidade de carne de bovinos de corte de diferentes tamanhos à maturidade submetidos ao sistema superprecoce. Acta Scientiarum, v.24, n.4, p.1-2, 2002. MULLER, L. Normas para avaliação de características de
carcaças e concurso de carcaças de novilhos. Santa Maria: Universidade Federal de Santa Maria, 1980. 31p.
NATIONAL RESEARCH COUNCIL - NRC. Nutrient requirements of beef cattle. 7.ed. Washington, D.C.: National Academic Press, 1996. 242p.
NATIONAL RESEARCH COUNCIL - NRC. Nutrient requeriments of dairy cattle. 7.rev.ed. Washinton, D.C.: 2001. 381p. OWENS, F.N.; DUBESKI, P.; HANSON, C.F. Factors that alter
the growth and development of ruminants. Journal of Animal Science, v.71, p.3138-3150, 1993.
PAULINO, P.V.R.; REIS, S.F.; MONNERAT, J.P.I.S. et al. Adequação dos sistemas de produção de bovinos de corte para atender as expectativas do setor produtivo e a indústria frigorífica na obtenção de carcaça de qualidade. In: CONGRESSO BRASILEIRO DE ZOOTECNIA - ZOOTEC, 20., 2010, Palmas.
Anais... Palmas: Universidade Federal do Tocantins, 2010. p.146-165.
RESENDE, F.D.; QUEIROZ, A.C.; OLIVEIRA, J.V. et al. Bovinos mestiços alimentados com diferentes proporções de volumoso:concentrado. 1. Digestibilidade aparente dos nutrientes, ganho de peso e conversão alimentar. Revista Brasileira de Zootecnia, v.30, n.1, p.261-269, 2001.
SAINZ, R.D.; BENTLEY, B.E. Visceral organ mass and cellularity in growth-restricted and refed beef steers. Journal of Animal Science, v.75, n.5, p.1229-1236, 1997.
SILVA, D.J.; QUEIROZ, A.C. Análises de alimentos (Métodos químicos e biológicos). 3.ed. Viçosa, MG: Editora UFV, 2002. 235p. SNIFFEN, C.J.; O’CONNOR, J.D.; VAN SOEST, P.J. et al. A net carbohydrate and protein system for evaluating cattle diets: II. Carbohydrate and protein availability. Journal of Animal Science, v.70, p.3562-3577, 1992.
STATISTICAL ANALYSIS SYSTEM – SAS. SAS/STAT User’s guide. v.8.0, v. I. Cary: SAS Institute, 2000. (CD-ROM). TAIT, J.R.; ; WILSON, D.E.; ROUSE, G.H. Prediction of retail
product and trimmable fat yields from the four primal cuts in beef cattle using ultrasound or carcass data. Journal of Animal Science, v.83, n.6, p.1353-1360, 2005.
VALADARES FILHO, S.C.; PAULINO, P.V.R.; MAGALHÃES, K.A.
Exigências nutricionais de zebuínos e tabelas de composição de alimentos – BR CORTE. Viçosa, MG: UFV, Suprema Gráfica Ltda., 2006. 142p.
VAZ, F.N.; RESTLE, J. Efeito de raça e heterose para características de carcaça de novilhos da primeira geração de cruzamento entre Charolês e Nelore. Revista Brasileira de Zootecnia, v.30, n.2, p.409-416, 2001.