E
ggplant is well regarded among the vegetables increasingly sought by consumers, whose demand for food with potential health promoting effects, such as disease prevention, is escalating. It is said that eggplant fruits associate good nutritional value (Ribeiro et al., 1998) and therapeutic properties (Reis et al., 2007). The rising consumption of eggplants, both in natura and as dry extract capsules, offers a positive scenario for the expansion of the crop. The area in Brazil occupied with eggplant crops ranges from 1,300 to 1,500 ha (Antonini et al., 2002; Reis et al., 2007). The largest cultivated areas are located in the States of São Paulo, Rio deassociation with cow urine. Horticultura Brasileira 27: 307-313.
Growth, nutrition and yield of eggplant as affected by doses of cattle
ma-nure and magnesium thermophosphate plus cow urine
Marinice O Cardoso1; Ademar P de Oliveira2; Walter E Pereira2; Adailson P de Souza2
1Embrapa Amazônia Ocidental, C. Postal 319, 69010-970 Manaus-AM; 2UFPB-CCA, 58397-000 Areia-PB; marinice.
cardoso@cpaa.embrapa.br; ademar@cca.ufpb.br; wep@cca.ufpb.br; adailson@cca.ufpb.br
Janeiro, and Paraná (Filgueira, 2003).
The use of adequate organic and mineral fertilization ranks among the most important requirements for eggplant production, and is especially necessary to meet the plant high nutritional demand mainly for nitrogen (N) and phosphorus (P), specially in low-fertility areas (Filgueira, 2003; Reis
et al., 2007). Nitrogen, as essential part of proteins and nucleic acids, as well as of the chlorophyll molecule (Taiz & Zeiger, 2004), is particularly important for plant growth and product final quality (Marschner, 1995). The absence of N in nutritive solution negatively affected stem and new leaves
ABSTRACT
The stem growth, nutrition, and fruit yield of eggplant grown
with different doses of cattle manure (CM)and magnesium
thermophosphate (MT) were studied, according to the Central Composite Matrix of Box (8.3-518; 8.3-3,018; 48.3-518; 48.3-3,018; 0.0-1,768; 56.6-1,768; 28.3-0.0; 28.3-3,536; 28.3-1,768). Potassium sulfate (KS) was also used (24 g plant-1), as well as a cow urine (COU)
solution (10 L 100 L-1 H
2O, 500 mL plant
-1), applied five times in
topdressing. Two additional treatments were used: MT without COU and triple superphosphate + urea (TS plus Ur), both with nutrient levels (CM, P2O5,and KS) corresponding to the combination 28.3-1,768. The experimental design was blocks at random, with three replications. CM doses improved plant height (PH) (29.1 t ha-1 of
CM; 69.84 cm) and stem diameter (37.8 t ha-1; 19.8 mm), fitting
into a quadratic model. However, due to the positive interaction between CM and MT, PH increased up to 86.87 cm when the same CM dose was combined with 3,536 kg ha-1 of MT. CM doses had also
a quadratic effect over number of fruits, fruit production per plant, average fruit weight (AFW), and yield, with respective maximum values corresponding to 53.4 t ha-1 (13 fruit), 55.8 t ha-1 (2,822 g
plant-1), 47.8 t ha-1 (210 g fruit-1), and 48.8 t ha-1 (34.3 t ha-1), without
significant effects of MT. N and P foliar contents did not change with treatments. CM doses increased K, Ca, and S, and decreased Mg foliar contents. But, concerning Ca, was observed negative interaction of MT. COU showed no effect over the characteristics analyzed. The effect of TS + Ur was larger than that of MT + COU on PH and production indexes, except for AFW, but did not differ from them as to macronutrient foliar contents.
Keywords: Solanum melongena,organic fertilization, alternative fertilization management, unconventional fertilization.
RESUMO
Crescimento, nutrição e produção de berinjela cultivada com esterco bovino e termofosfato magnesiano associados à urina de vaca
Objetivou-se estudar o crescimento do caule, a nutrição e a pro-dução da berinjela cultivada com diferentes doses de esterco bovino (EB) e termofosfato magnesiano (TM) conforme a matriz Composto Central de Box (8,3-518; 8,3-3.018; 48,3-518; 48,3-3.018; 0,0-1.768; 56,6-1.768; 28,3-0,0; 28,3-3.536; 28,3-1.768). Foi acrescentado sulfato de potássio (SK, 24 g planta-1) e foram realizadas cinco
aplicações de 500 mL planta-1 de uma solução de urina de vaca (UV,
10 L 100 L-1 H
2O). Adicionaram-se os tratamentos TM sem UV e
superfosfato triplo com uréia (ST com Ur), equivalendo em EB, P2O5 e SKà combinação 28,3-1.768. O delineamento experimental utilizado foi blocos casualizados, com três repetições. As doses de EB apresentaram efeito quadrático e proporcionaram a maior altura de planta (AP) e o maior diâmetro do caule, respectivamente, 29,1 t ha-1 de EB (69,84 cm) e 37,8 t ha-1 (19,8 mm). Porém, AP atingiu
86,87 cm quando essa dose de EB foi combinada com 3.536 kg ha-1 de
TM, devido à interação positiva. O número de frutos, a produção por planta, o peso médio de frutos (PMF) e a produtividade aumentaram quadraticamente com as doses de EB, sem efeito do TM, atingindo valores máximos com 53,4 t ha-1 (13 frutos), 55,8 t ha-1 (2.822g), 47,8
t ha-1 (210 g) e 48,8 t ha-1 (34,3 t ha-1), respectivamente. Os teores
foliares de N e P não variaram com os tratamentos. As doses de EB elevaram os teores foliares de K, Ca e S, com TM interagindo nega-tivamente para Ca, e diminuíram os teores de Mg. A UV não afetou nenhum dos parâmetros. O ST com Ur superou o TM com UV para AP e os índices produtivos, exceto o PMF, bem como não diferiram para os teores foliares dos macronutrientes.
Palavras-chave:Solanum melongena, adubação orgânica, manejo alternativo, fertilização não-convencional.
growth in eggplants (Haag & Homa, 1981). P deficiency may significantly reduce productivity, as it induces flower abscission (Ribeiro et al., 1998). This nutrient plays an important role on energy transfer in cells, respiration, and photosynthesis, besides being a structural component of nucleic acids, as well as of several coenzymes, phosphoproteins, and phospholipids (Grant et al., 2001).
Research showing the immediate and significant effects of industrialized fertilizers has been the norm for a long period and effectively contributed to discourage alternative soil management. Therefore, more information is needed on the growing of eggplants and other vegetable crops using alternative sources of nutrients, a useful knowledge to improve production systems in general. There is a reasonable amount of inputs that can be used. Organic fertilizers and low-solubility phosphates are non-conventional sources of respectively N and P, also used in organic production (FAO, 1999), a cropping system that increases significantly in Brazil, despite the institutional knowledge gaps.
Organic fertilization, although used for thousands of years in agricultural soils, has only recently been on the spot due to the conviction of its positive effects over physical, chemical, and biological soil properties. The high costs of soluble mineral fertilizers (Santos et al., 2001) and the remarkable potential growth of organic production worldwide have also contributed to this momentum. Among the organic fertilizers used in vegetable production, livestock manures stand out due to their positive effects on soil conditioning and nutrient availability, especially N (Almeida, 1991). The amount recommended for growing eggplants varies usually from 5 to 40 t ha-1 (Ribeiro et al., 1998;
Reis et al., 2007). When considering non-conventional phosphate sources, magnesium thermophosphate shows s i m i l a r p e r f o r m a n c e t o s o l u b l e phosphates (Novais & Smyth, 1999). However, due to the limited volume of research, magnesium thermophosphate is not widely accepted for growing vegetable crops. Cow urine is also used as a nitrogen source, and presents
significant levels of potassium and boron (Gadelha, 2001).
Consideringwhat was presented so far, the objective of this work was to study stem growth, nutrition, and fruit yield in eggplant grown with different doses of cattle manure and magnesium thermophosphate, associated with cow urine. In the long term, we intend to expand the knowledge on eggplant cultivation using alternative inputs.
MATERIAL AND METHODS
The experiment was carried out in the County of Areia, State of Paraíba, located in the microregion of Brejo Paraibano, in hot and humid weather (class As, according to Köppen), with fall-winter rains. During the experimental period (October 2003 to March 2004), the precipitation reached 138.1 mm in the first three months, while a much higher amount of rain (964.7 mm) fell from January to March 2004. The soil in the experimental area is a typical Quartz psamment, sandy loam texture, showing the following chemical characteristics: pH in water (1:2.5) = 5.7; organic matter (g dm-3) = 19.3; H+ + Al+3; Al+3; Na;
Ca+2; Mg+2 (mmolc dm-3) = 62; zero;
1.1; 27; 10; besides P and K (mg dm-3)
= 3.7 and 48.3, respectively. The weeds in the experimental area were mown and the vegetal residues were removed with a rake.
The experimental design was blocks at random, with three replications. The experimental plot was composed of four four-plant rows of cultivar Ciça, spaced at 1.0 x 0.80 m, covering 12.8 m2. Treatments consisted of different
doses of cattle manure (t ha-1) and
magnesium thermophosphate (kg ha-1),
respectively, following the Central Composite Matrix of Box: 8.3-518; 8.3-3,018; 48.3-518; 48.3-3,018; 0.0-1,768; 56.6-0.0-1,768; 28.3-0.0; 28.3-3,536; 28.3-1,768. Potassium sulphate was also used (24 g plant-1), as well as cow urine,
applied in side-dressing. The treatments magnesium thermophosphate without cow urine and triple superphosphate + urea were added, corresponding in cattle manure, P2O5, and K2SO4, to the combination 28.3-1,768, mean point
for doses. The cattle manure presented the following macronutrients in its composition (g kg-1: N = 10.3; P = 3.6;
K = 22.3; S = 6.7; Ca = 2.5, Mg = 108) and micronutrients (mg kg-1: B = 38.5;
Cu = 15.0; Fe = 8,964.0; Mn = 278.5; Zn = 64.3), besides Na (7,553.3 mg kg-1).
The cow urine presented N, P, K, Ca, Mg, S (3.0, 0.0016, 61.33, 0.02, 0.28, 0.49 g L-1, respectively), B, Cu, Fe,
Mn, and Zn (38.8, 0.07, 0.95, 0.12, and 0.17 mg L-1, respectively), and also Na
(1,031.3 mg L-1).
Organic and mineral fertilizers were incorporated into the furrows (0.25 m high) a week before transplanting the seedlings. The cow urine was applied (500 mL plant-1) as a solution (10 L 100
L-1 H
20), 15, 30, 45, 60, and 75 days after
transplant. For urea, each application consisted of 3.5 g plant-1, dissolved into
0.5 L H2O. Two sprout thinning beneath the first bifurcation, as well as hoeing and furrow up-earthing, using a hoe, were carried out. Deltametrin 2.5 E (6.0 mL 20.0 L-1 H
2O) was sprayed weekly to
control the populational disequilibrium of Diabrotica speciosa. Conventional sprinkling irrigation was used only at the beginning of the crop cycle, when precipitation was not sufficient.
(1990). The results of the analyses showed variation in the soil chemical attributes, and the maximum value (MV) for each characteristic was calculated with the doses of cattle manure (e) and magnesium thermophosphate (t) obtained by derivations from the respective regression equations (significant at 1% (**), 5% (*), and 10% () probability levels by the F test): pH, in CaCl2 (ŷ = 5.3572 + 0.041155**e + 0.0001804**t – 0.000365013**e2;
R2 = 0.94 and MV = 7.13); P (ŷ =
-26.6487 + 3.32641**e + 0.0685788**t – 0.0299866e2 – 0.0000127*t2;R2 =
0.91 and MV = 158.0 mg dm-3); K (ŷ =
88.466 + 5.3049**e; R2 = 0.99 and MV
= 388.72 mg dm-3); Ca (ŷ = 25.2732 +
0.53623**e + 0.0061999**t; R2 = 0.84
and MV = 77.54 mmolc dm
-3); Mg (ŷ =
13.385 + 0.17423**e + 0.0028809**t; R2 = 0.84 and VM = 33.44 mmol
c dm -3);
organic matter (non significant; general mean = 37.26 g dm-3).
In the statistical analysis, we used response curves when there was only one significant factor, and response surfaces when two factors or their interaction were significant. An isolated effect within the model was accepted as significant up to 10% probability (Alvarez, 1991). For the analysis of contrasts, we used the F test, which is decisive in the case of two means, and also the Bonferroni test, chosen due to the non-orthogonality.
RESULTS AND DISCUSSION
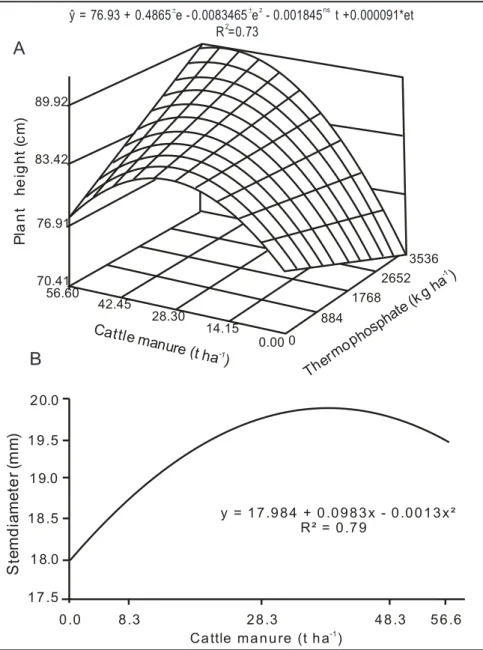
Stem growth and fruit yield - Plant height and stem diameter increased quadratically as function of cattle manure (CM) doses, with a positive interaction with magnesium thermophosphate (MT) (Figures 1A and 1B). MT probably lessened some deleterious effect from the highest amounts of CM, increasing plant height up to 89.82 cm. When considering the effect of CM alone, the largest plant height (69.84 cm) was obtained with 29.1 t ha-1, while stem
diameter reached the maximum value (19.8 mm) with 37.8 t ha-1. When the
same CM dose was combined with 3.536 kg ha-1 of MT, plant height
reached 86.87 cm due to the positive interaction between fertilizers. As CM is
the prime N source, in a way, the results observed followed those of Kamili et al. (2002), who reported an increase in plant height in eggplant with the increase of N. Results were similar to those reported by Haag & Homa (1981), who observed a significant decrease in eggplant stem thickness when N was absent. In addition, B and Zn also found in the CM, positively affect stem diameter (Ribeiro et al., 1998), being well known that the incorporation of
organic matter in the soil substantially improves plant growth and development (Kiehl, 1985).
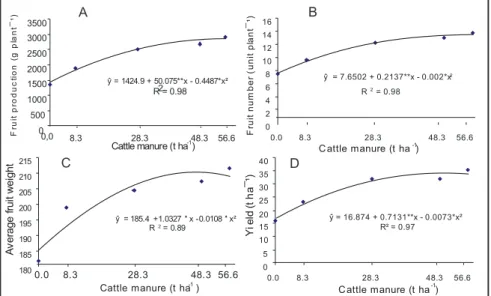
Fruit yield (Figure 2A) and number of fruits per plant (Figure 2B), average fruit weight (Figure 2C), and productivity (Figure 2D) increased quadratically exclusively as function of CM doses, reaching the maximum figures with 55.8 t ha-1 (2,822 g), 53.4 t ha-1 (13 fruits),
47.8 t ha-1 (210 g), and 48.8 t ha-1 (34.3
t ha-1), respectively. The drawback in
Figure 1. Plant height (A) and stem diameter (B) of eggplant as function of different doses of cattle manure and/or magnesium thermophosphate (altura de planta (A) e diâmetro do caule (B) de berinjela em função de diferentes doses de esterco bovino e/ou termofosfato magnesiano). */▲Significant at 5 and 10% probability and ns non-significant, F test. Areia,
UFPB, 2005.
A
B
89.92
ŷ = 76.93 + 0.4865 e - 0.0083465 e - 0.001845 t +0.000091*et R =0.73
z ns
2
83.42
76.91
70.41 56.60
42.45
28.30
14.15
0.00 0 884
1768 2652
3536
P
la
n
t
he
ig
h
t
(c
m
)
Cattle m
anure (t ha )-1
Ther moph
osph ate (k
g ha )
-1
2 0.0
1 9 .5
1 8 .5
1 7 .5
0 .0 8 .3 2 8 .3 4 8 .3 5 6 .6
Ca ttle ma n u re (t h a ) -1
Ste
m
di
a
m
e
te
r
(m
m
)
y = 1 7 .9 8 4 + 0 .0 9 8 3 x - 0 .0 0 1 3 x² R² = 0 .7 9
Figure 2. Fruit production (A) and fruit number (B) per plant, average fruit weight (C), and yield (D) of eggplant as function of different doses of cattle manure (produção (A) e número (B) de frutos, peso médio de fruto (C) e produtividade (D) de berinjela em função de difer-entes doses de esterco bovino). **/*/▲Significant at 1, 5, and 10% probability, respectively, F test. Areia, UFPB, 2005.
fruit production due to excessively high CM doses was probably caused by the increase of soluble salts in the soil, which negatively interfered with fruit number and weight. Even average amounts of CM may lead to increments of soluble salts and electric conductivity in the substrate (Rodrigues & Casali, 1998; Cavalcante et al., 2007), which results in negative effects on plant development and production. The largest number of fruits per plant was smaller than that found by Antonini
et al. (2002) for the same cultivar (23 fruits), using conventional fertilization in a lower plant density. As to the average fruit weight, the maximum value was within the interval 200 - 250 g, reported by Ribeiro et al. (1998) for
A B
C D
Table 1. Treatment means and contrast estimates (ŷ) for magnesium thermophosphate with and without cow urine and triple superphosphate
+ urea versus magnesium thermophosphate + cow urine for leaf contents of macronutrients in eggplant (médias de tratamentos e estimativa (ŷ) dos contrastes para termofosfato magnesiano sem e com urina de vaca e superfosfato triplo com uréia versus termofosfato magnesiano com urina de vaca para os teores foliares de macronutrientes em berinjela). Areia, UFPB, 2005.
Characteristics
Means Y
MT1 plus
COU2
MT1 without
COU2 TS
3 + Ur4 MT without COU x
MT plus COU
TS + Ur4 x MT +
COU
Plant height (cm) 85.83 85.0 84.50 -0.83ns -1.33*
Stem diameter (mm) 19.83 18.42 18.92 -1.41ns -0.91ns
Number of fruits per plant 12.25 11.94 15.84 -0.31ns 3.59**
Yield (g plant-1) 2544.79 2462.77 3353.23 -82.02ns 808.44**
Average fruit weight (g) 207.61 206.23 211.85 -1.38ns 4.24ns
Defective fruits (%) 3.92 6.13 3.51 2.21ns -0.41ns
Yield (t ha-1) 30.66 29.21 40.70 -1.45ns 10.04**
Means followed by **/*differ significantly from each other, F test, respectively p<0.01 and p<0.05; nsnon-significant; 1/MT = magnesium
thermophosphate; 2/COU = cow urine; 3/TS = triple superphosphate; 4/Ur = urea.
Table 2. Treatment means and contrast estimates (ŷ) for magnesium thermophosphate with and without cow urine and triple superphosphate
+ urea versus magnesium thermophosphate + cow urine for leaf contents of macronutrients in eggplant (médias de tratamentos e estimativa (ŷ) dos contrastes termofosfato magnesiano sem e com urina de vaca e superfosfato triplo com uréia versus termofosfato magnesiano com urina de vaca para os teores foliares de macronutrientes em berinjela). Areia, UFPB, 2005.
Macronutrients
Means Ŷ
MT1 with
COU2
MT1 without
COU2 TS
3 + Ur4 MT without COU x
MT with COU
TS with Ur + MT with COU
g kg-1
Nitrogen 51.34 41.42 49.99 -9.92ns -1.35ns
Phosphorus 5.54 5.79 6.53 0.25ns 0.99ns
Potassium 35.16 35.71 34.79 0.55ns -0.37ns
Calcium 14.19 17.29 14.60 3.10ns 0.41ns
Magnesium 7.00 7.69 6.93 0.69ns -0.07ns
Sulphur 4.48 5.29 4.12 0.81ns -0.36ns
ns= Non-significant, F test; 1/MT = magnesium thermophosphate; 2/COU = cow urine; 3/TS = triple superphosphate; 4/Ur =
urea.
ŷ = 1424.9 + 50.075**x - 0.4487*x² R2= 0.98
0 500 1000 1500 2000 2500 3000 3500
0,0 8.3 28.3 48.3 56.6
Cattle manure (t ha )-1
F
ru
it
p
ro
d
u
c
ti
o
n
(
g
p
la
n
t
)
¯
¹
ŷ = 7.6502 + 0.2137**x - 0.002*x2
R2 = 0.98
0 2 4 6 8 10 12 14 16
0.0 8.3 28.3 48.3 56.6
C attle manure (t ha )-1
F
ru
it
n
u
m
b
e
r
(u
n
it
p
la
n
t¯
¹)
0.0 8.3 28.3 48.3 56.6
Cattle manure (t ha )-1
A
v
e
ra
g
e
f
ru
it
w
e
ig
h
t
180 185 190 195 200 205 210 215
ŷ = 185.4 1.0327+ ▲x - 0.0108▲x² R2 = 0.89
ŷ = 16.874 + 0.7131**x - 0.0073*x² R² = 0.97
0 5 10 15 20 25 30 35 40
Yi
e
ld
(
t
h
a
¯
¹)
0.0 8.3 28.3 48.3 56.6
the same cultivar. Despite the positive interaction between CM and TM on plant height (Figure 1A), the expectancies of observing a similar effect over number of fruits per plant were not confirmed. This suggests a considerable influence of lateral branching over this characteristic, in which the effect of CM is more likely to be effective due to the N content. The highest observed yield exceeded the national average (25 t ha-1) (Ribeiro et al. 1998), as well
as the figures reported by Castro et al. (2004), who worked with the hybrid F-100 in an organic system, with green manure (1.4 m x 0.7 m spacing): 21.5 and 20.5 t ha-1 in monoculture and
intercropping, respectively. The low percentage of non-commercial fruits, with an average of only 4.8% in the experiment, was decisive to reach such a good crop yield.
The absence of a general response to MT, which only enhanced CM effect on plant height, was not due to lack of solubility, once MT is among the most soluble phosphate sources (Novais & Smyth, 1999). This was evidenced by the chemical soil analysis of the experimental plots, previously mentioned. However, plant response to P is favored by an abundant N supply (Yamada, 2002). Therefore, it is likely that N amounts, available only out of an organic source, were not enough to promote P effects. In addition, P is precipitated by Ca under higher soil pH and becomes unavailable to plants (Novais & Smyth, 1999). In the present study, both nutrients were simultaneously supplied by MT. Among others, these factors certainly contributed, alone or together, to the lack of a general response to MT.
The contrast between MT without COU and MT + COU was not significant for any of the characteristics studied (Table 1). Leaching of urine nutrients, especially N-NO3,probably occurred. In addition, some minor components of the urine, such as the hippuric acid, may have altered N microbial transformations, promoting an increase in NH3 volatilization in the soil (Shand
et al., 2002). Moreover, K addition by the urine, a highly demanded nutrient for fruit yield in eggplant, was probably
ŷ = 32.855 + 0.0492**x R2 = 0.74
3 2 .0 3 2 .5 3 3 .0 3 3 .5 3 4 .0 3 4 .5 3 5 .0 3 5 .5 3 6 .0 3 6 .5
0.0 8.3 28.3 48.3 56.6
C attle m anure (t ha )-1
P
o
ta
s
si
u
m
(g
k
g
)
¯¹
0.00 1 4.15
28 .3 0 17.11
15 .8 2
1 4.54
1 3.26
0 88 4 17 68 26 52 3 53 6 5 6.60 42 .4 5
C
a
lc
iu
m
(g
k
g¯
¹)
Cattle m an
ure (t ha
)
- 1 Thermop h
os phate ( k g ha
)
- 1
ŷ = 7 .5 9 8 8 - 0 .11 6 9 5▲
xR2 = 0 .6 5
6 .6 8 .0
7 .8
7 .6
7 .4
7 .2
7 .0
6 .8
0 . 0 8 . 3 2 8 . 3 4 8 . 3 5 6 . 6
C a ttl e m a n u r e ( t h a )- 1
M
ag
n
e
si
u
m
(g
kg
)
¯¹
ŷ = 4 .3 8 8 1 + 0 .0 1 3 x▲
R 2 = 0 .7 0
3 4 5 6
0 . 0 8 . 3 2 8 . 3 4 8 . 3 5 6 . 6
C a ttl e m a n u r e ( t h a )- 1
S
u
lp
h
u
r (
g
kg
)
¯¹
ŷ = 13.26 + 0.0106▲√e + 0.04701▲e + 0.0647ns√t - 0.01408√e √t
R2=0.60
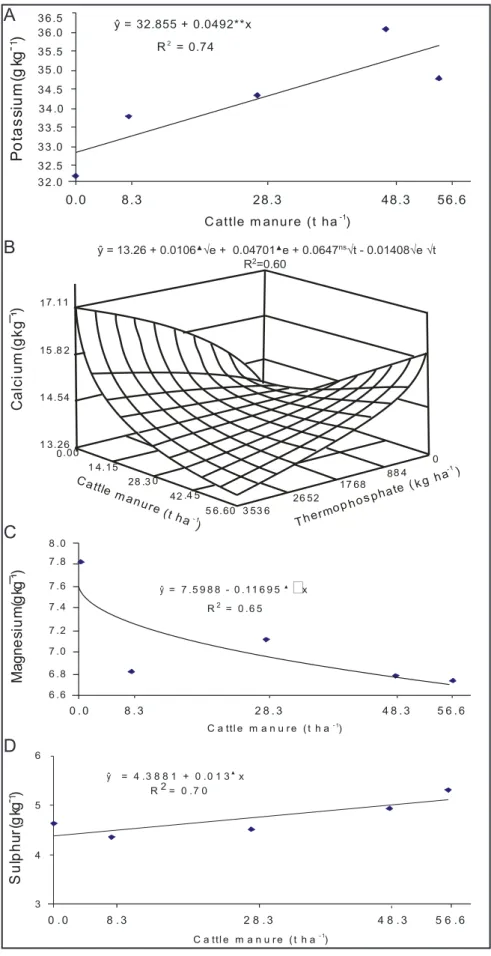
Figure 3. Leaf contents of potassium (A), calcium (B), magnesium (C), and sulphur (D) in eggplant as function of different doses of cattle manure and/or magnesium thermophosphate (teores de potássio (A), cálcio (B), magnésio (C) e enxofre (D) na folha de berinjela em função de diferentes doses de esterco bovino e/ou termofosfato magnesiano). **/▲Significant at 1 and 10% probability and ns non-significant, F test. Areia, UFPB, 2005.
A
B
C
minimized by K supply through CM and potassium sulfate.
When comparing the treatment Triple Superphosphate + Urea to the treatment MT + COU (Table 1), the first showed the best results for number of fruits per plant (3.59 fruits plant-1), plant
production (808.44 g plant-1), and yield
(10.04 t ha-1), and poorer results for plant
height (-1.33 cm). Taller plants produce more fruits (Amaral Junior et al., 1997). However, this was not observed in the present study, probably because of the small differences among treatments.
Leaf macronutrients - There was no significant effect of doses of cattle manure (CM) (10.3 g kg-1 N) and
magnesium thermophosphate (MT) (16% P2O5 soluble in citric acid) in the
leaf contents of N and P, whose general average values were 49.8 and 4.97 g kg-1,respectively. On the lower manure
doses, N concentration in the manure may probably have compensated for the N leaf contents observed when higher manure doses were used, resulting in the lack of significance in the analysis of regression. Nevertheless, under lower manure doses, visible plant growth impairment, as well as chlorophyll loss in older leaves, was observed, which indicates N deficiency, according to Raij (1991). The lack of response of P contents in the leaves to the MT doses was probably due to the non-proportionality between P availability and MT doses, which might have been caused by P fixation in the soil (Novais & Smyth, 1999; Grant et al., 2001). According to Yamada (2002), N promotes an increase in P absorption. However, there was no interaction between MT and manure. The nitrogen amounts slowly released by the manure were probably insufficient to trigger a response. The lack of an isolated effect of manure (3.6 g kg-1 P), an organic
fertilizer responsible for improving vegetal growth, was probably due to an increase in P demand by other plant organs, leading to little variation in leaf contents.
An increase in K contents in leaves was observed only when cattle manure was used (Figure 3A), confirming that organic fertilizers may release high levels of this nutrient shortly after their
incorporation in the soil (Rodrigues & Casali, 1998). The basic doses of potassium sulphate and cow urine, which also added K, led to a steep linear increment (0.0492) in K for each manure unit applied, resulting in 35.6 g kg-1 K for the highest dose applied
(56.6 t ha-1). Manure doses may also
have promoted root growth and water retention (Kiehl, 1985) of the sandy soil in the experimental area, increasing the uptake of K, which moves by diffusion. However, as there was a decrease in yield from 55.8 t ha-1 of manure ahead,
we inferred that the increasing linear response shows a luxury nutrient consumption.
Ca contents in leaves increased with increasing manure doses, reaching 16.0 g kg-1 and adjusting to a square root
model. Ca levels started to decrease with increasing doses of MT, due to the negative interaction (Figure 3B). The highest Ca content in leaves (14.3 g kg-1) was found at 21.1 t ha-1 of
manure and 988.3 kg ha-1 of MT. Ca
plays an important role in avoiding the fruit blossom-end rot, although the disorder can also be observed in plants showing high Ca leaf concentrations. This happens due to the low mobility of Ca in the phloem: Ca reaches the fruits mainly via xylem, by means of the transpiration stream (Mengel & Kirkby, 1987; Marschner, 1995). As plants in general did not show any deficiency symptoms and the blossom-end rot was not a problem in this experiment, we concluded that the soil Ca content (average initial level of 27.0 mmolc dm-3) was not limiting. The
negative interaction between manure and TM, regarding Ca contents might have happened due to a simultaneous reduction in manure mineralization (Siqueira & Franco, 1988) and increase in the soil mechanisms of Ca retention (Novais & Smith, 1999), as function of the linear increase in the soil pH up to alkaline values observed with the rising thermophosphate doses.
Leaf contents of Mg responded to manure doses according to a decreasing square root model and reached the lowest level (6.72 g kg-1) when the highest
manure dose was applied (Figure 3C). The high Mg content in leaves, in general
within the optimum range mentioned by Marschner (1995), confirmed the high amount of Mg in the soil (10 mmolc dm3)
and its reasonable amount in the cattle manure (10.8 g kg-1). Nevertheless, as it
was observed, with higher amounts of organic fertilizer, the high K supply may have decreased the Mg absorption and physiological availability. Moreover, a simultaneous dilution effect is also acceptable. The absence of a general response of leaf contents of Mg to MT, an Mg source (7%), was probably due to the antagonistic effect of the increase in Ca availability (Mengel & Kirkby, 1987), once Ca is also supplied by MT (20%).
There was a linear increase in S leaf contents with the cattle manure doses. The highest S content (5.12 g kg-1) was
reached when the highest manure dose was applied (Figure 3D). An increase in the initial constant was noticed (4.3881), probably because potassium sulfate was employed in the experiment onset. Despite showing low demand for S (Haag & Homa, 1981), eggplant roots do not have an efficient mechanism to avoid S excessive uptake. However, the linear response confirms the increase in S uptake due to the rising manure doses.
Although the leaf contents of these macronutrients, except for K and Ca, were within the range recommended by Malavolta (1987) for eggplant (N: 48.2; P: 3.6; K: 40.9; Ca: 22.7; Mg: 0.7; and S: 0.0 g kg-1), no comparisons were carried
out, once results were obtained for plants under conventional fertilization. According to Raij (1991), leaf analysis is more efficient to diagnose low nutrient levels, i.e., severe deficiency. Magalhães (1988) mentions the macronutrient contents below which severe deficiency can be observed in vegetables (N, P and K, Ca, Mg and S = 15.0; 2.0; 15.0; 8.0; 2.0; and 2.0 g kg-1, respectively).
These figures were taken as reference in the present work due to the lack of research on the subject. Our results showed nutrient contents high above the reference figures, evidencing that plants were not under severe limitation.
for any of the macronutrients (Table 2), showing that cow urine did not significantly altere the macronutrient leaf contents. When considering particularly N and K, found in greater amounts in cow urine, it is possible that the high precipitation during the long period of the experiment (138.1 and 964.7 mm respectively in the first and in the last three months), has minimized the cow urine effect due to leaching losses, which were enhanced by the liquid nature of the urine. The contrast between triple superphosphate + urea and MT + COU was also non-significant for macronutrient leaf contents (Table 2). This probably happened because nutrient contents in plant organs are not always proportional to the amount taken up, once the effects of concentration and dilution, according to Taiz & Zeiger (2004), may take place for nutrients mobile in the soil, especially for N, due to the balance between source and sink.
In conclusion, stem growth and both the nutritional and production indexes in eggplant were more affected by the cattle manure than by the magnesium thermophosphate, once the latter influenced significantly simply plant height and Ca content in leaves, and even though, only when in interaction with the manure. In general, leaf contents of macronutrients did not point to a severe limitation to plants. Cow urine did not affect any of the characteristics studied, while the triple superphosphate + urea promoted better results than the magnesium thermophosphate + cow urine for plant height and production indexes, except for average fruit weight. There were no significant differences among these treatments regarding leaf contents of macronutrients. The good eggplant production indexes observed under these experimental conditions when only cattle manure was used confirmed the eggplant ability to use the nutrients available in the manure. It should be also mentioned that once cattle manure is not the animal manure presenting the highest nutrient concentration, its well-known effects as a soil conditioning agent certainly also contributed to the production of a
reasonable sum of commercial fruits. In spite of our results, more studies are needed to broaden the eggplant fertilization management using the alternative fertilizers tested in this work, definitely including studies in different soil conditions.
REFERENCES
ALMEIDA DL. 1991. Contribuição da adubação orgânica para a fertilidade do solo. Seropédica: UFRRJ. 192p. (Tese doutorado).
ALVAREZ VVH. 1991. Avaliação da fertilidade do solo: superfície de resposta - modelos aproximativos para expressas a relação fato - resposta. Viçosa: UFV. 75p.
AMARAL JUNIOR AT; CASALI VWD; CRUZ CD; FINGER FL. 1997. Correlações simples e canônicas entre caracteres morfológicos, agronômicos e de qualidade em frutos de tomateiro. Horticultura Brasileira 15: 49-52. ANTONINI ACC; ROBLES WGR; TESSARIOLI
NETO J; KLUGE RA. 2002. Capacidade produtiva de cultivares de berinjela.
Horticultura Brasileira 20: 646-648. CAVALCANTE LF; RODOLFO JUNIOR F; SÁ
JR; CURVELO CRS; MESQUITA EF. 2007. Influência de água salina e matéria orgânica no desempenho do maracujazeiro-amarelo e na salinidade do substrato. Irriga 12: 505-518. CASTRO CM; ALVES BJR; ALMEIDA DL;
RIBEIRO RLD. 2004. Adubação verde como fonte de nitrogênio para a cultura da berinjela em sistema orgânico. Pesquisa Agropecuária Brasileira 39: 779-785.
FAO. CODEX ALIMENTARIUS COMISSION. 1999. Guidelines for the production, processing, labeling and marketing of organically produced foods. Rome: FAO/WHO. 43 p.
FERREIRA ME; CRUZ MCP; FERREIRA JUNIOR ME. 1990. Avaliação da fertilidade empregando o sistema IAC de análise de solo. Jaboticabal: FCAV/UNESP. 94 p.
F I L G U E I R A FA R . 2 0 0 3 . S o l a n á c e a s : agrotecnologia moderna na produção de tomate, batata, pimentão, pimenta, berinjela e jiló. Lavras: UFLA. 333 p.
GADELHA RSS. 2001. Urina de vaca na produção de alimentos. Agroecologia 2: 25-26. GRANT CA; FLATEN DN; TOMASIEWICZ
DJ; SHEPPARD SC. 2001. A importância do fósforo no desenvolvimento inicial da planta. Piracicaba: Potafos. 5 p. (Potafos. Informações Agronômicas 95).
HAAG HP; HOMA P. 1981. Nutrição mineral de hortaliças: deficiências de macronutrientes em berinjela. In: HAAG HP; MINAMI K.
Nutrição mineral em hortaliças. Campinas: Fundação Cargill. p. 419-431.
KAMILI IA; ZARGAR MY; CHATTOO MA. 2002. Effect of microbial inoculants, chemical nitrogen and their combination on brinjal (Solanum melongena L.). Vegetable Science
29: 87-89.
KIEHL EJ. 1985. Fertilizantes orgânicos. Piracicaba: Ceres. 492 p.
MAGALHÃES JR. 1988. Diagnose de desordens nutricionais em hortaliças. Brasília: Embrapa-CNPH. 64p. (Embrapa-Embrapa-CNPH. Documentos 1).
MALAVOLTA E. 1987. Manual de calagem e adubação das principais culturas. São Paulo: Agronômica Ceres. 496 p.
MARSCHNER H. 1995. Mineral nutrition of higher plants. 2. ed. London: Academic Press. 889 p.
MENGEL K; KIRKBY EA. 1987. Principles of plant nutrition. 4. ed. Bern: International Potash Institute. 687 p.
NOVAIS RF; SMYTH TJ. 1999. Fósforo em solo e planta em condições tropicais. Viçosa: UFV-DPS. 399 p.
RAIJ B. 1991. Fertilidade do solo e adubação. Piracicaba: Ceres-Potafos. 343 p.
REIS A; LOPES CA; MORETTI CL; RIBEIRO CSC; CARVALHO CMM; FRANÇA FH; VILLAS BÔAS GL; HENZ GP; SILVA HR; BIANCHETTI LB; VILELA NJ; MAKISHIMA N; FREITAS RA; SOUZA RB; CARVALHO SIC; BRUNE S; MAROUELLI WA; NASCIMENTO WM; PEREIRA W; MELO WF. 2007. Berinjela (Solanum melongena). Brasília: Embrapa Hortaliças. n.p. (Embrapa Hortaliças. Sistemas de Produção 3). Disponível em: http://www.cnph.embrapa.br Acessado em 21 de dezembro de 2007. RIBEIRO CSC; BRUNE S; REIFCHNEIDER
FJB. 1998. Cultivo da berinjela. Brasília: Embrapa Hortaliças. 23 p. (Embrapa Hortaliças. Instrução Técnica 15).
RODRIGUES ET; CASALI VWD. 1998. Resposta da alface à adubação orgânica. II. Teores, conteúdos e utilização de macronutrientes em cultivares. Revista Ceres 45: 437-449. SANTOS RHS; SILVA F; CASALI VWD;
CONDÉ AR. 2001. Conservação pós-colheita de alface cultivada com composto orgânico.
Pesquisa Agropecuária Brasileira 36: 521-525.
SHAND CA; WILLIAMS BL; DAWSON LA; SMITH S; YOUNG ME. 2002. Sheep urine affects soil solution nutrient composition and roots: differences between field and sward box soils and the effects of synthetic and natural sheep urine. Soil Biology & Biochemistry 34: 163-171.
SIQUEIRA JO; FRANCO AA. 1988. Biotecnologia do solo: fundamentos e perspectivas. Brasília: MEC, ABEAS; Lavras: ESAL, FAEPE. 236p.
TAIZ L; ZEIGER E. 2004. Fisiologia vegetal. 3.ed. Porto Alegre: Artmed. 719 p.
TEDESCO MJ; GIANELLO C; BISSANI CA; BOHNEN; VOLKWEISS SJ. 1995. Análise de solo, plantas e outros materiais. Porto Alegre: UFRGS. 174 p. (UFRGS. Boletim Técnico 5).
YAMADA T. 2002. Melhoria na eficiência da