UNIVERSIDADE DO ALGARVE
Assemblage structure and secondary production of
mesozooplankton in shallow water volcanic CO
2vents of
the Azores
Ana Navarro Campoy
Dissertação para obtenção do grau de:
Mestrado em Biologia Marinha
Trabalho efetuado sob a orientação de:
Maria Alexandra Teodósio
Pedro Range
I
Assemblage structure and secondary production of
mesozooplankton in shallow water volcanic CO
2vents of
the Azores
Declaração de autoria de trabalho
Declaro ser a autora deste trabalho, que é original e inédito. Autores e trabalhos consultados estão devidamente citados no texto e constam da listagem de referências incluída.
Copyright Ana Navarro Campoy
A Universidade do Algarve tem o direito, perpétuo e sem limites geográficos, de arquivar e publicitar este trabalho através de exemplares impressos reproduzidos em papel ou de forma digital, ou por qualquer outro meio conhecido ou que venha a ser inventado, de o divulgar através de repositórios científicos e de admitir a sua cópia e distribuição com objetivos educacionais ou de investigação, não comerciais, desde que seja dado crédito ao autor e editor.
Date:
II
Acknowledgements
I would like to thank you for your participation and support in this work to:
Pedro Range and Alexandra Teodósio for making me part of the MOFETA project and conduct my thesis. They showed be very good professionals, I learnt a lot with them in all the different steps of my thesis and they were always available to give me their support at all levels.
Joana Cruz, because she was another supervisor for me and a fundamental part in this part of the project.
All participants in the MOFETA project, because they formed a great work team, all people from different areas worked hard to reach common objectives and we shared good times during the process.
My friends, because they always had a word of affection or support, and my family, because they are the real responsible for me to be here.
This work was supported by the projects MOFETA (EXPL/MAR-EST/0604/2013), funded by the Portuguese Foundation for Science and Technology (FCT) and OceanA-Lab, supported by the Regional Government of the Azores (DRCT M.2.1.2/I/021/2011). The authors also acknowledge the logistical support provided by “Bombeiros Voluntários de Vila Franca do Campo” and the boats crews of “Toninha Pintada“ and “Cachalote I” (Ponta Delgada); “Pintado” and “Águas Vivas” (Horta).
III
Abstract
Atmospheric CO2 concentrations have increased by at least 30% since pre-industrial times
due to human activities. Part of this CO2 has been absorbed by oceans, inducing ocean
acidification and, therefore, several impacts in the marine biota. Natural shallow-water CO2
vents have generated a substantial interest in recent years as in situ laboratories for ocean acidification studies. The present study was focused on the effects of ocean acidification on mesozooplankton communities. Two active volcanic areas with submarine CO2 emissions, in
the islands of São Miguel and Faial, were chosen and independently studied, through the choice of three different sites: Reference, Intermediate and Vent, characterized for their increase in the CO2 degassing activity, and consequent pH decrease. Differences in the
abundance, diversity and structure of mesozooplankton among sites were described, along with the characterization of the community in these areas, since previous information is scarce. Differences were found in the composition of the zooplanktonic assemblages among sites in São Miguel and among dates in Faial. Through the nMDS analyses, Radiozoa,
Paracalanus parvus and Evadne spinifera appeared more related to vent conditions, while
Cirripedia nauplii were closer to the reference conditions. Conditions in Faial did not allow a clear separation among sites in the nMDS analyses, since the strong currents mix the water, dissipating the effect of the gas emissions, and variation among days becomes more important and statistically significant. The RNA:DNA ratio of selected mesozooplankton populations was used, as proxies for physiological condition. RNA:DNA did not show a clear pattern of variation, copepods in São Miguel and cladocerans in Faial had an higher ratio in the reference sites, but with no gradual decrease to the Vent. Fish eggs seem to have an inverted pattern. Additional experiments conducted under natural conditions were performed to determine the egg production rate (EPR) of the dominant free-spawning copepod species, as a proxy for secondary production. In São Miguel, the EPR showed a decreasing trend along the CO2 gradient, with no differences between the exposure times. In Faial, EPR was higher in
the reference, but it did not differ significantly from the other sites. This study demonstrated the suitability of the submarine degassing sites in S. Miguel and Faial Islands for investigating the effect of future dissolved CO2 levels in planktonic and pelagic communities of the NE
Atlantic. It also provided the first in-situ evidence of a significant decrease of EPR of copepods under near future CO2 levels.
Key words: ocean acidification, mesozooplankton, shallow-water CO2 vents, copepods, egg
IV
Resumo
Desde os tempos pre-industriais que se registou um incremento do CO2 atmosférico, de pelo
menos 30% devido a atividades humanas, principalmente pelo uso de combustíveis fósseis. Os oceanos têm absorvido parte deste CO2 através da sua capacidade de “sumidouro de
carbono”, induzindo mudanças na composição química da água do mar (acidificação do oceano), com potenciais impactos nos organismos marinhos. As possíveis consequências ecológicas deste processo têm motivado um incremento no esforço de investigação nos últimos anos. A maioria dos efeitos nos organismos marinhos tem sido observada em experiências no laboratório, onde o CO2 é manipulado em escalas temporais curtas. Não
obstante, a necessidade de usar diferentes abordagens, como experiências de campo, em ambientes marinhos específicos que contenham comunidades, mais do que espécies isoladas, tornou-se evidente. Locais de desgaseificação natural de CO2 em águas pouco profundas têm
gerado um interesse substancial como laboratórios in situ para estudos de acidificação do oceano. Alterações significativas na estrutura da comunidade bentónica têm sido associadas com estes locais de desgaseificação, mas os efeitos no plâncton permanecem largamente desconhecidos. O presente estudo analisou os efeitos da acidificação do oceano nas comunidades de mesozooplâncton. Os objetivos especificos foram (i): o estudo observacional sobre as comunidades zooplanctónicas, para determinar se existem diferenças consistentes na abundância, diversidade e composição entre os locais afetados por emissões de CO2 e os
locais de controlo, sem emissões; e (ii) a relação entre os padrões observados no zooplâncton em relação aos resultados detetados na química da água do mar e do gás das emissões, (iii) a descrição do estado ecofisiológico de grandes grupos de zooplâncton utilizando índices derivados dos ácidos nucleicos e índices de produção de ovos e a sua relação com o possível stress causado pela acidificação. Para atingir estes objetivos foram seleccionadas duas áreas vulcânicas activas, com emanações de CO2 submarinas, uma na ilha de São Miguel e outra na
ilha de Faial, no arquipélago dos Açores. Cada ilha foi independentemente estudada, através da escolha de três lugares diferentes: Reference, Intermediate e Vent, ao longo de um gradiente na emissão de CO2, e consequente diminuição de pH. O pH em São Miguel variou
de 8.06 no Reference (pCO2 383.80 µatm) a 7.75 no Vent (pCO2 983.10 µatm), enquanto que
no Faial diminuiu de 8.13 no Reference (pCO2 319.37 µatm) a 7.88 no Vent (pCO2 894.08
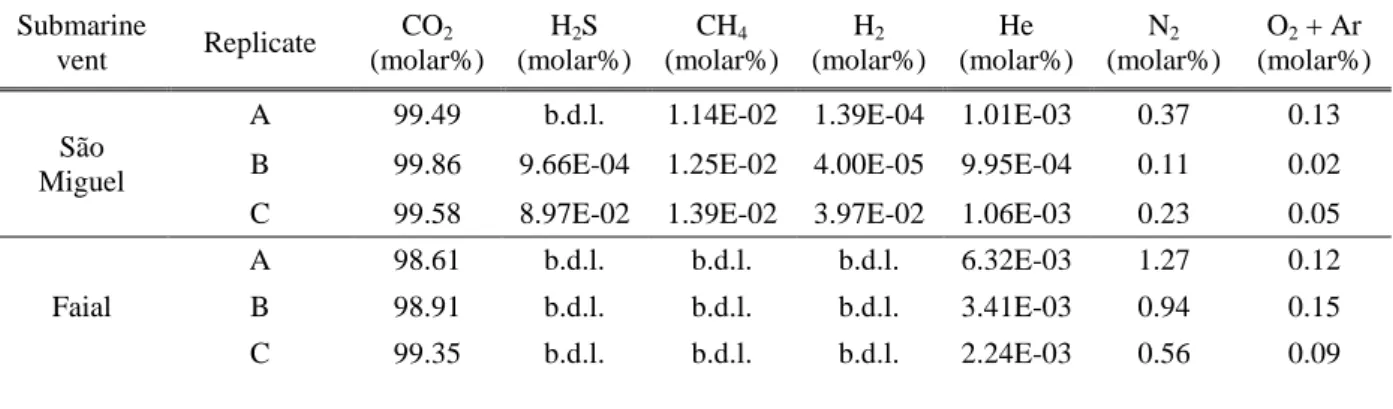
µatm). O CO2 foi o principal constituinte das emissões de gás nas duas ilhas (acima de 98%),
minimizando o efeito de outros gases como H2S. Em São Miguel o mesozooplâncton foi
V
entre os dias 3 e 7 de Julho de 2014, enquanto que no Faial foi usada uma rede com malhagem de 500µm e a amostragem foi feita entre os dias 10 e 15 de Julho de 2014. Foram descritas as diferenças na abundância, diversidade e estrutura do mesozooplâncton entre locais, em paralelo com a caracterização das comunidades nestas áreas, já que a informação prévia era escassa. Foram identificados organismos de nove filos, num total de 71 taxa diferentes, 45 em S. Miguel e 61 no Faial. Em São Miguel foram encontradas diferenças entre locais na abundância total e nas abundâncias de Arthropoda e Chordata, com um incremento no Vent, relativamente ao Intermediate e o Reference. No Faial foram apenas encontradas diferenças na diversidade dos Arthropoda. A análise PERMANOVA ilustrou as diferenças na composição do zooplâncton entre locais, em São Miguel, e entre datas, no Faial. Os principais contribuintes para estas diferenças, realçados pelas anaáises SIMPER, foram
Evadne spinifera, Paracalanus parvus, nauplios de Cirripedia e Radiozoa. Através das
análises nMDS, Radiozoa, Paracalanus parvus e Evadne spinifera apareceram mais relacionados às condições do Vent, enquanto que nauplios de Cirripedia estiveram mais perto das condições do Reference. No Faial, os principais contribuintes foram Bassia bassensis, Radiozoa e efiras de Scyphozoa. As condições nesta ilha não permitiram uma separação entre locais nas análises nMDS, dado que as fortes correntes misturaram a coluna de àgua, dissipando o efeito das emissões de gases, e a variação entre dias é aparentemente mais importante e estatisticamente significativa.
O racio RNA:DNA de populações de mesozooplâncton seleccionadas foi usado como indicador da condição fisiológica. O RNA:DNA não mostrou um padrão claro de variação: Copepoda em São Miguel e Cladocera no Faial apresentaram valores mais elevados no
Reference, mas este não diminuiu de forma gradual ao longo do gradiente de CO2. Os ovos de
peixe parecem ter um padrão invertido. Experiências adicionais foram levados a cabo para determinar a taxa de produção de ovos (EPR) das espécies dominantes de copépodes, como indicador da produção secundária. As câmaras de incubação foram colocadas perto do fundo durante períodos de 24 e 72h em São Miguel, e 72h no Faial. Em São Miguel, a EPR mostrou uma tendência de diminuição ao longo do gradiente de CO2, sem diferenças nos tempos de
exposição. No Faial, EPR foi maior no Reference, mas não diferiu significativamente dos outros locais.
Este estudo demonstrou o potencial das zonas de desgaseificação submarina nas ilhas de S. Miguel e Faial para a investigação dos efeitos dos níveis futuros de CO2 dissolvido nas
VI
comunidades planctónicas e pelágicas do Atlântico NE. Este trabalho também permitiu registar a primeira evidência in-situ de uma diminuição significativa da produção secundária em copépodes sob concentrações de CO2 previstas para o final do século.
Palavras-chave: acidificação do oceano, mesozooplâncton, locais de desgaseificação natural
VII
List of figures
Figure 1.1. Total annual anthropogenic greenhouse gas emissions (gigatonne of CO2
-equivalent per year) for the period 1970 to 2010 by gases: CO2 from fossil fuel combustion
and industrial processes; CO2 from Forestry and Other Land Use (FOLU); methane (CH4);
nitrous oxide (N2O); fluorinated gases covered under the Kyoto Protocol (F-gases) (From:
ipcc, 2014). ... 2
Figure 1.2. Predicted changes in the surface ocean carbonate system in response to changes in atmospheric pCO2 assuming the IS92a Scenario (From: Rost et al, 2008). ... 4 Figure 1.3. Distribution of Total Carbon Dioxide, Bicarbonate, and Carbonate in function of the seawater pH (From: Raven et al., 2005) ... 5 Figure 1.4. The carbonate system of seawater. CCS (carbon capture and storage) is the excess of CO2 produced that is dissolved and stored into the ocean. It will participate dissolving the
CaCO3 and altering the carbonates equilibrium (From: British Geological Survey). ... 6
Figure 1.5. Areas of shallow-water (<200 m) hydrothermal venting with known data on biota (in several cases one symbol shows more than one closely located areas). 1.Kolbeinsey, 2.Tyrrhenian Sea (Capes Palinuro and Messino, Bahia Pozzuoli, Panarea Island), 3.Aegean Sea (Islands Santorini and Milos), 4.D. João de Castro Bank, Azores, 5.Kraternaya Bight, Ushishir Island, Kuril Islands, 6.Kunashir Island, Kuril Islands, 7.Kagoshima Bay, 8.Tokora and Iwo Islands (Kita-Iwo-jima and Akuseki-jima), 9.Nishino-shima Sintoh, Ogasawara Islands, 10.Kueishan Is., Taiwan, 11.Esmeralda Bank, Mariana Islands, 12.Matupi Harbour, New Britain Island and Tutum Bay, Ambitle Island, Papua New Guinea, 13.Bay of Plenty, New Zealand, 14.White Point, Palos Verdes, California, 15.Punta Banda and Punta Mita, Baja California (From: Tarasov et al., 2005). ... 12 Figure 2.1. Sampling locations in the islands of Faial (A - Ponta da Espalamaca) and São Miguel (B - Ribeira Quente). ... 15 Figure 2.2. Map with in situ measurements of surface pH (total scale) for the 3 locations sampled during the field campaign in S. Miguel (03/07/2014-08/07/2014): Reference (37º43'39.097"N 25º18'41.292"W), Intermediate ((37º43'34.565"N 25º19'41.635"W) and Vent (37º43'28.736"N 25º19'28.596"W). ... 16
VIII
Figure 2.3. Map with in situ measurements of surface pH (total scale) for the 3 locations sampled during the field campaign in Faial (10/07/2014-15/07/2014): Reference (38º32'20.184"N 28º36'12.816"W), Intermediate ((38º32'31.74"N 28º35'58.272"W) and Vent (38º32'3.433"N 28º36'56.855"W). ... 17 Figure 2.4. Incubation chambers for copepod EPR quantification. ... 20 Figure 3.1. pH variation along the water column in three sites: Reference (Ref), Intermediate (Int) and Vent (Vnt) of São Miguel (a, b, c) and Faial (d, e, f). ... 22 Figure 3.2. Violin plots for pH (a) and temperature (b) values distribution in the three sites (Ref-Reference, Int-Intermediate, Vnt-Vent) of São Miguel. White points are the median of the data and black boxes indicate the interquartile range. ... 23 Figure 3.3. Abundances per zooplankton phylum (ind/m3, mean±SE) for the three sampling sites in São Miguel (Ref-Reference, Int-Intermediate, Vnt-Vent). ... 27 Figure 3.4. Abundances per zooplankton phylum (ind/m3, mean±SE) for the three sampling sites in Faial (Ref-Reference, Int-Intermediate, Vnt-Vent). ... 28 Figure 3.5. Non-metric multi-dimensional scaling (nMDS-Bray-Curtis similarities) analyses of zooplankton assemblages in São Miguel. ... 30 Figure 3.6. Non-metric multi-dimensional scaling (nMDS-Bray-Curtis similarities) analyses of zooplankton assemblages in Faial. ... 31 Figure 3.7. Samples biovolume (cm3/m3) of each site (Ref-Reference, Int-Intermediate, Vnt-Vent) of São Miguel and Faial (means±SE). ... 32 Figure 3.8. RNA:DNA of the main groups found at each site (Ref-Reference, Int-Intermediate, Vnt-Vent) of São Miguel and Faial Islands. Decapoda, cladocera and euphausiacea were groups only analyzed in Faial. ... 33 Figure 3.9. Egg production rate ((eggs+nauplii)/adult females) at each site (Ref-Reference, Int-Intermediate, Vnt-Vent) of São Miguel (means±SE). Incubation chambers were placed for periods of 24 and 72h. ... 34
IX
Figure 3.10. Egg production rate ((eggs+nauplii)/adult females) at each site (Ref-Reference, Int-Intermediate, Vnt-Vent) of Faial (means±SE, n=3). Incubation chambers were deployed during 72h. ... 35
X
List of tables
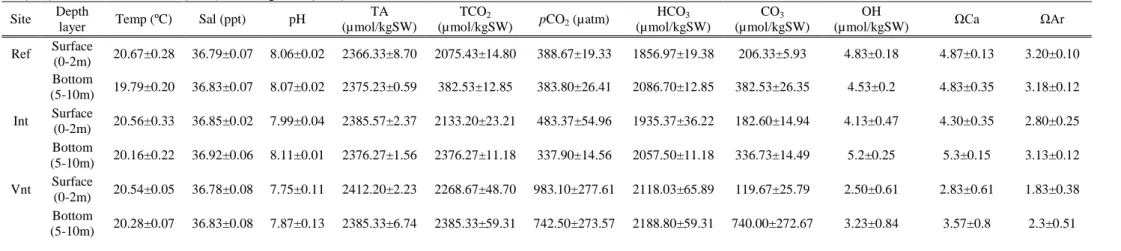
Table 3.1. Seawater carbonate chemistry variables (means±SE, n=3) for each site (Ref-Reference, Int-Intermediate, Vnt-Vent) on São Miguel. The parameters represented are: temperature (Temp), salinity (Sal), pH (total scale), total alkalinity (TA), CO2 (total scale),
CO2 pressure, bicarbonate (HCO3), carbonate (CO32-), CO2, ion hydroxide (OH), saturation of
calcite (ΩCa) and aragonite (ΩAr). ... 25 Table 3.2. Seawater carbonate chemistry variables (means±SE, n=3) for each site (Ref-Reference, Int-Intermediate, Vnt-Vent) on Faial. The parameters represented are: temperature (Temp), salinity (Sal), pH (total scale), total alkalinity (TA), CO2 (total scale), CO2 pressure,
bicarbonate (HCO3), carbonate (CO32-), CO2, ion hydroxide (OH), saturation of calcite (ΩCa)
and aragonite (ΩAr). ... 25 Table 3.3. Gas emissions and composition in São Miguel and Faial venting sites (b.d.l.-below detection limit). ... 26 Table 3.4. PERMANOVA on Bray-Curtis similarities for untransformed abundances in São Miguel. Site is fixed and Date is a random factor; unrestricted permutations (9999) of data were used. Df-degrees of freedom, Sum Sq-Sum of squares, Mean Sq-Mean of squares. ... 29 Table 3.5. PERMANOVA on Bray-Curtis similarities for untransformed abundances in Faial. Site is fixed and Date is a random factor; unrestricted permutations (9999) of data were used. Df-degrees of freedom, Sum Sq-Sum of squares, Mean Sq-Mean of squares. ... 30 Table 3.6. ANOVA on biovolume. Df-degrees of freedom, Sum Sq-Sum of squares, Mean Sq-Mean of squares (n=5 in São Miguel and n=3 in Faial). ... 32 Table 3.7. ANOVA on São Miguel egg production rate (24 and 72h incubation). Df-degrees of freedom, Sum Sq-Sum of squares, Mean Sq-Mean of squares (n=3). ... 34 Table 3.8. ANOVA on Faial egg production rate (24h incubation). Df-degrees of freedom, Sum Sq-Sum of squares, Mean Sq-Mean of squares (n=3). ... 35
XI
Index
1. Introduction ... 1
1.1. Global change ... 1
1.2. Ocean acidification ... 3
1.3. A different challenge for the marine zooplankton ... 11
1.4. Determining physiological status: RNA:DNA ratio ... 13
1.5. Aims ... 14
2. Methodology ... 15
2.1. Study site ... 15
2.2. Seawater chemistry and gas composition ... 17
2.3. Zooplankton assemblages ... 18
2.4. RNA:DNA ratio ... 19
2.5. Copepod Egg Production Rates (EPR) ... 20
2.6. Data analyses ... 20
3. Results ... 22
3.1. Seawater chemistry and gas composition ... 22
3.2. Zooplankton assemblages ... 26
3.3. RNA:DNA ratio ... 32
3.4. Copepod Egg Production Rates (EPR) ... 33
4. Discussion ... 36
4.1. Seawater chemistry and gas composition ... 36
4.2. Zooplankton assemblages ... 38
4.3. RNA:DNA ratio ... 41
4.4. Copepod Egg Production Rates (EPR) ... 41
5. Conclusions ... 44
6. References ... 45
1
1. Introduction
1.1.Global change
Economic growth in the industrial age has brought unprecedented wealth to the planet; in the U.K., the birthplace of the industrial revolution, real GDP per capita has grown by 12 times since 1830 (Erickson, 2014). Growth in economic activity has also come at a cost, as greenhouse gases (GHG) emissions have grown since pre-industrial times (IPCC, 2007), while CO2 has increased by approximately 30% (Carman et al., 2004).
Since 1751 approximately 337 billion metric tons of carbon have been released to the atmosphere from the consumption of fossil fuels and cement production. Half of these emissions have occurred since the mid-1970s. The 2007 global fossil-fuel carbon emission estimate, 8365 million metric tons of carbon, represents an all-time high and a 1.7% increase from 2006 (Boden et al., 2010). Continued emission of greenhouse gases will cause further warming and long-lasting changes in all components of the climate system, increasing the likelihood of severe, pervasive and irreversible impacts for people and ecosystems (IPCC, 2014).
Carbon dioxide represents 75% of anthropogenic GHG emissions, followed by CH4, N2O and
others fluorinated gases (figure 1.1). The human activities responsible for the increased emissions include in first place the burning of fossil fuels use and industrial processes and, to a lesser extent, changes to land use, including deforestation.
2
Figure 1.1. Total annual anthropogenic greenhouse gas emissions (gigatonne of CO2-equivalent per year) for the
period 1970 to 2010 by gases: CO2 from fossil fuel combustion and industrial processes; CO2 from Forestry and
Other Land Use (FOLU); methane (CH4); nitrous oxide (N2O); fluorinated gases covered under the Kyoto
Protocol (F-gases) (From: ipcc, 2014).
Measurements of atmospheric CO2 during the last 56 years have revealed a consistent
increase, from an annual average of 315,24 ppm in 1958 to 365,11 ppm in 2014 (CO2Now.org, 2014). This current level is also much higher than it has been at any time over the course of human civilization (Harrould-Kolieb & Savitz, 2009). In spite of these large CO2 sinks, atmospheric CO2 increased at a rate of approximately 3.3 Gt C y–1, and thus
atmospheric CO2 concentrations continued to rise (Carman et al., 2004). A large fraction of
anthropogenic climate change resulting from CO2 emissions is irreversible on a multi-century
to millennial time scale, except in the case of a large net removal of CO2 from the atmosphere
over a sustained period (ipcc, 2014).
Besides CO2 contribution, methane in second place is a potent greenhouse gas, and oceans
seem as a supplier of vast quantities to the atmosphere (Ingall, 2008). It has been proposed by Karl et al. (2008) that the net efflux of methane from ocean to atmosphere is driven by aerobic methane production, fuelled by the microbial use of methylphosphonic acid (MPn) as a source of phosphorus in phosphate-stressed waters. During MPn utilization, methane is quantitatively released, whereas phosphorous is incorporated into new cell mass (Karl et al., 2008). Metcalf et al. (2012) identified a phosphonate biosynthetic gene cluster in an abundant
3
marine archaeon of surface waters, reaffirming the idea of that MPn synthesis is prevalent in marine systems. Since nutrients availability in the upper ocean is largely controlled by the upwelling from the deep-ocean, and mixing between surface and deep-ocean layers is predicted to decrease, it could promote the use by marine microbes of phosphonates (Karl et
al., 2008) found in the low-molecular-weight fraction of dissolved organic matter (Ingall,
2008).
1.2.Ocean acidification
The oceans cover about 71% of Earth’s surface to an average depth of 3700 m (Pörtner et al., 2014). They play a vital role in global biogeochemical cycles, contribute enormously to the planet’s biodiversity and provide a livelihood for millions of people (Raven et al., 2005). Several sources indicate that oceans have the capacity to absorb part of this carbon dioxide, acting as a “carbon sink” and thus, moderating the impact of climate change on terrestrial life (Harrould-Kolieb & Savitz, 2009). Approximately one-third of the CO2 that has entered the
atmosphere over the past 100 years has been absorbed into ocean surface waters and has resulted in the elevation of partial pressure of CO2 in seawater and reduction of seawater pH
(Kurihara, 2008).
Without the oceans playing this role, the concentration of carbon dioxide in the atmosphere would be 55% higher (Fabry et al., 2004). Prior to the Industrial Revolution the oceans were in relative equilibrium with the atmosphere, absorbing about the same amount of carbon dioxide each year as they released (2.15 billion metric tons of CO2) (Harrould-Kolieb &
Savitz, 2009). However, as the concentration of carbon dioxide in the atmosphere has increased, the flux of CO2 from the atmosphere to the ocean has reduced the average pH of
sea water by about 0.1 pH units over the past century, with the greatest reduction occurring at high latitudes (Cramer et al., 2014), equivalent to a ca. 25 % increase in acidity (Havenhand, 2012). The oceans will continue to absorb carbon dioxide from the atmosphere as long as the concentration of carbon dioxide in the surface waters is less than that in the atmosphere (Harrould-Kolieb & Savitz, 2009).
The carbon dioxide absorption will result in an unavoidable decreasing of the pH over the next several centuries, comparing to any inferred from the geological record of the past 300 million years, with the possible exception of those resulting from rare, extreme events such as bolide impacts or catastrophic methane hydrate degassing (Caldeira & Wickett, 2003). It is predicted that by 2100 surface ocean pH could fall by 0.3/0.4 units and pCO2 of 750ppm
4
(Fitzer et al., 2012; Dupont & Thorndyke, 2009; Havenhand, 2012), and according with the IPCC emissions scenarios, if there is an unrestricted burning of fossil fuels, an extreme scenario with a reduction of 0.7 units will occur until 24th century (Caldeira & Wickett, 2003). The acid–base chemistry of the CO2–carbonate system in the sea
The alkalinity of seawater, which expresses the buffering capacity of water or the capacity of the water to neutralize acids, is governed by the minerals dissolved, to which bicarbonates contribute largely. The pH is an indication for the acidity of a substance. It is determined by the number of free hydrogen ions (H+). Thus, the surface waters of the open ocean vary between pH 7.9 and 8.3, while coastal waters, in contrast, routinely vary between mean pH 7.5 and 8.5 dependent on the habitat and show much larger seasonal and diel fluctuations (Kerrison, 2011). It is largely a function of the dissociation of dissolved inorganic carbon (DIC), whose relative proportions by mass are ∼0.5% aqueous CO2, ∼89% bicarbonate
(HCO3-), and ∼11% carbonate ions (CO32- ) (Waldbusser & Salisbury, 2014). According to
Henry’s Law, in a simple aqueous solution we would expect the concentration of CO2 in the
air to be proportional to that in the solution of carbonic acid (Raven et al, 2005). So changes in atmospheric pCO2 will directly affect the carbonate system of the surface ocean, since
atmosphere and surface ocean exchange CO2 on time scales of several months (Rost et al.,
2008) (figure 1.2).
Figure 1.2. Predicted changes in the surface ocean carbonate system in response to changes in atmospheric
5
A portion of the dissolved carbon dioxide reacts with seawater to form carbonic acid (H2CO3), and then it can divides in HCO3- (bicarbonate ion) releasing one H+ to the solution.
When the H+ content is low, the CO32– (carbonate ion) increase, while a high H+ concentration
causes a reaction to the carbonate becoming HCO3-. Thus, the net effect of the dissolution of CO2 in seawater is to alter this equilibrium, increasing the concentrations of H+, H2CO3 and
HCO3–, while decreasing concentrations of CO32– (figure 1.3).
Figure 1.3. Distribution of Total Carbon Dioxide, Bicarbonate, and Carbonate in function of the seawater pH
(From: Raven et al., 2005)
The term ‘carbonate buffer’ is used to describe how the dissolved inorganic carbon system in seawater acts to diminish changes in ocean H+ concentration, and thus stabilize pH (Raven et
al., 2005) (figure 1.4). It occurs first for the CO2 uptake from the atmosphere and second, for
the interaction of seawater with oceanic sediments composed of CaCO3, which is mainly
controlled by a “biological pump”. The pump may be defined as the movement of CO2 that
enters into the ocean from the atmosphere to the deep-ocean floor through biological processes, i.e. photosynthetic fixation of CO2 by phytoplankton, passive export of organic
carbon (e.g. fecal pellets of zooplankton, detritus, and dead organisms) and carbonates (e.g. shells and bones) by gravitation, or through vertical migration of zooplankton to the deep ocean (Kurihara et al., 2004a).
6
Figure 1.4. The carbonate system of seawater. CCS (carbon capture and storage) is the excess of CO2 produced
that is dissolved and stored into the ocean. It will participate dissolving the CaCO3 and altering the carbonates
equilibrium (From: British Geological Survey).
The preservation of the organisms in sea floor sediments depends on the solubility of CaCO3
in seawater and on the concentration of carbonate ions. Thus, there is a critical concentration of carbonate ions in seawater (the saturation concentration) below which CaCO3 will start to
dissolve. Because CaCO3 solubility increases with decreasing temperature and increasing
pressure, the critical concentration occurs at a depth, the ‘saturation horizon’, below which seawater is undersaturated and CaCO3 will tend to dissolve and above which seawater is
super-saturated and CaCO3 will tend to be preserved. Because the CaCO3 mineral calcite is
less soluble than the form aragonite, the aragonite saturation horizon is shallower. Because added CO2 decreases the carbonate ion concentration, the saturation horizons will become
shallower with increasing releases of human derived CO2 to the atmosphere (Raven et al.,
2005). It is estimated that highlatitude surface oceans will become undersaturated with respect to aragonite by the year 2050, which may lead to the dissolution of aragonite shells (Kurihara, 2008).
Consequences for the biota
While the chemical processes underlying ocean acidification are well understood and accepted, we are just beginning to understand the wide-ranging effects acidification is likely to have on marine wildlife (Harrould-Kolieb & Savitz, 2009). Given that seawater carbonate chemistry can be highly variable, conditions that organisms are actually exposed to are difficult to measure Furthermore, the sensitivity of organisms can vary across life history
7
stages and in conjunction with other stressors (Waldbusser & Salisbury, 2014).The potential risks to marine systems from the current period of ocean acidification remain to be quantified; as yet, there are few robust indicators of the likely long-term biological consequences (Fitzer
et al., 2012). Evidence from the geological record shows that previous periods of intense
ocean acidification, e.g. at the end of the Paleocene, coincided with mass extinction events (Jackson, 2010).
A major consequence of increasing ocean acidity is a reduction in the amount of carbonate available (as CO32-) for marine biota. One of the most important uses of carbonate in the
ocean is the formation of calcium carbonate or limestone structures such as corals skeletons, pearls, and the shells of coccolithophores, foraminiferans, pteropods or bivalves, i.e. the calcifiers (Raven et al., 2005; Caldeira & Wickett, 2003; Kurihara, 2008; Fabry et al., 2008). Calcification is only one physiological parameter affected by the ocean acidification, marine organisms can experience physiological stress not directly related to calcification due to an increase in CO2 (hypercapnia) and/or a decrease in pH (Dupont & Thorndyke, 2009). The life
cycle stages are differently susceptible, being reproductive and early life-story stages considered particularly vulnerable (Fitzer et al., 2012; Kurihara, 2008; Dupont & Thorndyke, 2009). Even if increased acidity may not directly kill non-calcifying organisms, many are likely to be harmed in ways that reduce their overall fitness and ability to survive. These impacts could include decreased growth rate, reduced reproduction, disrupted respiratory and nervous system function and increased susceptibility to predators and disease, all of which could produce ripple effects through food webs and ecosystems. Ultimately, ocean acidification could transform the oceans, leaving them far less diverse and productive and making the lives and livelihoods of those who depend on them far more uncertain (Harrould-Kolieb & Savitz, 2009).
Most biota reside near the surface, where the greatest pH change would be expected to occur, but deep-ocean biota may be more sensitive to pH changes (Caldeira & Wickett, 2003), since CaCO3 is abundant in sediments, so the pH of the deep oceans cannot change by large
amounts over timescales of 10000 years (Raven et al., 2005). However, another view has to be considered, organisms adapted to warm environments appear to be closer to thermal thresholds than cold-adapted organisms are, and plasticity in physiology may be costly to other functions, such as reproduction (Waldbusser & Salisbury, 2014). Further, extreme temperature events are principal drivers of biogeographic redistribution (Wethey et al., 2011).
8
Consequences for zooplankton
Zooplankton is a key component of aquatic communities, and knowledge of how they cope with environmental stressors is important for understanding how the aquatic ecosystem as a whole will respond (Chan et al., 2008). The holozooplanktonic CaCO3 producers are the
foraminifera (shells of calcite), euthecosomatous pteropods (shells of aragonite), heteropods (tropical and subtropical oceans, shells of aragonite not always present) and gymnosomes (shells of aragonite cast off at metamorphosis) (Fabry et al., 2008), so it is expected that these groups will be affected under acidification conditions by reducing calcification.
Responses can be variable ranging from negative to neutral or even positive and appear to be species-specific even in closely related species (Troedsson et al., 2013). Broadcast spawning invertebrates are particularly vulnerable to ocean acidification because fertilization of eggs and sperm occurs in the water column followed by development of larvae. Lecithotrophic larvae (10% of marine benthic invertebrates), may be better competitors and less affected since they spend less time in plankton, than planktotrophic larvae (60–90% of marine organisms) which feed on exogenous sources. Any sub-lethal reductions in rate of development and larval size may also have significant consequences for the survival of marine larvae because prolonged larval life phase and delayed settlement may lead to a concomitant increase in the likelihood of predation (Ross et al., 2011). Larvae of benthic calcified organisms will respond with a reduction in calcification rate.
At date, most studies about how ocean acidification can influence the zooplankton community are short-term assays under controlled conditions focused in very restricted groups. These are not always relevant to predicted climate impacts on ecosystems (e.g. using unrealistic pH values and/or acid-based acidification without correcting carbonates and bicarbonates) or ecologically realistic (e.g. single species cultures) conditions (Dupont & Thorndyke, 2009). Since copepods are the main component in marine zooplankton, the most abundant species in each region should be the targets to elucidate responses to CO2 changes.
Planktonic copepods typically account for about 55–95% of the biomass in pelagic zooplankton community and are the dominant herbivores (Longhurst, 1985). While heterotrophic protists in the microbial loop are considered to be the main consumers and recyclers of smaller plankton, copepods mainly transfer carbon captured at lower trophic levels to higher trophic levels (Troedsson et al., 2013). The timing and the intensity of copepod reproduction is considered to be essential for survival of fish larvae, since they feed
9
largely on copepod eggs or nauplii during their early feeding stage. Furthermore, several pelagic fish stocks feed on copepods during their entire lifetime, and their individual growth as well as stock production is highly affected by copepod availability (Debes et al., 2008). Many studies, mostly under controlled conditions, manifest the effects of seawater acidification in different aspects of survival of copepods (annex 7.1). Most of these studies conducted until date showed no responses in copepods or low only when high CO2
concentrations are applied. In addition, the effects of elevated pCO2 on the survival rates of copepods are highly species-specific. Negative responses are more related to early-life stages of copepods i.e. eggs and nauplii production and survival. As example, Calanus finmarchicus survival and early development is not affected by pCO2 levels ≤2000 ppm, only changes at
more than 7000ppm are observables (Pedersen et al., 2013). As in others organisms, these effects can be studied at many levels, as was shown in the previous section. Li and Gao (2012) hypothesized that the increased partial pressure of CO2 and acidity of seawater may
affect the respiration of copepods to cope with the chemical changes, and hence it would mediate their feeding rate to meet the energy demand. Centropages tenuiremis, the dominant costal water calanoid copepod in South China Sea, was able to perceive the chemical changes in seawater (>1700 µatm, pH < 7.60) with avoidance strategy. The respiration increased at elevated CO2 (1000 µatm) and associated acidity (pH 7.83) and its feeding rates also
increased correspondingly, except for the initial acclimating period, when it fed less.
The naupliar production has been a common way to determine the reproductive response on copepods. Different assays under different controlled pH conditions have been carried out. The naupliar production of Tisbe battagliai (Guernsey, UK) increased significantly at pH 7.95 compared with pH 8.06 followed by a decline at pH 7.82, attributed to an initial stress response which was succeeded by a hormesis-like response at pH 7.67 (Fitzer et al., 2012). Further, there was a significant growth reduction and a significant increase in the proportion of carbon relative to oxygen within the cuticle as seawater pH decreased. This strongly suggests that copepods preferentially reallocate resources towards maintaining reproductive output at the expense of somatic growth and cuticle composition. These responses may drive shifts in life history strategies that favour smaller brood sizes, females and perhaps later maturing females, with the potential to profoundly destabilise marine trophodynamics (Fitzer
et al., 2012). In contrast, the nauplii of Tigriopus japonicas, a common benthic copepod in
coastal areas of the temperate zone of Japan, show a high tolerance to elevated pCO2
10
study that nauplii show the highest lethal effects of CO2; Acartia tonsa nauplii mortality rates
increased threefold when pCO2 concentrations reached 1000 µatm (year 2100 scenario) with lethal concentration 50 at 1084 µatm pCO2. In comparison, eggs, early copepodite stages, and
adult males and females were not affected lethally until pCO2 concentrations ≥3000 µatm.
The egg production rate of Acartia spinicauda, Calanus sinicus and Centropages tenuiremis (the dominant copepods in the southern coast of China) is significantly inhibited by the increased pCO2 and the exposure time duration (6.92≤pH≤7.39), while Acartia pacifica only show inhibition with the exposure time duration (Zhang et al., 2011). Calanus glacialis egg production (an Arctic shelf-water copepod) showed no effects under CO2-induced seawater
acidification. However, a reduction in pH to 6.9 significantly delayed hatching and possibly reduced overall hatching success (Weidmann et al., 2012).
Acartia steueri and Acartia erythraea (Japan) showed sensitivity when cultured under
increses pCO2 of +10000ppm (pH 6.8) relative to control. The egg production rates of
copepods decreased significantly. In addition, the nauplius mortality rate increased in A.
erythraea. The survival rates of adult of A. steueri were not affected when reared under
increased CO2 for 8 days, however longer exposure times could have revealed toxic effects of
elevated CO2 concentrations (Kurihara et al., 2004b). These CO2 values are too large, since
they do not reflect an expected change in the near future. It reflects the results of one of the strategies proposed to reduce anthropogenic CO2, i.e. the direct injection of anthropogenic
CO2 into the deep ocean. The local CO2 concentration is expected to be as high as 20,000
ppm and the pH below 5.8, what is expected to affect the water column; thus the effects on zooplankton and bacteria are of primary concern (Kurihara et al., 2004a).
Acartia clausi (Mediterranean sea) under the realistic predicted values two of pH 7.83 and
temperature 20°C (+4ºC) exhibited egg production rate and hatching success decreased significantly over the duration of exposure at future pH under actual and future temperature conditions (Zervoudaki et al., 2013). Acidification does not have an obvious direct effect on the vital rates of the copepod, with the exception of excretion possibly. Therefore, the combination of acidification, ambient oligotrophic conditions and warming could affect the ability of the species to allocate resources for coping with multiple stressors.
11
1.3.A different challenge for the marine zooplankton
Natural CO2 vents have generated a substantial interest in recent years as in situ laboratories
for acidification studies. Field experiments, at sites with naturally-elevated CO2 conditions,
are potentially useful analogues for investigating the effect of future dissolved CO2 levels on
marine organisms and ecosystems (Calosi et al., 2013, Kerrison et al., 2011). Some marine CO2 vents are at ambient seawater temperature and lack toxic sulphur compounds; such vents
can prevail for years to millennia and may be used to advance our understanding (Hall-Spencer et al., 2008). This opens a new door of opportunities at many levels, leaving behind mono-species studies under so restricted conditions for the zooplankton community, where the interactions within and between species and with the environment cannot be addressed. The existence of shallow water submarine volcanic ventis is well known off volcanic islands and provinces (Cardigos et al., 2005), occurring over a wide depth range, from the intertidal to the abyss. The deepest active hot vent known so far with associated fauna is the Ashadze field located at 4000–4100 m depth at 12858V N on the Mid-Atlantic Ridge (Tarasov et al., 2005). Within submersed CO2 vents, it is important to distinguish between deep-sea
hydrothermal vents and shallow-water vents. At deep-sea hydrothermal vents on mid-ocean ridges there is usually a high biomass of largely endemic, but species poor, fauna that depends on chemosynthesis-based production. By contrast, at less than 200 m depth, shallow-water vents tend to have a low biomass of a more diverse fauna with few, or no, endemic species (Cardigos et al., 2005). In addition, shallow water hydrothermal ecosystems are in the euphotic zone, i.e. there is primary production. Biological data have been published for approximately 55 deep-water and 21 shallow-water hydrothermal vent ecosystems (Tarasov et
12
Figure 1.5. Areas of shallow-water (<200 m) hydrothermal venting with known data on biota (in several cases
one symbol shows more than one closely located areas). 1.Kolbeinsey, 2.Tyrrhenian Sea (Capes Palinuro and Messino, Bahia Pozzuoli, Panarea Island), 3.Aegean Sea (Islands Santorini and Milos), 4.D. João de Castro Bank, Azores, 5.Kraternaya Bight, Ushishir Island, Kuril Islands, 6.Kunashir Island, Kuril Islands, 7.Kagoshima Bay, 8.Tokora and Iwo Islands (Kita-Iwo-jima and Akuseki-jima), 9.Nishino-shima Sintoh, Ogasawara Islands, 10.Kueishan Is., Taiwan, 11.Esmeralda Bank, Mariana Islands, 12.Matupi Harbour, New Britain Island and Tutum Bay, Ambitle Island, Papua New Guinea, 13.Bay of Plenty, New Zealand, 14.White Point, Palos Verdes, California, 15.Punta Banda and Punta Mita, Baja California (From: Tarasov et al., 2005).
Any study performed in these environments requires a previous description of the physical-chemical characteristics of the vent site, to stablish properly the perimeter with high CO2
emissions and where its activity ceases. Daily-variations can appear around the main points (Kerrison et al., 2011) as well as other gases and sulfides. Accordingly, analyses of gas composition, temperature, salinity and alkalinity acquire special relevance.
Previous studies on shallow-water vents consider a great diversity of groups, as bacteria (Cardigos et al., 2005; Brinkhoff et al., 1999, Kerfahi et al., 2014), benthic invertebrates (Cardigos et al., 2005; Calosi et al., 2013; Hall-Spencer et al., 2008; Gamenick et al., 1998; Pettit et al., 2013), algae (Cardigos et al., 2005; Hall-Spencer et al., 2008), fishes (Cardigos et
al., 2005) or seagrass (Hall-Spencer et al., 2008; Arnold et al., 2012), but only a recent study
in the coast of Normanby Island (Papua New Guinea) take in count these environments to study possible effects on zooplankton communities. Smith et al. (2014) show that zooplankton abundance appears severely reduced in low pH waters compared to control sites. As result of night samplings, zooplankton abundance appeared highest and the difference between pH sites was greater. Additionally, certain taxonomic groups were also reduced in
13
abundance in low pH waters. These results indicate that CO2 vents are optimal tools to
manifest acidification effects on these communities, and similar studies in others regions of the world with implications to the trophic web assessments are of priority concern.
1.4.Determining physiological status: RNA:DNA ratio
Stablish how environmental stressors affect marine organisms through determining its physiological state has been among of the main aims of several studies. Within this framework, nucleic acid derived indices have been applied with success in microbial communities, invertebrates and fishes (Chícharo & Chícharo, 2008), and RNA:DNA ratio (R:D) has particularly excelled.
The technique is based in the changes produced over the cellular concentration of RNA, which is highly dependent on growth rate, and indirectly on environmental conditions. On an individual basis, DNA per somatic cell is assumed to be constant in sexually mature adults so that the R:D ratio can be related to the magnitude of RNA transcription, protein synthesis and hence growth condition (Pommier et al., 2012). It was firstly proposed by Sutcliffe (1965), followed by Holm-Hansen et al. (1968), who suggest that the concentration of DNA would be a good measure of living carbon in phytoplankton.
Temperature is the dominant factor influencing copepod growth under adequate food supplies; conversely, when the temperature range is narrow, food becomes the predominant determining factor for growth (Chícharo & Chícharo, 2008). Nevertheless, R:D interpretation is not always simple and direct. High R:D has been attributed in copepods to some type of stress that led to produce proteins to cope with stress-induced denaturation of other proteins (Vehma et al., 2012) and Pommier et al. (2012) found that the R:D of copepods was not correlated with DNA concentration, which suggested a spatial variability likely related to variable growth conditions of the copepod population. R:D has not been considered a good indicator of somatic growth, since DNA is growth-dependent and there are confounding factors related to the moult process; after a phase of hyperplasia (DNA proliferation) a phase of hypertrophy (protein assimilation) follows and hence the coupling of both processes depends on the moulting rate (Yebra et al., 2011). For this reason, R:D appear as a good indicator of nutritional condition only in adult individuals.
This variability in the results suggests that even if R:D is a great methodology to assess physiological state of the organisms, results have to be considered with precaution.
14
1.5.Aims
The present study is part of the project MOFETA (MOFETA - EXPL/MAR-EST/0604/2013), which general objective is investigating the ecological effects of ocean acidification in shallow water volcanic CO2 vents of the Azores. This multidisciplinary project is structured
around the following objectives: 1. composition and quantification of the gases emitted in the submarine vents; 2. spatial variability of physical-chemical characteristics of seawater; 3. observational study on planktonic assemblages; 4. observational study on macrobenthic assemblages; and 5. short-term manipulative field experiments with copepod assemblages. Only the tasks related to zooplankton (3 and 5) will be developed here as follow:
1. Observational study on zooplanktonic assemblages
Determine if there are consistent differences in the abundance, diversity and composition of zooplankton assemblages between sites affected by CO2 emissions and control sites, without
emissions.
Relate the observed patterns in zooplankton assemblages in relation to the results of seawater chemistry and gas emissions.
Describe biochemical condition of major zooplanktonic groups using nucleic acids (growth and biomass indicators) and relate their ecophysiological status (RNA:DNA ratio) to possible stress caused by CO2.
2. Short-term manipulative field experiments with copepod assemblages
Compare the Egg Production Rates (EPR) of the most abundant copepod free-spawning species between sites affected by CO2 emissions and control sites, without emissions, to
15
2. Methodology
2.1.Study site
The study was conducted in the Azores archipelago, composed of nine volcanic islands localized in the mid-Atlantic ridge. Two active volcanic areas with submarine CO2 emissions,
one in the island of São Miguel and one in the island of Faial, were chosen for the purpose of this study (figure 2.1). São Miguel and Faial were selected within the archipelago because of the previous knowledge about the existence of submersed shallow-water CO2 vents in two
specific locations of these islands. Three sampling sites were selected within each island, two locations along the gradient of CO2 emissions (Intermediate and Vent) and one Reference site,
with similar characteristics, but no degassing. Test dives and pH measurements with a CTD equipped with a pH probe (YSI6600) were the bases to select the Vent site (were the emissions were stronger) and two subsequent locations (Reference site and Intermediate gradient site) at a reasonable distance and with similar bottom geology and depth conditions.
Figure 2.1. Sampling locations in the islands of Faial (A - Ponta da Espalamaca) and São Miguel (B - Ribeira
Quente).
In São Miguel the Vent site (Ponta da Lobeira) was located in the south coast, close to the village of Ribeira Quente, in the flank of Furnas Volcano, between the Reference at Garajau and Intermediate site at Covões (figure 2.2). In Faial, the sampling sites were located in the
16
southeast of the Island; the Reference site at the exit of the Horta port, while the Vent and Intermediate sites were in front of Ponta da Espalamaca (figure 2.3). Conditions between both islands were very different, with the maximum depth of 10 meters at São Miguel, while at Faial it was 37 meters. Given their proximity to the Faial-Pico channel, the sites in Faial were strongly exposed to tidal currents. The “vent sites” in both islands also differed in terms of their geological characteristics, since some of the emissions in São Miguel were warm while in Faial they were always cold. According to these characteristic they can been denominated as hot vents and cold seeps (Tarasov et al., 2005).
Figure 2.2. Map with in situ measurements of surface pH (total scale) for the 3 locations sampled during the
field campaign in S. Miguel (03/07/2014-08/07/2014): Reference (37º43'39.097"N 25º18'41.292"W), Intermediate ((37º43'34.565"N 25º19'41.635"W) and Vent (37º43'28.736"N 25º19'28.596"W).
17
Figure 2.3.Map with in situ measurements of surface pH (total scale) for the 3 locations sampled during the field campaign in Faial (10/07/2014-15/07/2014): Reference (38º32'20.184"N 28º36'12.816"W), Intermediate ((38º32'31.74"N 28º35'58.272"W) and Vent (38º32'3.433"N 28º36'56.855"W).
2.2.Seawater chemistry and gas composition
On each day of the sampling campaign, the physicochemical characteristics of the seawater (temperature, salinity and pH) were measured in situ, using a YSI6000 multiprobe. In addition to the in situ measurements, three water samples were collected at the surface (0-2m) and near the bottom (6-10m in São Miguel and 15-38m in Faial) each site to be analyzed in the laboratory and obtain the seawater carbonate chemistry variables. pH was measured in the laboratory using a glass electrode (WTW, pH 340i) calibrated with a TRIS seawater buffer. Total alkalinity was obtained through potentiometric titration, following Dickson et al. (2003), and using a Metrohm Titrino Plus 848 equipped with a 869 Compact Sample Changer, and calibrated with certified Reference material supplied by A. Dickson. Seawater samples were filtered through a 0.2 µm membrane and measured within 48h.
Gas sampling was done in three patches of CO2 flow in each venting site (Ribeira Quente and
Ponta da Espalamaca), using Giggenbach bottles (bottles filled with NaOH 4N and under vaccum). Thus, acid gases dissolve in the basic solution and the more inert gases (non absorbed) remain in the headspace of the bottle. Then, samples were analyzed in the laboratories of CVARG (Centro de Vulcanologia e Avaliação de Riscos Geológicos,
18
University of Azores) through gas chromatography, potentiometric titration and colorimetric titration techniques. Three replicates were collected in each area.
2.3.Zooplankton assemblages
Mesozooplankton was sampled using oblique tows with a WP2 net Ø60cm and 200 μm mesh, equipped with a flow meter to determining the amount of water passing through the plankton net, during 10 minutes and at approximately 2 knots. Five tows were effectuated at São Miguel at each station between days 3 and 7 of July, 2014. In Faial, a net with 500µm mesh was used instead of the 200µm mesh used in São Miguel, since during the first sampling, the smaller one was lost. Three tows in each station of Faial were conducted between days 10 and 15 of July, 2014. Immediately after sampling, mesozooplankton was preserved in 4% borax buffered formaldehyde. Another oblique tow with the same procedure was effectuated at each location to preserve mesozooplankton partially in RNA later for biochemical determinations (RNA:DNA ratio) and partially was kept alive for manipulative experiments (egg production rates). These tows were conducted with a modified cod end, without a mesh in order to collect the organisms without much damage.
The total biovolume of each sample was determined by the method of displacement volume. Sub-samples were obtained using a Folsom splitter and 300-500 organisms per sample were counted and identified under a binocular microscope. The level of taxonomic resolution was different among phyla. Inside Arthropoda, all organisms found in the samples belong to the subphylum Crustacea, and resolution was higher than in the others phyla. Different life stages of Cirripedia (cyprid and nauplii), Copepoda (Nauplii), Euphausiacea (caliptopis, furcilia and nauplii), fish (eggs and larvae) and Coleoidea (eggs and larvae) were considered as different taxa for every analysis. Pelagia noctiluca, despite not to be quantified and included in the analysis since the sampling was not directed at these organisms which do not belong to mesozooplankton, appeared in some tows on the venting sites of São Miguel and Faial.
A different approach was considered for a better description of the community and comparison with other areas. As described in other studies (Shi et al., 2015, Sun et al., 2010), classification of zooplankton functional groups can be based on the size of the zooplankton, food preferences, trophic functionality, interactions between one another or relationships with higher trophic levels. In this study, it was considered to separate Crustacean according with its size (small, big and giant crustacean) since it was a dominant group in terms of abundance in São Miguel. Cnidaria, Mollusca, fish, Radiozoa e Tunicata were differentiated as independent
19
functional groups, while Annelida, Chaetognatha, Echinodermata and Foraminifera were pooled as “Others” since its abundance was too low in both islands.
2.4.RNA:DNA ratio
The most abundant and well preserved taxa were used for the RNA:DNA analysis in each site of both São Miguel and Faial islands. Nucleic acids were obtained using a method based in the microplate fluorescent assay (MFA) of Ikeda et al. (2007), which is a modification of the sequential fluorometric method of Bentle et al. (1981). Bentle et al. (1981) method is based on the use of an ethidium bromide fluorometric technique, where the nucleic acids are sequentially degraded by nucleases (RNase and DNase). Wagner et al. (1998) modified the sequential fluorometric method to the MFA with 96-well microtiter plates by adopting a sarcosyl extraction technique and eliminating the DNase step, allowing the measurement of nucleic acids of several samples at the same time.
Prior to the assay, a batch of 3 to 30 organisms were sorted depending on the taxa. Zooplankton organisms were homogenized by sonication (3 pulses 50 A during 1 min) with cold sarcosyl extraction buffer. The volume of extraction buffer was between 100 and 200 μl (0.5%). Then all samples were shaken for 30 minutes at room temperature using a vortex mixer equipped with a multiple-vial head. Afterwards, they were centrifuged (12 000 r.p.m, 0-4ºC) for 15 min to sediment any organism remain particle. The samples were diluted 1:10 with Tris buffer to reduce the sarcosyl concentration to 0.05%. In each run, duplicate 20-40 μl aliquots of supernatants of the samples and duplicates of 0, 1.1, 1.7 and 2.3 μg ml–1 DNA standard solutions (λ-phagus 0.25 mg ml–1 from Roche) and 0, 7.3, 14.6 and 21.9 μg ml–1 RNA standard solutions (16s-23s E. coli 4 µg µl–1 from Roche) were transferred to Nunclon 96-well, black, round-bottom microplates. The ratio of DNA and RNA slopes was 8, which can be used to compare RNA/DNA ratio results determined by other protocols (Caldarone et
al., 2006). Gel Red solution (15 μl) was added to each well, and the plates were shaken gently
at room temperature. The fluorescence was then scanned after addition of the fluorescent dye on a microplate reader (Biotek synergy HT model SIAFRTD) with 360 nm (excitation) and 590 nm (emission) (first scan- total fluorescence RNA and DNA). Following the first scan, RNase solution (15 μl, 0.12 µg ml-1) was added to each well and incubated at 37ºC for 30 minutes. The concentration of DNA was calculated directly by the standard curve. The concentration of RNA was determined indirectly by subtraction of DNA fluorescence (second scan) from total fluorescence (first scan). The fluorescent dye used was Gel red solution.
20
Many protocols based upon this methodology used ethidium bromide (EB), which exhibits fluorescence when bound to nucleic acids (which gives the total nucleic acid concentration in one reading). However in recent years EB has been largely replaced with alternatives like Gel Red, which are safer to use and exhibit the desired fluorescence when exposed to nucleic acids.
2.5.Copepod Egg Production Rates (EPR)
Oblique tows, as described above were effectuated, but using a modified cod end, without mesh, in order to minimize damage to the organisms. As fast as was possible, the collected material was introduced in the incubation chambers for that location (figure 2.4), and placed by divers 1 m above the sea bottom.A total of 18 chambers were placed at each Island, and the time of incubation in São Miguel lasted 24h (3 replicates per site) and 72h (3 replicates per site) while in Faial the six replicates per site were incubated for 72h. When removed, the content was preserved in lugol. Each PVC chamber had 38cm high and 10cm of diameter, divided inside with a 500µm mesh in a superior part with 30cm and an inferior part with 8cm, in order to allow eggs fall down to avoid predation. Around the chambers there was a mesh with 50 μm, to maintain the eggs inside but allow exchange of seawater and smaller food particles. For determining the Egg Production Rates (EPR) of copepods, eggs and nauplii were considered over the total adult females. In São Miguel all individuals inside the chambers were identified as Paracalanus sp. and Clausocalanus sp., while in Faial calanoids as Centropages sp. and other harpacticoids species were identified.
Figure 2.4. Incubation chambers for copepod EPR quantification.
2.6.Data analyses
Patterns of variation in zooplanktonic assemblage structure along the CO2 gradient in each
21
was considered independently, and two orthogonal factors were considered in the analyses: Site was considered a fixed factor with three levels corresponding to areas with different volcanic CO2 emissions (Intermediate and Vent) and control areas, without emissions
(Reference); Date was considered a random factor with 5 levels in São Miguel and 3 in Faial. Statistical differences among assemblages were tested using Permutational multivariate analysis of variance (PERMANOVA) on Bray-Curtis similarities with untransformed abundances. The similarity percentages routine (SIMPER) was used to examine the contribution of each taxon to average dissimilarities between sample groups. Ordination by non-metric multidimensional scaling (nMDS) was used to visualize patterns in the biological dataset.
Abundance (N), nº of taxa (S) and diversity (d) were calculated for the entire assemblage and for the dominant phyla using RStudio version 3.1.2. (R Core Team, 2013), while eveness (J´) was obtained with the DIVERSE routine on the PRIMER 6 statistical (PRIMER- E. Plymouth Marine Laboratory). Abundances and relative abundances of functional groups were as well calculated using RStudio. Univariate analyses of variance (ANOVA) were used to test for statistical differences in the taxa highlighted by the SIMPER routine, abundances, nº of taxa, diversity indices, secondary production (egg production rate) and biovolume of samples. Differences between means have been considered statistically significant for p <0.05. Homogeneity of variances was previously tested with the Bartlett test, and pair-wise tests for group means were done a posteriori on significant effects. Statistical analyses and data representation were done using RStudio.
22
3. Results
3.1.Seawater chemistry and gas composition
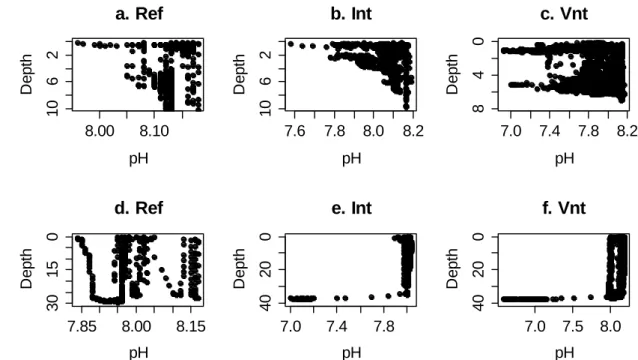
pH varied along the water column according with figure 3.1. In São Miguel, pH decreased under 7.0 in the Vent site near to the bottom and in the surface, while in the Intermediate and Reference sites, lowest values appeared nearest to the surface, about 7.6 and 8.0 respectively. In Faial, pH varied similarly in Vent and Intermediate sites, being under 7.0 in the bottom, while in the Reference it oscillated from 7.85 to 8.15 along the water column. The water column in São Miguel varied from 10 m in the Reference and Intermediate sites to 7m in the Vent, while in Faial it was almost 40 m in the Intermediate and Vent, and 30 m in the Reference site.
Figure 3.1. pH variation along the water column in three sites: Reference (Ref), Intermediate (Int) and Vent
(Vnt) of São Miguel (a, b, c) and Faial (d, e, f).
Figure 3.2 shows the pH and temperature values frequency in São Miguel (11a-b) and Faial (11c-d). In both islands, highest values of pH were constant through the three sites, while lowest values appeared only in the venting site, and Intermediate was between both. Temperature scarcely varied. In São Miguel, lowest values increased from Reference to Vent, while in Faial this variation was not constant.
8.00 8.10 10 6 2 a. Ref pH D e p th 7.6 7.8 8.0 8.2 10 6 2 b. Int pH D e p th 7.0 7.4 7.8 8.2 8 4 0 c. Vnt pH D e p th 7.85 8.00 8.15 30 15 0 d. Ref pH D e p th 7.0 7.4 7.8 40 20 0 e. Int pH D e p th 7.0 7.5 8.0 40 20 0 f. Vnt pH D e p th
23
Figure 3.2. Violin plots for pH (a) and temperature (b) values distribution in the three sites (Ref-Reference,
Int-Intermediate, Vnt-Vent) of São Miguel. White points are the median of the data and black boxes indicate the interquartile range.
Seawater carbonate chemistry variables (daily means) for each of the three sites sampled in both São Miguel and Faial are summarized in tables 3.1 and 3.2. The water column was sampled at the surface (0-2m) and bottom (10m in São Miguel and 38m in Faial). In São Miguel island, temperature and salinity did not vary significantly from bottom to surface and among sites (19.79 to 20.67ºC, 36.78 to 36.92ppt), only minimum temperature in the bottom increased minimally from Reference to Vent. pH decreased gradually from the Reference to the Vent site in the surface, while in the bottom, the Intermediate value did not follow this pattern. In Faial, salinity only increased in the surface 0.21 ppt from the Reference to the Vent, and temperature did not vary between sites; there were some grades of difference from bottom to surface due to a thermocline (ref-1.53ºC, int-1.4ºC, vnt-2.39ºC). Measurements of pH in table 3.2 show no variation in the pH at the surface, while at the bottom it dropped from
7 .0 7 .4 7 .8 8 .2 Ref Int Vnt
a.São Miguel-pH
19 20 21 22 23 Ref Int Vntb.São Miguel-temp
7 .0 7 .5 8 .0 Ref Int Vntc.Faial-pH
17 19 21 Ref Int Vntd.Faial-temp
24
8.13 in the Reference to 8.02 in the Intermediate and 7.88 in the Vent. Total alkalinity did not vary substantially among sites or between both islands.