Conference Paper
Airflow and Thermal Behavior within Peaches
Packaging Box Using Computational Fluid
Dynamics - A Preliminary Study
Adhiyaman Ilangovan, Pedro D. Silva, and Pedro D. Gaspar
University of Beira Interior, Covilhã, Centre for Mechanical and Aerospace Science and Technologies (C-MAST)
Abstract
Post-harvest cold storage of peaches is an essential element to maintain the quality of the fruits without any loss. This work aims to present a CFD model, to predict airflow patterns and temperature profiles in ventilated packaging systems, during the forced-air cooling of Peaches stored in a cold chamber. Transient CFD simulations are performed for the chamber containing four ventilated boxes and the evaluation of the results show that the temperature removal near the vent holes and the hand holes is relatively high when compared to other regions of the packaging box. This preliminary study reveals the airflow behavior develop an uneven temperature distribution within the box. To overcome the flaws, future work is focused on modifying the vent hole design to improve the airflow phenomenon to maintain the temperature homogeneity throughout the box.
Keywords:Peach, Computational fluid dynamics, Airflow, Heat transfer, Packaging
1. Introduction
Consumers around the world highly appreciate the peach fruit for its juicy texture, pleasant flavor and high nutrient content. Besides the needs and outcomes, these climacteric fruits are more sensitive and ripen rapidly during the post-harvest storage [1, 2]. Shelf life of peaches is hardly 7 days in ambient temperature and the short shelf life of this fruit include rapid metabolism because of high respiration rate, fungal decay after harvest, weight loss, physiological disorders, internal browning, and textural changes [3, 4]. Hence, to minimize the deterioration rate, convenient cold storage is needed to avoid the above mentioned and to overcome all its outcomes until it reaches to the customer [5, 6]. Uniform cooling and storage of fresh product is difficult to attain in industrial cooling rooms, due to uneven distribution of the airflow and thermal behavior which affects the product quality, especially during long-term storage [7]. Since preservation of peach fruit quality is mainly determined by temperature, effective measures need
Corresponding Author: Adhiyaman Ilangovan [email protected] Received: 26 November 2019 Accepted: 13 May 2020 Published: 2 June 2020
Publishing services provided by Knowledge E
Adhiyaman Ilangovan et al. This article is distributed under the terms of theCreative Commons Attribution License, which permits unrestricted use and redistribution provided that the original author and source are credited.
Selection and Peer-review under the responsibility of the ICEUBI2019 Conference Committee.
to be adopted to maintain a temperature homogeneity to increase the shelf life of the products. The most commonly used method to control the temperature in cold storage is Forced-Air cooling (FAC) [8]. Refrigerated air from the fans is forced to flow around the packages which intend to produce the pressure difference along with the stack of pallets stored in the chamber. Airflow rate and distribution determines the cooling efficiency and temperature uniformity [9]. Increased airflow reduces the temperature rapidly, but directly increases the required energy. Therefore, packaging systems are required to be carefully evaluated, and the container opening areas must be optimized for achieving a better and improved cooling process at minimal energy cost [10]. Generally, packaging design can be more reliable and efficient by combining both experimental and numerical studies. Numerical studies through Computational Fluid Dynamics (CFD) tend to provide more decisive design with in-depth view of the airflow and thermal behavior inside the chambers [11]. The current work aims to present a CFD model to predict airflow patterns and temperature profiles in ventilated packaging systems during the forced-air cooling of Peaches stored in laboratory chamber.
2. Material and Methods
2.1. Computational methods
Recent advancement in the numerical methods and computational tools are extensively used to analyze and modify the design of the horticulture storage [12]. The fluid flow, heat transfer during the transport and cold storage in the post-harvest of agricultural products are predicted by different mathematical models. The set of governing equations tends to predict mass, momentum and heat transfer by solving numerically the computational fluid dynamics [7]. CFD model discretizes the complete domain into a set of control volumes and solves numerically in the constrained fluid domain. In the current study, the CFD model development and results analysis is performed using the commercial CFD software Ansys V15. The model needs to be discretized into preprocessing, solver and post-processing to perform the computational analysis.
2.2. Geometry set-up
To investigate the airflow and thermal behavior, 3D model of the packaging box with fruits are modeled using the ANSYS design Modeler. The box is modeled with 35 fruits per each box as shown in Figure 1 and 2.
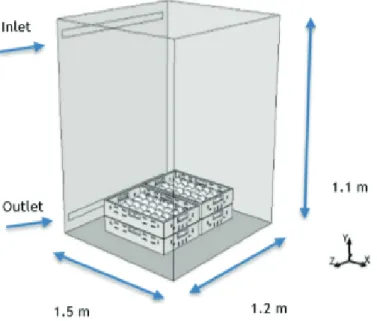
Figure 1: CAD geometry of fruit box and cold chamber - CAD model of packaging box with fruits
Figure 2: CAD geometry of fruit box and cold chamber - CAD model of chamber with four boxes.
Four boxes with 35 peaches at each box are placed inside the cold chamber as shown in the Figure 1. The peach storage box is with a dimension of (0.59 m × 0.40 m × 0.10 m) is modeled with several vent holes and hand hole. For computational approximation, each peach is modelled with a diameter of 70 mm. Initial test case having four boxes with fruits are placed inside the cold chamber as shown in Figure 2. The chamber is completely closed having Inlet and outlet vents at top and bottom respectively. The
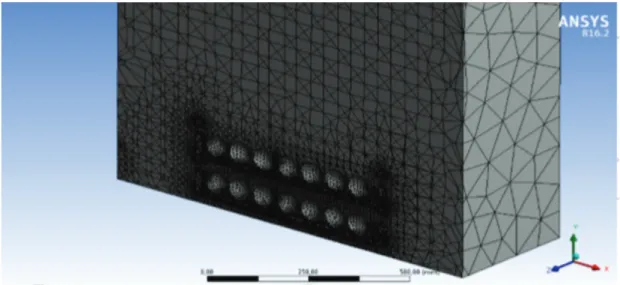
3D model is converted into a finite control volume, to reduce the computational cost. A element with a minimum length of 0.5 mm is used. Unstructured tetra hex mesh generated using Ansys meshing with 3.7 million elements.
Figure 3: Cut section of the computational mesh of cold chamber.
3. Numerical Model and Setup
3.1. Governing equations
The steady flow is solved using Reynold’s-average Navier-Stokes equation.
The Conservation of mass, momentum and energy are exposed in the Equations 1 to 3, respectively.
𝜕𝜌𝑎
𝜕𝑡 + 𝑑𝑖𝑣 (𝜌𝑎𝑈 ) = 0 (1) Conservation of momentum gives
𝜕 (𝜌𝑎𝑢) 𝜕𝑡 +𝑑𝑖𝑣 (𝜌𝑎𝑢𝑈 ) = 𝑑𝑖𝑣 (𝜇𝑎𝑔 𝑟𝑎𝑑 𝑢) − 𝜕𝑝 𝜕𝑥+ ⎡ ⎢ ⎢ ⎣ −𝜕(𝜌𝑎𝑢 ′2) 𝜕𝑥 − 𝜕 (𝜌𝑎𝑢1𝑣1) 𝜕𝑦 − 𝜕 (𝜌𝑎𝑢′𝑤′) 𝜕𝑧 ⎤ ⎥ ⎥ ⎦ +𝑆𝑢 (2a) 𝜕 (𝜌𝑎𝑣) 𝜕𝑡 +𝑑𝑖𝑣 (𝜌𝑎𝑣𝑈 ) = 𝑑𝑖𝑣(𝜇𝑎𝑔𝑟𝑎𝑑𝜈) − 𝜕𝑝 𝜕𝑦+ ⎡ ⎢ ⎢ ⎣ −𝜕 (𝜌𝑎 𝑢′𝑣′ ) 𝜕𝑥 − 𝜕 (𝜌𝑎𝑣 ′2 ) 𝜕𝑦 − 𝜕 (𝜌𝛼𝑣′𝑤′) 𝜕𝑧 ⎤ ⎥ ⎥ ⎦ +𝑆𝜈 (2b)
𝜕 (𝜌𝑎𝑤) 𝜕𝑡 +𝑑𝑖𝑣 (𝜌𝑎𝑤𝑈 ) = 𝑑𝑖𝑣(𝜇𝑎𝑔𝑟𝑎𝑑𝑤) −𝜕𝑝 𝜕𝑧+ ⎡ ⎢ ⎢ ⎣ −𝜕 (𝜌𝑎 𝑢′𝑤′ ) 𝜕𝑥 − 𝜕 (𝜌𝑎𝜈′𝑤 ′2 ) 𝜕𝑦 − 𝜕 (𝜌𝑎𝑤 ′2 ) 𝜕𝑧 ⎤ ⎥ ⎥ ⎦ +𝑆𝑤 (2c) 𝑢′𝑖𝑢′𝐽 = −𝜇𝑡 ( 𝑑𝑢𝑖 𝜕𝑥𝑗+ 𝜕𝑥𝑗 𝜕𝑥𝑗)+ 2 3 (𝜌𝑎𝑘+𝜇𝑡 𝑑𝑢𝑖 𝜕𝑥𝑖)𝛿𝑖𝑗 (3)
3.2. Turbulence model
The accuracy of the CFD analysis mainly depends on the turbulence model used for the simulations. Shear stress transport (SST) 𝑘 − 𝜔 model is used in this study, as most of the previous cold storage applications as presented by [9] and [12] have successfully followed this model to predict the flow behavior.
3.3. Boundary and initial conditions
Spheres representing the Peach fruits and detailed design of the box stored in laboratory cold chamber was modeled. The outer diameter of fruit is considered as walls and this external wall are set with ambient temperature of T = 298 K. In the CFD model, the boundary condition must be defined at each surface on the fluid domain. The boundary conditions used the model are air flow Inlet, air flow Outlet, Wall and Symmetry. The air flow Inlet is set with constant velocity U= 2.1 m/s. Pressure is set at air flow outlet 𝑝𝑜 = 0 Pa. The Inlet air temperature of the refrigerated air is Tin= 278 K.
Turbulence parameter of the Inlet and outlet boundary is determined for the turbulent kinetic energy, 𝑘, as shown in Equation 4.
𝑘 = 3 2(𝑈 𝐼)
2 (4)
Where, 𝑈 - average velocity (𝑚/𝑠) and 𝐼 is the turbulence intensity.
𝐼 = 0.16 Redh−1/8 (5) The specific dissipation rate 𝜔 is given by,
𝜔 = √𝑘 𝑙 (𝑐𝜇)
−14 (6)
The length scale is defined fully developed case and the length scale is defined as 𝐿 = 0.07𝐷ℎ.
The following solution methods are used for the analysis which are widely used by the previous applications [11] in which semi–Implicit (SIMPLE) method is used for the pressure-linked equations. Second order upwind is used for the pressure, momentum and turbulence parameters. After defining the necessary monitors for the post process-ing solution, the solver Is initialized with standard Initialization. Transient analysis of 120 sec with 20 Iterations per time step and specified value of time step are set. The time step is specified at Δt = 0.01 sec. The Simulation took around 22 h to converge, being performed on a Intel® Xeon® CPU@ 3.47 GHz with 96 GB of RAM.
4. Results and Discussion
Cooling rate and uniformity of the boxes were identified by the contour plots and graph obtained from the analysis at the specific point and plane across the box.
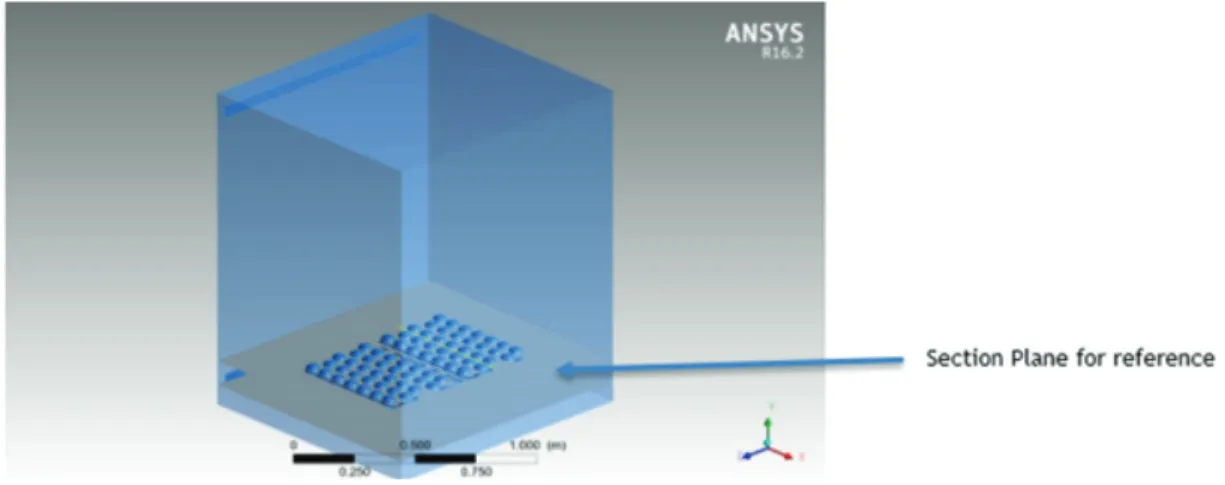
Figure 4: Cold chamber with plane along X-Z plane.
For reference, two section planes are introduced at the different height of y = 0.0645 m (Base plane), and y = 0.179 m (top Plane). This section plane set to evaluate the details of air flow and thermal behavior of the box inside the cold chamber.
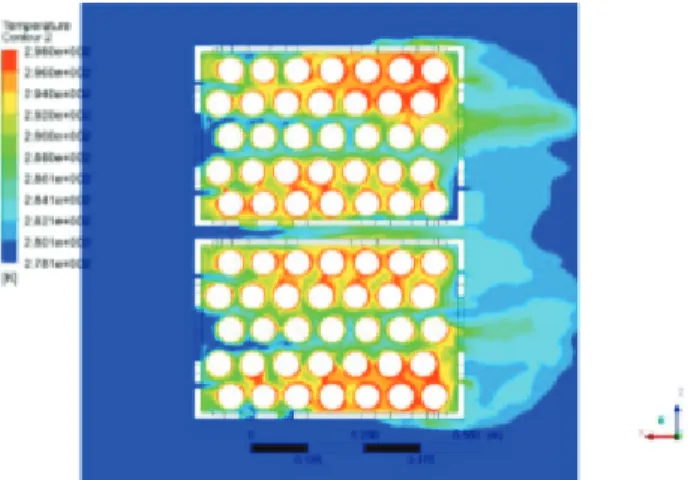
The outcome from the analysis are indicated in Figure 5 and 6. For initial test only four boxes were used and the box at the top is kept open exposed to the free flow region. From the top box section plane at Figure 6. It is predicted a removal of heat relatively high when compared to the box at the bottom. The Increase in temperature at the bottom plane is due to the restriction of airflow due to reduced cold air velocity at the specified regions.
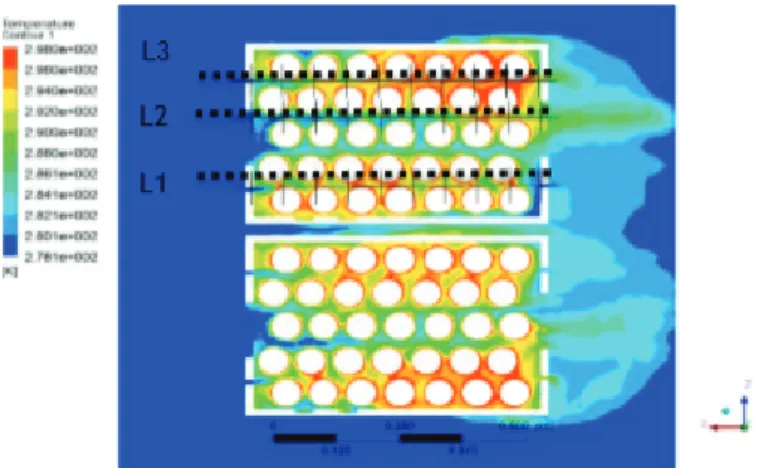
To know more about the temperature distribution inside the box, temperature was measured at three locations (L1, L2, L3) inside the packaging box as shown in the Figure 7 along section plane y = 0.064 m. Comparative representation of the three locations
Figure 5: predictions of air temperature contour planes - Base x-z plane at t = 19 sec.
Figure 6: predictions of air temperature contour planes - Top x-z plane at t = 19 sec.
with respect to temperature is shown in Figure 6. The location L2 near the vent hole has maximum removal of heat inside the box when compared to other two locations L1 and L2. This result indicates the uneven thermal distribution inside the packaging box and the air flow near the vent holes and hand holes are high which in turn reduces the temperature of the fruits placed near the regions of maximum airflow. In order to improve the thermal homogeneity vent holes positions must be optimized to enhance the thermal homogeneity within the box.
5. Conclusions
This work established a 3D transient CFD model to predict the airflow and thermal behavior of the Peaches stored in a packaging box placed inside a laboratory cold chamber using forced air cooling. The airflow pattern and thermal behavior were inves-tigated, and results were gathered. It shows that thermal distribution inside the box
Figure 7: Prediction of air temperature in x-z plane - Temperature Locations at the base x-z plane.
Figure 8: Prediction of air temperature in x-z plane - Temperature variation inside the box along x-z plane.
is heterogeneous and maximum thermal removal is obtained near the vent holes and hand holes when compared to the other regions of the box. The future work aims to develop a box with optimized vent hole configurations with different airflow velocity and temperature. The numerical test results must be evaluated with the experimental work to provide a more effective and efficient output of the cold storage.
Acknowledgments
This study is within the activities of project “Pack2Life – High performance packaging”, project IDT in consortium no° 33792, call no° 03/SI/2017, Ref. POCI-01-0247-FEDER-033792, promoted by COMPETE 2020 and co-funded by FEDER within Portugal 2020.
Nomenclature
P Fluid pressure (𝑁/𝑚2)
R𝑒 Reynolds number T Temperature (𝐾) U Velocity vector (𝑚/𝑠)
𝑘 Turbulence kinetic energy (𝐽 /𝑘𝑔) 𝑘 Turbulent kinetic energy (𝑚2/𝑠2)
𝑢, 𝑣, 𝑤 Air velocity components in the direction of x, y, and z (𝑚/𝑠) 𝑠𝑢, 𝑠𝑣, 𝑠𝑤 Source terms in the direction of x and y (𝑘𝑔/𝑚2/𝑠2) 𝑢𝑖, 𝑢𝑗 Mean velocity components in x, y and z directions (𝑚/𝑠) 𝑢′𝑖𝑢′𝑗 Fluctuating velocity components (𝑚/𝑠)
𝑥𝑖, 𝑥𝑗 Cartesian coordinates (𝑚) 𝛿𝑖𝑗 Kronecker delta 𝜇𝑎Dynamic viscosity (𝑃 𝑎𝑠) 𝜇𝑡Turbulent viscosity (𝑘𝑔/𝑚3) 𝜌𝑎Air density (𝑘𝑔/𝑚3)
References
[1] Wang, X. (2017). Postharvest Quality Monitoring and Variance Analysis of Peach and Nectarine Cold Chain with Multi-Sensors Technology. doi: 10.31219/osf.io/cfr72 [2] Zhang, B., Xi, W.-P., Wei, W.-W., Shen, J.-Y., Ferguson, I., & Chen, K.-S. (2011). Changes
in aroma-related volatiles and gene expression during low temperature storage and subsequent shelf-life of peach fruit. Postharvest Biology and Technology, vol. 60, issue 1, pp. 7–16.
[3] Gang, C., Li, J., Chen, Y., Wang, Y., Li, H., Pan, B., & Odeh, I. (2014). Synergistic Effect of Chemical Treatments on Storage Quality and Chilling Injury of Honey Peaches.
Journal of Food Processing and Preservation, vol. 39, issue 6, pp. 1108–1117.
[4] Rizzolo, A., Bianchi, G., Vanoli, M., et al (2012). Electronic Nose to Detect Volatile Compound Profile and Quality Changes in ‘Spring Belle’ Peach (Prunus persica L.) during Cold Storage in Relation to Fruit Optical Properties Measured by Time Resolved Reflectance Spectroscopy. Journal of Agricultural and Food Chemistry, vol. 61, issue 8, pp. 1671– 1685.
[5] Berry, T. M., Fadiji, T., Defraeye, T., and Opara, U. L. (2017). The role of horticultural carton vent hole design on cooling efficiency and compression strength: A multi-parameter approach. Postharvest Biology and Technology, vol. 124, pp. 62–74. [6] Verboven, P., Flick, D., Nicolaï, B., and Alvarez, G. (2006). Modelling transport
phenomena in refrigerated food bulks, packages and stacks: basics and advances.
International Journal of Refrigeration, vol. 29, issue 6, pp. 985–997.
[7] Nahor, H., Hoang, M., Verboven, P., et al. (2005). CFD model of the airflow, heat and mass transfer in cool stores. International Journal of Refrigeration, vol. 28, issue 3, pp. 368–380.
[8] Dehghannya, J., Ngadi, M., and Vigneault, C. (2010). Mathematical Modeling Procedures for Airflow, Heat and Mass Transfer During Forced Convection Cooling of Produce: A Review. Food Engineering Reviews, vol. 2, issue 4, pp. 227–243. [9] Berry, T. M., Defraeye, T., Nicolaї Bart M., and Opara, U. L. (2016). Multiparameter
Analysis of Cooling Efficiency of Ventilated Fruit Cartons using CFD: Impact of Vent Hole Design and Internal Packaging. Food and Bioprocess Technology, ol. 9, issue 9, pp. 1481–1493.
[10] Tutar, M., Erdogdu, F., and Toka, B. (2009). Computational modeling of airflow patterns and heat transfer prediction through stacked layers products in a vented box during cooling. International Journal of Refrigeration, vol.32, issue 2, pp. 295–306. [11] Han, J.-W., Zhao, C.-J., Qian, J.-P., et al (2018). Numerical modeling of forced-air cooling of palletized apple: Integral evaluation of cooling efficiency. International
Journal of Refrigeration, vol. 89, pp. 131–141.
[12] Ambaw, A., Delele, M., Defraeye, T., et al. (2013). The use of CFD to characterize and design post-harvest storage facilities: Past, present and future. Computers and