Bycatch of crustacean and fish bottom trawl fisheries
from southern Portugal (Algarve)
Maria EsMEralda Costa, KariM Erzini and tErEsa CErvEira BorgEs Centro de Ciências do Mar (CCMar), Universidade do algarve (FCMa), Campus de gambelas, 8005-139, Faro,
Portugal. E-mail: esmeraldacosta@sapo.pt
sUMMarY: as part of two research projects for analysing bycatch and discards, we quantified catch composition, catch rates, bycatch and discards in two important commercial bottom trawl fisheries (crustacean and fish trawls) off the southern coast of Portugal (algarve). stratified sampling by onboard observers took place from February 1999 to March 2001 and data were collected from 165 tows during 52 fishing trips. Commercial target species included crustaceans: blue and red shrimp (Aristeus antennatus), deep-water rose shrimp (Parapenaeus longirostris), norway lobster (Nephrops norvegicus); and fishes: seabreams (Diplodus spp. and Pagellus spp.), horse mackerels (Trachurus spp.) and European hake (Merluccius merluccius). the trawl fisheries are characterised by considerable amounts of bycatch: 59.5% and 80.4% of the overall total catch for crustacean and fish trawlers respectively. a total of 255 species were identified, which belonged to 15 classes of organisms (137 vertebrates, 112 invertebrates and 6 algae). Crustacean trawlers had higher bycatch biodiversity. Bony fish (45.6% and 37.8%) followed by crustaceans (14.6% and 11.5%) were the dominant bycatch components of both crustacean and fish trawlers respectively. the influence of a number of factors (e.g. depth, fishing gear, tow duration and season) on bycatch and discards is discussed.
Keywords: bycatch, trawl fisheries, fish, crustacean, algarve, Portugal.
rEsUMEn: Capturas incidentales de las pesquerías de arrastre de fondo de crustáceos y peces al sur de Por-tugal (Algarve). – se ha cuantificado la composición de las capturas, sus tasas, las capturas incidentales y los descartes de dos pesquerías industriales de arrastre de fondo dirigidas a crustáceos y peces del sur del Portugal (algarve). se realizó un muestreo estratificado mediante observadores a bordo desde febrero de 1999 hasta marzo de 2001, utilizándose los datos recogidos en 52 embarques y 165 lances. las especies objetivos de la pesquería comercial fueron: la gamba roja (Aristeus antennatus), la gamba blanca (Parapennaeus longirostris), la cigala (Nephrops norvegicus), varias especies de espáridos de los géneros Diplodus y Pagellus, jureles (Trachurus spp.) y merluza (Merluccius merluccius). Estas pesquerías de arrastre de fondo se caracterizaron por la presencia de considerables cantidades de capturas incidentales, que variaron entre un 59.5 y
un 80.4% del total de las capturas de crustáceos y peces, respectivamente. se identificaron 255especies pertenecientes a 15
clases de organismos (137 vertebrados, 112 invertebrados y 6 algas). se observó que la mayor biodiversidad se produjo en los arrastreros dirigidos a la captura de crustáceos. El componente dominante de las capturas incidentales en los arrastreros dirigidos a crustáceos y peces fueron los teleósteos (45.6 y 37.8%, respectivamente), seguidos por los crustáceos (14.6 y 11.5%). se discute la influencia de varios factores (i.e. la profundidad, el tipo de aparejo, la duración del lance o la estación del año) en las capturas incidentales y los descartes.
Palabras clave: capturas incidentales, pesquería de arrastre, peces, crustáceos, algarve, Portugal.
issn: 0214-8358 doi: 10.3989/scimar.2008.72n4801
introdUCtion
although concern about bycatch in commercial and recreational fisheries can be found in the sci-entific literature from the mid-1970s, it became the
most critical fisheries issue in the 1990s (e.g. al-verson et al., 1994; Kennelly, 1995; alal-verson and Hughes, 1996; Hall et al., 2000). given the over-fished state of many of the worlds most important stocks (Pauly et al., 2002), there has been great
in-terest in documenting and finding solutions to the economic, political, and ecological implications of bycatch and discarding. the worldwide interest has given rise to a significant number of research papers, reviews and conferences (e.g. saila, 1983; alverson and Hughes, 1996; Fao, 1996; Hall, 1996, 1998; zann, 2000; sánchez et al., 2004; and many others). Furthermore, there is growing international concern for the conservation of bycatch species (nakano et al., 1997). the first global estimate of bycatch was approximately 12 million tonnes (Mt), with 3 to 5 Mt a year for the shrimp trawl fisheries alone (slavin, 1981; saila, 1983). later, alverson et al. (1994) es-timated an annual shrimp trawl bycatch of around 11.2 Mt worldwide and the global annual commer-cial fisheries bycatch was estimated to be an average 28.7 Mt per year (Fao, 1996).
Most marine fisheries are mixed fisheries direct-ed at only a few commercial target species; however, a wide variety of bycatch species are captured along with the target species (Fao, 1996; Castriota et al., 2001). some of these species have economic value and can be retained and commercialised, while oth-ers are discarded overboard for a variety of reasons (saila, 1983; alverson et al., 1994; Borges et al., 2002; stobutzki et al., 2003).
Bycatch may include individuals of target spe-cies smaller than the legal minimum landing size, juveniles of commercial and/or recreational fisher-ies specfisher-ies, or individuals of threatened, endangered or protected species (alverson et al., 1994; Kenelly, 1995; lewison et al., 2004). Bycatch is by and large regarded as unavoidable, and it is not restricted to any particular gear type or any particular region of the world (Hall et al., 2000). However, non-selec-tive fishing gears such as trawls that catch almost everything in their path, are generally considered to have greater bycatch rates than more selective gears such as longlines and purse seines (Fao, 1996). in-deed, the issue of bycatch in bottom trawl fisheries is of particular concern in tropical shrimp fisheries, where the weight of bycatch can be 5 to 10 times greater than the weight of the target species and may account for 8 to 16 Mt per year as a whole (andrew and Pepperell, 1992).
the bycatch of commercial fisheries worldwide is of great concern to fisheries managers and envi-ronmental and conservation groups as it contributes to biological overfishing and to changing the struc-ture of marine communities and/or ecosystems, with serious implications for marine populations and
the overall health and sustainability of ecosystems (alverson et al., 1994; Fao, 1997; rebecca et al., 2004).
the first step towards understanding and solving the bycatch problem is to identify and quantify by-catches (alverson et al., 1994; Kennelly, 1997; Ye et al., 2000; Borges et al., 2002). the most widely used approach for quantifying bycatches in com-mercial fisheries is to have onboard observers record the required data during normal fishing operations (saila, 1983; alverson et al., 1994; Kennelly, 1995; Fao, 1996; liggins et al., 1996).
in Portugal, the “trawling” category includes fleet components that trawl for both crustaceans and fish (C.E.C., 1993a). the most important fraction of the Portuguese commercial trawl landings comes from the algarve, with the crustacean trawl fishery consti-tuting a very important part of the fishing fleet in the region (d.r., 1999; Pita et al., 2001).
the present study is based on two research projects that analyse bycatch and discards and focus on the bottom (decapod crustaceans and fish) trawl fisheries of the southern Portuguese coast. We quan-tify here the composition and catch rates of the target and bycatch species of the fish and crustacean trawl fleets. While previous studies have focused on dis-cards (Borges et al., 1997, 2000, 2001, 2002; Mon-teiro et al., 2001), this is the first study that specifi-cally addresses the issue of bycatches of crustacean and fish trawlers. this research will increase our knowledge of the impacts of trawling on the area and will provide a useful point of departure and baseline for management and conservation and for present and future work in this field.
MatErial and MEtHods
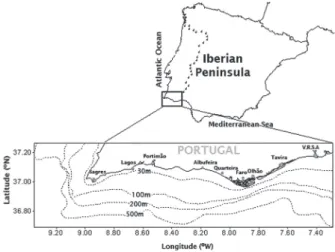
the present study was carried out on commer-cial fishing vessels operating off the southern coast of Portugal (algarve) (Fig. 1) from February 1999 to March 2001, during two projects on fisheries by-catch and discards. sampling was stratified by bot-tom trawl type (crustacean trawlers and fish trawlers) and season (four) per year. given the larger bycatch quantities and diversity of crustacean trawlers, the sampling effort was 4 or 5 fishing trips per season for crustacean trawlers compared to 3 fishing trips per season for fish trawlers. data were collected by onboard observers following the direct collection method, which consists in observers onboard
com-mercial boats asking the skippers to identify the tar-get species at the beginning of each trip.
onboard the trawlers, observers recorded all the information needed to characterise the fishing ves-sel, fishing gears and fishing trips (number and dura-tion of trips and tows), catch quantities (total catch, target catch, retained catch, total bycatch, commer-cial bycatch and discarded bycatch), species compo-sition, and geographical and bathymetric location of the fishing area using onboard electronics. Catch es-timates depended on the amounts caught per tow: if large amounts were caught, the size of the catch was estimated by the skipper of the fishing vessel. in the case of small amounts, the total catch was obtained by summing the weight of each commercial (target and bycatch species) species sorted into baskets by the fishermen. Commercial target species as well as bycatch species were measured onboard, with ce-phalothorax length (mm) and total length (cm) re-corded for crustaceans and fish respectively. all data was collected by individual tow per fishing trip and all tows were conducted in a manner that reflected normal commercial practice.
sampling was concentrated on trawlers based in Portimão and olhão (Fig. 1), which are the two main fishing ports in the algarve. the entire algarve was considered to be a single fishing ground (Borges et al., 2000). data on the technical characteristics of trawl vessels (year of construction, overall length (in meters), gross registered tonnage (grt), and engine power in Horsepower, hp, and Kilowatts, kw) and on the number of trawl licences for 1999, 2000 and 2001, were obtained from official archives.
the crustacean trawl fisheries in the algarve take place on the lower continental shelf and continen-tal slope at depths from 150 m to 800 m, depending on target species (s.E.P., 1984). the most important crustacean trawl target species are the decapod crus-taceans, such as blue and red shrimp (Aristeus anten-natus), deep-water rose shrimp (Parapenaeus longi-rostris), and norway lobster (Nephrops norvegicus). as of 22 november, 2000, the minimum legal mesh size was increased from 55mm to a range of 55 to 59 mm. the total catch of crustacean trawlers that use this mesh size range must consist of a minimum of 30% of target species and a maximum of 30% of bycatch species (fishes and cephalopods) (d.r., 2000).
Fish trawlers operate on the continental shelf and upper continental slope, mainly at depths between 100 and 200 m (Borges et al., 2001; Erzini et al.,
2002), and the most important target species are horse mackerel (Trachurus spp.), European hake (Merluccius merluccius) and sea breams (Diplodus spp. and Pagellus spp.). since 2000, the minimum legal mesh size is in the range from 65 to 69 mm, and a minimum of 70% of the catch must consist of the target species. trawlers using codend mesh sizes greater than 70 mm have no such restrictions regarding target species. However, the crustacean bycatch of fish trawlers must not exceed 20% of the total catch (d.r., 2000). Crustacean and fish trawl-ers constitute two different fleets with vessels that do not switch between fishing methods.
in this paper we use the following terms and definitions: total catch is the quantity of all species brought onboard; target catch is the fraction of the total catch which includes the species towards which the fishing effort is directed (target species); re-tained (or landed) catch is the part of the total catch that has economic value (i.e. the quantity of target and bycatch species that can be marketed); and to-tal bycatch is the portion of the total catch which includes all the species caught accidentally (non-target species). total bycatch may be retained if it has commercial value (commercial bycatch) and/or discarded at sea if it is not used for any purpose (dis-carded bycatch). in order to simplify, “dis(dis-carded by-catch” will be referred to as “discard(s)” throughout this paper. it is also necessary to highlight that both the targeted and non-targeted species may be either marketable or discarded at sea.
the means and respective standard deviations of the different catch compositions were calculated ac-cording to trip and tow. in order to determine if there Fig. 1. – algarve region, showing the main fishing ports in the
Table 1. – Estimates of the total, target and retained catches, bycatch, commercial bycatch and discards, for the number of trips and fishing operations (tows) (* no trips due to fish trawlers strike;
**no trips due to bad weather conditions; m=mean; s.d.=standard deviation).
season Métier Boat t rips t ow Catch (kg) t arget Catch (kg) r etained Catch (kg) (n) (n) (n) t otal m/trip s.d. m/tow s.d. t otal m/trip s.d. m/tow s.d. t otal m/trip s.d. m/tow s.d. Winter 1998 Crustacean trawl 2 4 8 2160 540 88.48 270 101.98 1117 279 54.60 140 105.93 1368 342 58.37 171 118.36 Fish trawl 2 3 19 27957 9319 1274.09 1471 2097.65 2835 945 56.07 149 167.11 7298 2433 36.49 384 333.64 spring 1999 Crustacean trawl 2 4 9 1755 439 52.97 195 72.46 540 135 18.96 60 28.41 1166 291 30.85 130 51.09 Fish trawl* 0 0 0 0 0 0 0 0 0 0 0 0 0 0 0 0 0 0 summer 1999 Crustacean trawl 3 5 10 2330 466 64.48 233 75.58 1057 211 39.11 106 38.29 1332 266 32.68 133 35.48 Fish trawl 3 3 18 8720 2907 85.18 484 435.22 2648 883 61.82 147 103.93 4327 1442 62.32 240 136.28 a utumn 1999 Crustacean trawl 2 3 5 1322 441 209.92 264 203.49 336 112 10.21 67 12.83 370 123 23.82 74 21.39 Fish trawl 3 3 19 8065 2688 101.13 424 341.84 2186 729 19.81 115 141.43 4769 1590 33.73 251 201.99 Winter 1999 Crustacean trawl 3 3 6 1320 440 57.66 220 92.74 682 227 44.33 114 61.30 811 270 59.89 135 71.82 Fish trawl 2 2 10 3540 1770 18.86 354 191.44 970 485 60.99 97 71.15 2059 1030 87.92 206 81.42 spring 2000 Crustacean trawl 3 4 7 1485 371 113.07 212 109.69 559 140 34.82 80 35.45 940 235 95.53 134 78.77 Fish trawl 2 3 12 2970 990 60.09 248 99.01 1347 449 62.23 112 78.80 2109 703 45.84 176 89.04 summer 2000 Crustacean trawl 2 5 9 1115 223 61.02 124 70.70 370 74 18.35 41 19.92 517 103 26.13 57 26.32 Fish trawl 2 3 15 4030 1343 219.95 269 331.90 847 282 28.80 56 58.48 1973 658 69.22 132 88.57 a utumn 2000 Crustacean trawl 2 3 8 700 233 60.24 88 70.46 316 105 20.34 40 28.39 385 128 22.12 48 30.81 Fish trawl** 0 0 0 0 0 0 0 0 0 0 0 0 0 0 0 0 0 0 Winter 2000 Crustacean trawl 1 4 10 2800 700 55.28 280 58.69 1100 275 30.43 110 29.44 1141 285 28.80 114 29.15 Fish trawl** 0 0 0 0 0 0 0 0 0 0 0 0 0 0 0 0 0 0 t otal Crustacean trawl 20 35 72 14987 428 100.47 208 83.01 6077 174 43.73 84 55.97 8029 229 57.30 112 67.49 Fish trawl 14 17 93 55282 3252 708.50 594 1064.04 10833 637 55.06 116 118.84 22535 1326 101.41 242 207.80 season Métier Boat t rips t ow Bycatch (kg) Commercial Bycatch (kg) d iscards (kg) Commercial (n) (n) (n) t otal m/trip s.d. m/tow s.d. t otal m/trip s.d. m/tow s.d. t otal m/trip s.d. m/tow s.d. bycatch (%) Winter 1998 Crustacean trawl 2 4 8 1043 261 62.37 130 55.29 251 63 11.38 31 17.76 792 198 56.59 99 56.49 18.3 Fish trawl 2 3 19 25122 8374 1262.60 1322 2047.60 4463 1488 47.77 235 277.93 20659 6886 1299.93 1087 2040.90 61.2 spring 1999 Crustacean trawl 2 4 9 1216 304 37.39 135 47.54 627 157 18.02 70 29.01 590 147 31.07 66 34.09 53.7 Fish trawl* 0 0 0 0 0 0 0 0 0 0 0 0 0 0 0 0 0 0 0 summer 1999 Crustacean trawl 3 5 10 1273 255 61.54 127 75.40 275 55 13.28 28 21.48 998 200 55.57 100 69.26 20.6 Fish trawl 3 3 18 6072 2024 146.13 337 427.81 1679 560 52.30 93 74.46 4393 1464 140.02 244 396.05 38.8 a utumn 1999 Crustacean trawl 2 3 5 986 329 212.00 197 203.82 34 11 14.00 7 11.01 952 317 220.16 190 209.67 9.2 Fish trawl 3 3 19 5879 1960 86.93 309 276.22 2583 861 50.11 136 93.70 3296 1099 110.48 173 256.80 54.2 Winter 1999 Crustacean trawl 3 3 6 638 213 27.49 106 40.02 129 43 15.60 22 16.22 509 170 29.31 85 40.03 15.9 Fish trawl 2 2 10 2570 1285 42.13 257 179.99 1089 545 26.93 109 42.62 1481 741 69.06 148 197.88 52.9 spring 2000 Crustacean trawl 3 4 7 926 232 88.28 132 85.25 381 95 77.99 54 60.44 546 136 57.96 78 65.81 40.5 Fish trawl 2 3 12 1623 541 6.92 135 63.89 688 229 16.34 57 31.48 935 312 28.25 78 69.74 33.8 summer 2000 Crustacean trawl 2 5 9 745 149 54.51 83 60.92 147 29 9.39 16 9.89 598 120 48.33 66 53.93 28.4 Fish trawl 2 3 15 3184 1061 192.98 212 281.81 1127 376 40.99 75 53.17 2057 686 162.04 137 269.27 57.1 a utumn 2000 Crustacean trawl 2 3 8 384 128 40.14 48 43.11 69 23 2.71 9 4.45 315 105 38.97 39 42.15 17.9 Fish trawl** 0 0 0 0 0 0 0 0 0 0 0 0 0 0 0 0 0 0 0 Winter 2000 Crustacean trawl 1 4 10 1700 425 31.91 170 52.49 41 10 1.81 4 2.33 1659 415 32.96 166 52.50 3.6 Fish trawl** 0 0 0 0 0 0 0 0 0 0 0 0 0 0 0 0 0 0 0 t otal Crustacean trawl 20 35 72 8911 255 78.91 124 83.01 1941 55 34.92 27 31.54 6958 199 77.69 97 82.54 24.2 Fish trawl 14 17 93 44450 2615 685.76 478 1028.27 11653 685 70.55 125 148.85 32747 1926 652.35 352 996.40 51.8
are significant differences in the target, total bycatch, commercial bycatch and discard catches between seasons in each trawl type, non-parametric tests that employ the ranks of the measurements instead of using the actual (raw) data, had to be applied since sample sizes were different between the seasons in each year. the two-sample Mann-Whitney test (U) (zar, 1996), that is analogous to the two-sample t-test, was applied to spring, summer and autumn in the case of crustacean trawls and to all seasons in the case of fish trawls. For testing differences among groups where k (samples) > 2, non-parametric anal-yses of variance were applied by the means of the Kruskal-Wallis test (H), often known as “analysis of variance by ranks” (zar, 1996).
species diversity for target, bycatch and discard species was calculated in relation to bottom trawl type. size frequency distributions of the target spe-cies of the two types of trawl, as well as of the most important bycatch species captured by fish trawls for which there is legislation concerning legal minimum landing size (lMls), were prepared. legal mini-mum landing sizes for each species are reported fol-lowing the Portuguese legislation published in the d.r. (2001).
rEsUlts
observers sampled 9 different trawlers of the 27 to 37 that were licensed in the algarve from 1999 to 2001. six crustacean trawlers were sampled, rang-ing in age from 7 to 44 years (mean=19.8) with total lengths ranging from 23 to 30 m (mean=25.8 m). the mean grt was 144.9 ton (s.d.=29.26) and mean engine power was 441.3 kw (s.d.=80.63). the three fish trawlers that were sampled were older (mean=33.67 years) and slightly larger (mean=30.7 m) than crustacean trawlers. the mean grt was 172.1 ton (s.d.=2.22) and their engine power mean was somewhat greater, with a mean of 504.7 kw (s.d.=72.17kw).
Crustacean trawlers fished at depths from 117 to 754 m (mean= 463.3 m; s.d.=150.0). trip duration varied from 45.8 to 94.1 hours (mean=69.5 hours; s.d.= 16.876) and tow duration ranged from 2.25 to 10.22 hours (mean=5.78 h; s.d.=1.89). Fish trawlers normally fished at depths between 100 and 290 me-ters, but some hauls were as shallow as 41 m (mean= 105.3 m; s.d.=43.95). Fish trawler trip duration var-ied from 27.5 to 49 hours (mean=43.4 h; s.d.= 7.944)
and tow duration ranged from 22.2 minutes to 2.85 hours (mean=1.45 h; s.d.=0.48).
the sampling effort, the quantities caught and re-tained and the target and bycatch catches according to year and season are shown in table 1. a total of 52 fishing trips were made (35 in crustacean trawl-ers and 17 in fish trawltrawl-ers), during which 72 crus-tacean trawl tows and 93 fish trawl tows were sam-pled, which totalled 165 fishing operations. there were less crustacean trawl fishing operations, with a maximum of 3 tows per trip (mean=2.06, s.d.=0.34) and 5 to 10 tows per season (mean=8.00, s.d.=1.73), compared with fish trawls that had a maximum of 8 tows per trip (mean=5.47, s.d.=0.93) and 10 to 19 tows per season (mean=15.50, s.d.=3.83).
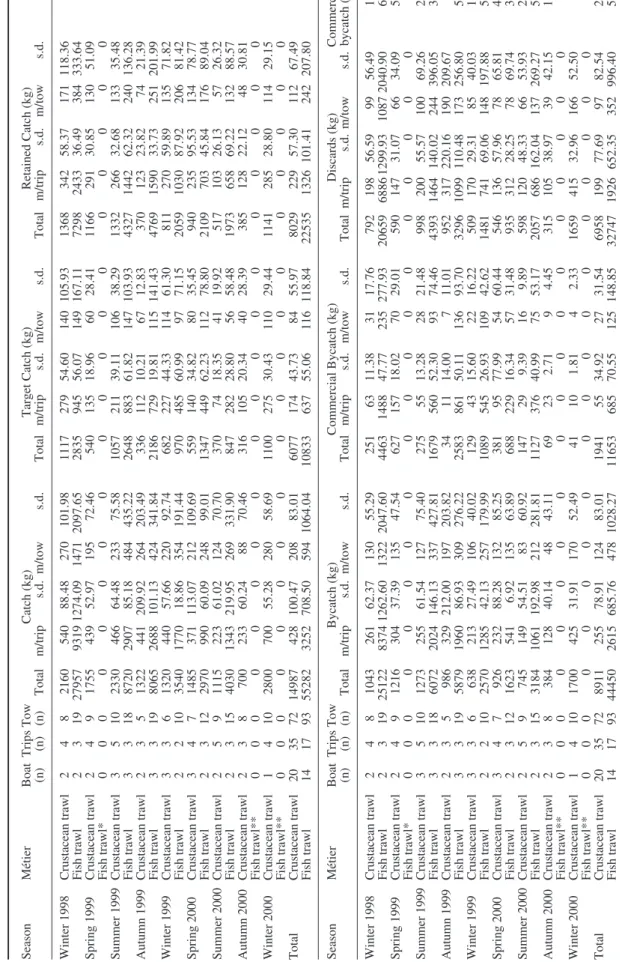
From the overall catch composition shown in Fig-ure 2, it can be seen that total bycatch exceeded tar-get catch in both types of bottom trawl, even though it is much higher in fish (80.4% in kg) than in crusta-cean (59.5% in kg) trawls. Crustacrusta-cean trawls capture larger amounts of the target species (over 40% in kg) than fish trawls (less than 20% in kg), while quan-tities of both commercial bycatch and discards are quite similar in the two types of bottom trawls.
during the study period, of the 3 crustacean trawl target species, deep-water rose shrimp accounted for the largest percentage (49.2% in kg) of the target catch, followed by blue and red shrimp (30.1% in kg). norway lobster accounted for only 20.7% of the target catch in kg (table 2). there are 14 crustacean trawl commercial bycatch species. We consider 9 of these to be the major bycatch species as they each
ac-Fig. 2. – overall catch composition of the crustacean trawl and fish trawl.
counted for at least 5% of the bycatch (table 2). Car-tilaginous fishes accounted for the largest percentage in kg (21.5%) and blue whiting were the next most important commercial bycatch species (14.5%).
For the fish trawl, horse mackerel accounted for the highest percentage in kg (76%) of the tar-get catch followed by European hake (11.6%) and seabreams (9.2%, for Pagellus spp. and 3.3% for Diplodus spp.) (table 3). Fish trawl commercial by-catch species consisted of 27 species, of which 6 are considered to be the major bycatch species, as they each accounted for at least 5% of the bycatch in kg (table 3). the most important fish trawl commercial bycatch species were chub mackerel (19.2% in kg) and European pilchard (18.8% in kg).
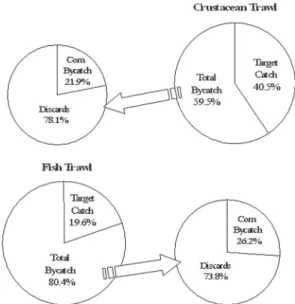
in crustacean trawls (Fig. 3) the target catches ac-count, in kg, for approximately 30 to 40% in spring and autumn and 40 to 46% in summer and winter of the total catch. the target catches were largest in winter (46%) and smallest in autumn (32%). total bycatch follows the same trends, with approximately 50% in winter and summer and 60 to 68% in spring and autumn, with a minimum of almost 54% in winter and maximum of almost 68% in autumn. the lowest values of commercial bycatch are found in autumn (7.5%) and winter (12.5%), and reach a maximum in spring (47%) but decrease to 20.9% in summer. there were more discards in crustacean trawls in autumn and winter (92.5% and 87.5% respectively)
and less in summer, although discards still had rela-tively high values (79.1%). only in spring did the amount of discards decrease, reaching a value of a little over 50%.
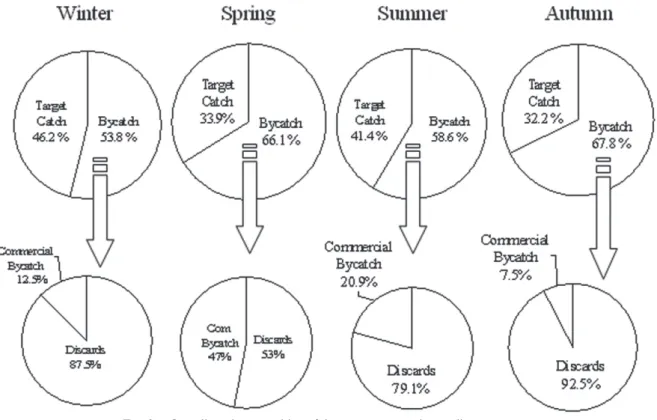
in all seasons, fish trawl total bycatch is greater than the target catch, especially in winter when it comprises almost 90% of the total catch (Fig. 4). in summer and autumn, both target catch and total by-catch are very similar, approximately 27% and 72% respectively. in spring the target catch reached its highest value (45.4%) which, in turn, decreased the total bycatch (54.6%).
Quantities of commercial bycatch (42% and 43.9%) and discards (58% and 56.1%) were quite similar in spring and autumn respectively. discards were higher in winter (80%) and in summer (70%) and consequently lower in commercial bycatch (20% and 30.3% respectively).
Table 2. – target and commercial bycatch species caught by crus-tacean trawl off southern Portugal from 1999 to 2001(per tow)
(s.d.=standard deviation).
group / species Common name Mean weight
(kg) (s.d.) (%) target:
Parapenaeus longirostris deep-water rose shrimp 60.7 57.59 49.2 Aristeus antennatus Blue and red shrimp 37.2 32.72 30.1 Nephrops norvegicus norway lobster 25.5 32.13 20.7
total 100.0
Commercial Bycatch:
Chondrichthyes Cartilaginous fish 14.3 13.65 21.5
Micromesistius poutassou Blue whiting 9.7 3.21 14.5
diverse 6.9 6.08 10.3
Lophius spp. angler 6.1 7.65 9.2
Merluccius merluccius European hake 5.7 4.22 8.6
Phycis spp. Forkbeard 4.5 2.87 6.7
Lepidopus caudatus silver scabbardfish 4.0 - 6.0 Conger conger European conger 3.6 1.89 5.4
Cephalopoda Cephalopodes 3.5 2.70 5.2
Maja squinado spiny spider crab 2.0 - 3.0 Trachurus spp. Horse mackerel 2.0 - 3.0
Pagellus spp. seabream 2.0 1.41 3.0
Mullus spp. red mullet 1.8 1.66 2.6
Helicolenus dactylopterus Blackbelly rosefish 0.8 0.35 1.1
total 100.0
Table 3. – target and commercial bycatch species caught by fish trawl off southern Portugal from 1999 to 2001(per tow)
(s.d.=standard deviation).
group / species Common name Mean weight
(kg) (s.d.) (%) target:
Trachurus picturatus Blue jack mackerel 142.5 143.96 30.2 Trachurus trachurus atlantic horse mackerel 132.3 96.49 28.0 Trachurus spp. Horse mackerel 84.0 106.25 17.8 Merluccius merluccius European hake 54.6 54.58 11.6 Pagellus spp. seabream 28.4 31.50 6.0 Pagellus acarne axillary seabream 15.0 - 3.2 Diplodus spp. seabream 10.3 10.94 2.2 Diplodus vulgaris Common two-banded seabream 5.0 - 1.1
total 100.0
Commercial Bycatch:
Scomber japonicus Chub mackerel 96.9 176.52 19.2 Sardina pilchardus European pilchard 94.6 98.65 18.7 Scyliorhinus canicula small-spotted catshark 50.0 - 9.9 Parapenaeus longirostris deep-water rose shrimp 35.9 36.14 7.1 Scomber scombrus atlantic mackerel 34.4 38.83 6.8
Boops boops Bogue 23.5 25.61 4.6
Chondrichthyes Cartilaginous fish 19.7 16.75 3.9
Cephalopoda Cephalopodes 19.2 12.02 3.8
triglidae gurnard 14.8 3.02 2.9
Pagrus spp. seabream 14.2 5.08 2.8
diverse 13.7 11.20 2.7
Pagrus pagrus Common seabream 10.0 - 2.0
Sarpa salpa salema 10.0 - 2.0
Xiphias gladius swordfish 10.0 - 2.0
Octopus vulgaris Common octopus 9.8 8.04 1.9 Spondyliosoma cantharus Black seabream 8.4 5.03 1.7
Serranus cabrilla Comber 8.0 - 1.6
Zeus faber John dory 7.8 10.25 1.5
Conger conger European conger 5.0 - 1.0
Mullus spp. red mullet 4.8 3.78 0.9
Pleuronectes platessa European plaice 4.0 - 0.8 Helicolenus dactylopterus Blackbelly rosefish 4.0 - 0.8
Solea spp. sole 2.0 1.41 0.4
Lophius spp. angler 2.0 - 0.4
Trisopterus luscus Pouting 1.5 - 0.3
Mullus surmuletus stripe red mullet 1.0 - 0.2
Phycis spp. Forkbeard 1.0 - 0.2
Mann-Whitney tests applied to data from both types of bottom trawls showed significant differ-ences at a significance level (α) of 0.05 only for the
target catch in summer. no significant differences were found for the rest of the seasons and the rest of the catch components. the Kruskal-Wallis test ap-Fig. 3. – overall catch composition of the crustacean trawl according to season.
plied to crustacean trawl catches also showed that in winter there are no significant differences in the overall catch compositions.
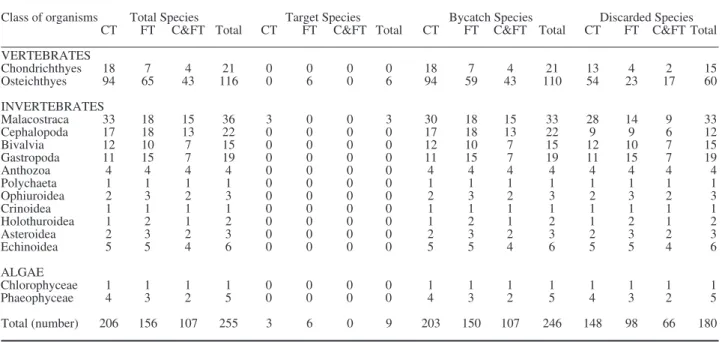
of the total number of species (n=255) iden-tified during the present study, 137 (53.7%) are fish, 36 (14.1%) are crustaceans, 56 (22%) are molluscs and 26 (10.2%) are invertebrate spe-cies from nine different taxonomic groups (table 4). of the total species caught, 80.8% came from crustacean trawlers and 61.2% from fish trawlers, with 42% common to both trawl types. target spe-cies represent a small portion of the total number of species (3.5%), 3.8% and 1.5% respectively for fish and crustacean trawlers. the vast majority of the species are in fact bycatch species: 98.5% for crustacean trawlers, 96.2% for fish trawlers and 96.5% overall for the two types of trawlers. this means that only 27.1% (n=55) and 34.7% (n=52) of bycatch species captured respectively by crus-tacean and fish trawls have commercial value, and the rest are discarded.
Bottom trawl catches off southern Portugal ap-pear to be very diverse (Fig. 5). osteichthyes stands out as the dominant group of bycatch species, as it represents almost 46% and slightly less than 38% of crustacean and fish trawl catches respectively.
size distributions of the target species caught by the two types of bottom trawlers are presented in Figures 6 to 10. legal minimum landing sizes (lMls) according to Portuguese legislation are
rep-Table 4 – species composition, in number, of the bottom trawl catches off southern Portugal from1999 to 2001. Ct, crustacean trawl; Ft, fish trawl; C&Ft, coincident in both trawls.
Class of organisms total species target species Bycatch species discarded species
Ct Ft C&Ft total Ct Ft C&Ft total Ct Ft C&Ft total Ct Ft C&Ft total
vErtEBratEs Chondrichthyes 18 7 4 21 0 0 0 0 18 7 4 21 13 4 2 15 osteichthyes 94 65 43 116 0 6 0 6 94 59 43 110 54 23 17 60 invErtEBratEs Malacostraca 33 18 15 36 3 0 0 3 30 18 15 33 28 14 9 33 Cephalopoda 17 18 13 22 0 0 0 0 17 18 13 22 9 9 6 12 Bivalvia 12 10 7 15 0 0 0 0 12 10 7 15 12 10 7 15 gastropoda 11 15 7 19 0 0 0 0 11 15 7 19 11 15 7 19 anthozoa 4 4 4 4 0 0 0 0 4 4 4 4 4 4 4 4 Polychaeta 1 1 1 1 0 0 0 0 1 1 1 1 1 1 1 1 ophiuroidea 2 3 2 3 0 0 0 0 2 3 2 3 2 3 2 3 Crinoidea 1 1 1 1 0 0 0 0 1 1 1 1 1 1 1 1 Holothuroidea 1 2 1 2 0 0 0 0 1 2 1 2 1 2 1 2 asteroidea 2 3 2 3 0 0 0 0 2 3 2 3 2 3 2 3 Echinoidea 5 5 4 6 0 0 0 0 5 5 4 6 5 5 4 6 algaE Chlorophyceae 1 1 1 1 0 0 0 0 1 1 1 1 1 1 1 1 Phaeophyceae 4 3 2 5 0 0 0 0 4 3 2 5 4 3 2 5 total (number) 206 156 107 255 3 6 0 9 203 150 107 246 148 98 66 180
Fig. 5. – Contribution of each class of organisms to the biodiversity of the total, target and bycatch catches in the two types of trawlers. Each bar represents the percentage of the species in that class in
resented by a dotted line and individuals under the lMls were all discarded, mainly due to their small (illegal) size and/or their poor quality.
size distributions of the three crustacean target species are represented in Figure 6. the majority of blue and red shrimp (92.3%) and deep-water rose shrimp (88.6%) were over the lMls. all norway lobster specimens sampled were greater than the lMls legislated for this species.
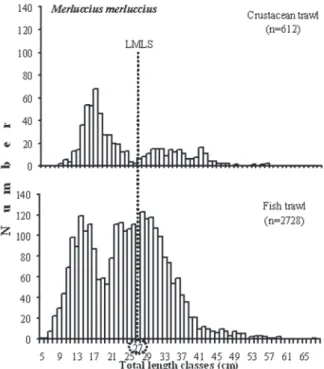
Most of the horse mackerel individuals (96.8%) were above the lMls in both types of trawl (96.4% in crustacean trawl and 96.8% in fish trawl) (Fig. 7). For European hake 68.1% and 57.7% of the individ-uals caught in crustacean and fish trawls respectively were smaller than the lMls (Fig. 8). only 40.4% were large enough to be landed.
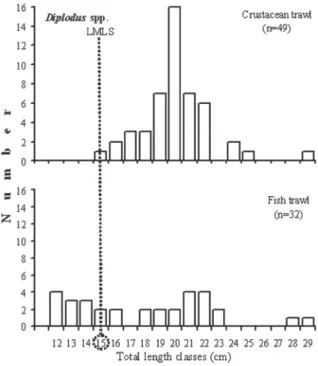
Figure 9 shows the size composition of the sea-bream Pagellus spp., which is quite similar to that of the European hake, i.e., in the two types of bot-tom trawls only a few fish (19.3%) were greater than the lMls of 18 cm (26.7% in crustacean trawls and Fig. 6. – length frequency distribution of the crustacean trawl target
species (lMls=legal Minimum landing size).
Fig. 7. – length frequency distribution of the fish trawl target spe-cies Trachurus spp. (Horse mackerel) (lMls=legal Minimum
landing size).
Fig. 8. – length frequency distribution of the fish trawl target spe-cies Merluccius merluccius (European hake) (lMls=legal
18.9% in fish trawls) and were landed. For seabreams of the Diplodus genus caught both by fish and crus-tacean trawls the majority were of legal size, with 87.7% of the specimens greater than the lMls.
the two most important bycatch species captured by fish trawls and for which a lMls is applicable, are the horse mackerel species (Scomber japonicus
and Scomber scombrus, grouped together as Scomber spp.) and the European pilchard, Sardina pilchardus. these species where chosen because their mean catch and mean catch rates were the highest (94.6 and 58.7 kg; 85.1 and 46.6 Kg/h respectively) of the commer-cialised bycatch species, and were in fact between those of the two most important fish trawl target spe-cies, the horse mackerel and European hake.
length data and the respective lMls for horse mackerel and European pilchard bycatch species are presented in Figures 11 and 12 respectively. almost every horse mackerel specimen sampled (98.7%) was greater than the 20 cm lMls. those captured by crustacean trawls were all above the lMls. all European pilchard specimens sampled were caught by fish trawlers and were greater than the lMls. Fig. 9. – length frequency distribution of the fish trawl target
spe-cies Pagellus spp. (seabream) (lMls=legal Minimum landing size).
Fig. 10. – length frequency distribution of the fish trawl target spe-cies Diplodus spp. (seabream) (lMls=legal Minimum landing
size).
Fig. 11. – length frequency distribution of the fish trawl target spe-cies Scomber spp. (Mackerel) (lMls=legal Minimum landing
size).
Fig. 12. – length frequency distribution of the fish trawl target spe-cies Sardina pilchardus (European pilchard) (lMls=legal
disCUssion
Commercial bottom trawling (crustacean and fish trawls) is a very important activity in southern Portuguese waters, with approximately a third of the Portuguese trawl fleet based in the algarve (d.r., 1999). Bottom trawling off the southern coast of Portugal generates significant amounts of bycatch, with the great majority (80.4% for fish trawlers and 60% for crustacean trawlers) of the total catch cap-tured accidentally (total bycatch). Part of the total bycatch includes non-target species of high com-mercial value, but a considerable portion consists of non-marketable target species, represented by undersized or poor quality specimens, and bycatch species with low or no commercial value that are discarded at sea in relatively similar proportions in both trawl types (over 70%) (Monteiro et al., 2001). the other fraction of the total catch is made up of target species, and is clearly higher in deca-pod crustacean trawls (40.5% compared to 20% in fish trawls).
similar values of bycatch (about 80%) of the to-tal catch were reported for the commercial bottom trawl fishery in the nearby western Mediterranean between 1995 and 1999 (sartor et al., 2003). the remaining fraction was also composed of target spe-cies, which represented a portion between 20% and 46% in all seasons. in contrast to our study, a signifi-cant portion of the bycatch consisted of commercial species, with higher values in summer.
Catch composition varies considerably according to a number of factors, including the nature of the fishery stock fished, the type of fishing gear used, gear selectivity, tow duration, target species and their price value, depth of capture, and the time of year (oliver, 1993; larson et al., 1996; Merella et al., 1998; recasens et al., 1998; garcía-rodriguez and Esteban, 1999; rochet et al., 2002). the rela-tively non-selective nature of trawl nets in itself re-sults in substantial quantities of bycatch (Monteiro et al., 2001). in this study, only the summer target catches of both types of trawl differed significantly from those of the other seasons. this could be due to the fact that fishing effort was comparatively higher than during the other seasons, which leads to greater variability in the catches. recasens et al. (1998) and garcía-rodriguez and Esteban (1999), reported that when there are temporal variations in the catches it is important to consider the fluctuations in abundance and size range of the species studied.
Fishing trip duration is one of the most important factors influencing the proportion of the fish bycatch that is commercialised, and the quantity of bycatch landed is inversely related to trip duration (Clucas, 1997). Considering that fish trawler trip duration is significantly shorter (mean=43.4 h) than that of crus-tacean trawlers (mean=69.5 h), the higher values of commercial bycatch are understandable.
sbrana et al. (2003) considers the variation in tow duration to be the main factor responsible for the seasonal variations in catches of the target spe-cies A. antennatus and P. longirostris in the western Mediterranean. according to Merella et al. (1998), tow duration is greatest when the yields are highest or when market prices reach their maximum values. this was observed for the target species N. norvegi-cus (Merella et al., 1998), and for A. antennatus and M. merluccius (oliver, 1993) for Mediterranean wa-ters. in our study, an inverse relationship between tow duration and target species catch rates in most cases compounds the non-selectivity of the trawl nets, which leads to more bycatch being captured as well as more undersized individuals of the most valuable species. seasonal variations in tow duration could be attributed to different species being targeted during certain periods as well as catches being made at different times.
great diversity in bycatch species composition is a common phenomenon in trawl fisheries (saila, 1983; andrew and Pepperell, 1992 in Ye et al., 2000; stergiou et al., 2003). this was also the case in this study, with a total of 255 species recorded, 246 (96.5%) of which contributed to the total bycatch. the differences between the two types of trawlers can be explained by the fact that crustacean trawl-ers exploit greater depths that are richer in terms of biodiversity. in addition, longer crustacean trawl tow duration may decrease the size selectivity of the trawl net as the catch accumulates in the codend (Murawski, 1996), thereby increasing the number of species and consequently the bycatch.
the dominant bycatch species captured by both types of trawlers, belong to the class osteichthyes followed by molluscs (mainly cephalopods) and crustaceans. this is in agreement with the findings of Monteiro et al. (2001), also for algarve coastal wa-ters and in the Mediterranean (sartor et al., 2003).
of the crustacean trawl target species, the largest catches are of the deep-water rose shrimp (P. longi-rostris) followed by blue and red shrimp (A. antenna-tus). the deep-water rose shrimp prefers sandy and/or
muddy bottoms between 150 and 550 m, while Aris-teus antennatus (blue and red shrimp) is more com-mon in muddy grounds beyond 500 m and extend-ing to 750 m (Cascalho, 1995; C.E.C., 1993b). the third target species, Nephrops norvegicus (norway lobster), which has an irregular distribution between 170 and 700 m (ribeiro-Cascalho and arrobas, 1987; Cascalho, 1995) and is limited primarily by bottom topography and sediment type due to its burrowing behaviour (de Figueiredo and viriato, 1992), repre-sented only 20.7% of the target catches in the trawls that took place at an average depth of 463 m. due to the low power of their engines, crustacean trawlers do not often fish at the depths where this species is most abundant (C.E.C. 1993b).
in the demersal fish trawl fishery, horse macker-els (Trachurus spp.) followed by European hake (M. merluccius) were the main target species with the highest mean catches (76% and 11.6% respective-ly). Figueiredo et al. (1994) also reported European hake as a commercial bycatch species in the crusta-cean trawl fishery, which accounted for 8.6% of the catch in mean weight. Higher values are referred to by Castriota et al. (2001) who found that European hake accounted for 28% for the commercial bycatch in the central Mediterranean and also by Monteiro et al. (2001), who reported that the European hake was the most landed bycatch species (91% of occur-rence), with horse mackerel contributing only 3% to the commercial bycatch. the most important com-mercial bycatch species caught by fish trawls are Scomber japonicus and Sardina pilchardus. Wheth-er these species are marketed or not depends on the total amount caught and on the prices at auction.
other groups of organisms taken as bycatch can also have some commercial value in fish markets, as is the case of the Chondrichthyes and cephalo-pods. Chondrichthyes are important only as bycatch and marketable fresh only at large sizes and/or if the fish quota established for the crustacean trawlers al-lows them to be commercialised. in this study, this group is the dominant component of commercial bycatches in crustacean trawlers, and is composed of 18 species that represent 21.5% in mean weight, which is even greater than that of the target species A. antennatus (13%). in fish trawlers, it is the third most important commercial bycatch group, and rep-resents 13.8% in mean weight (7 species caught), of which 9.9% alone is the species Scyliorhinus can-icula. some species of cephalopods have high com-mercial value while others can be comcom-mercialised
but only if they are caught in significant quantities. like cartilaginous fishes, the commercial bycatch group of cephalopods is more representative in crus-tacean trawlers (17 species caught and 5.2% in mean weight) than in fish trawlers (18 species caught and 3.8% in mean weight).
the existence of legal minimum landing sizes (lMls) for most exploited species leads to propor-tions of both target and/or commercial bycatch spe-cies being discarded. our results show that this is more significant for fish trawl catches. the clearest cases occur with the European hake and seabreams of the genus Pagellus spp. Moranta et al. (2000) sug-gests that this situation could be due, in part, to poor size selectivity in the codend for these species, with potentially important implications in terms of juve-nile mortality.
in addition to the lMls, there are other regu-lations for conserving fisheries and/or reducing the bycatch in Portugal. these include minimum legal mesh sizes for crustacean and fish trawl nets of 55 to 59 mm and 65 to 69 mm and/or≥70 mm respective-ly, minimum catch percentages of legal-sized target species of 30% for crustacean trawlers and 70% for fish trawlers, and maximum catch percentages of bycatch species of 30% for crustacean trawlers and 20% for fish trawlers. in this study, the quantities traditionally kept and distributed by fishermen for personal consumption were not taken into account, which probably justifies the higher percentages shown on some occasions.
other alternatives for reducing bycatch of bot-tom trawls include research on the development and evaluation of the performance of more selec-tive gear and fishing practices to permit juveniles to escape and to maximise the catch of target species. research into reducing bycatch has been carried out in Portuguese waters since the 1990s. Experi-ments using square-mesh codend windows (Fonse-ca et al., 1998; Campos et al., 2002, 2003; Campos and Fonseca, 2004), diamond mesh codends (Cam-pos et al., 2002, 2003), separator panels (Cam(Cam-pos and Fonseca, 2004), and modified nordmøre grids (Fonseca et al., 2005a,b) were, and still are, being carried out. these studies have demonstrated the varying effectiveness of such sorting devices in reducing the amount of bycatch(and discards) in trawl fisheries, and in allowing a high percentage of undersized specimens and non-commercial by-catch species to escape. However, the use of these devices has not been adopted by commercial
fisher-men due to the loss of part of the target catch and commercial bycatch species and the cost of imple-menting and operating such devices.
Knowing that the deep-sea fauna is quite diverse in the algarve (Borges, 2007), and given the results of this particular study, it can be concluded that by-catch has important economic and ecological impli-cations in this region. removal of bycatch species by trawling can have a significant impact on marine trophic chains through predator-prey relationships and consequently on the whole ecosystem. this may be one of the reasons for the decrease in target spe-cies as well as overfishing.
Considering that both identification and quanti-fication of bycatches are valuable pre-requisites for understanding the lesser known impacts of fishing and solving the problems, more attention should be paid to the bycatch issue in southern Portuguese wa-ters. Efforts should be made to obtain information on the variables that influence the spatial and temporal distribution of bycatch, as well as on the biology of the species, including distribution, growth param-eters, reproduction and feeding habits. this is essen-tial for effectively managing this problem, as well as maintaining biodiversity and ecologic stability.
this study highlights the need for new and im-proved measures for mitigating the bycatch problem in Portuguese trawl fisheries. although various by-catch reducing devices (Brds) have been tested in Portuguese waters and size selectivity of both tar-get and bycatch species has been studied (Campos et al. 2002, 2003; Campos and Fonseca 2003, 2004; Fonseca et al., 1998, 2005a,b), there has been lit-tle progress in terms of practical applications in the fishery. indeed, as emphasised by rawson (1997), the management of fisheries bycatch should consider all approaches for finding solutions that stabilise fish populations and the ecosystem consequences, while taking into account the human requirements for the marine resources.
aCKnoWlEdgEMEnts
this research was funded in part by the Euro-pean Union (dg Xiv): “analysis of Fisheries dis-cards from the south coast of Portugal (disCalg)” study project no. 97/0087 and “Managing By-Catch and discards: a Multidisciplinary approach (BYdisCard)” study project no. 99/058. this study was also supported by Fundação para a
Ciên-cia e a tecnologia by a Phd grant (PraXis XXi: Bd/18116/98).
rEFErEnCEs
alverson, d.l., M.H. Freeberg, s.a. Murawski and J.g. Pope. – 1994. a global assessment of fisheries bycatch and discards. FAO Fish. Tech. Pap., rome, italy, 339: 233 p.
alverson, d.l. and s.E. Hughes. – 1996. Bycatch: from emotion to effective natural resource management. Rev. Fish Biol. Fish., 6(4): 443-462.
andrew, n.l. and J.g. Pepperell. – 1992. the bycatch of shrimp trawl fisheries. Oceanogr. Mar. Biol. Annu. Rev., 30: 527-565. Borges, t.C. (ed.). – 2007. Biodiversidade nas pescas do Algarve
(Sul de Portugal) / Biodiversity in the fisheries of Algarve (South Portugal). Universidade do algarve, Faro.
Borges, t.C., l. Bentes, M. Castro, M.E. Costa, K. Erzini, J. gomes, J.M.s. gonçalves, P.g. lino, C. Pais and J. ribeiro. – 1997. studies of the discards of Commercial Fisheries from the south coast of Portugal (disCalg). Final report to the European Commission, dg Fisheries-C-1, study Project no. 95/081. Borges, t.C., l. Bentes, M. Cristo, M.E. Costa, K. Erzini, s. olim,
and C. Pais. – 2000. analysis of Fisheries discards from the south coast of Portugal (disCalg). Final report to the Eu-ropean Commission, dg Fisheries-C-1, study Project no. 97/087.
Borges, t.C., K. Erzini, l. Bentes, M.E. Costa, J.M.s. gonçalves, P.g. lino, C. Pais and J. ribeiro. – 2001. By-catch and dis-carding practices in five algarve (southern Portugal) métiers. J. Appl. Ichthyol., 17(3): 104-114.
Borges, t.C.; M.E. Costa, M. Cristo, K. Erzini, a. Malaquias, a. nortista, s. olim, C. Pais, a. Campos, P. Fonseca, J. santos, r. larsen and a. Eide. – 2002. Managing by-catch and discards: a multidisciplinary approach (BYdisCard). Final report to the European Commission, dg Xiv-C-1, study Project no. 99/058.
Campos a. and P. Fonseca. – 2004. the use of separator panels and square mesh windows for by-catch reduction in the crustacean trawl fishery off the algarve (south Portugal). Fish. Res., 69(2): 147-156.
Campos a., P. Fonseca and K. Erzini. – 2002. size selectivity of dia-mond and square mesh cod ends for rose shrimp (Parapenaeus longirostris) and norway lobster (Nephrops norvegicus) off the Portuguese south coast. Fish. Res., 58(3): 281-301.
Campos a., P. Fonseca and K. Erzini. – 2003. size selectivity of diamond and square mesh cod ends for four by-catch species in the crustacean fishery off the Portuguese south coast. Fish. Res., 60(1): 79-97.
Cascalho, a.r. – 1995. Certains aspects de la biologie et du com-portement des crevettes d´eaux profondes de la côte portugaise. ICES Mar. Sci. Symp., 199: 108-117.
Cascalho, a., i. arrobas and M.J. Figueiredo. – 1984. a pesca de ar-rasto de crustáceos no algarve. importância dos conhecimentos biológicos na gestão adequada da pescaria. 3º Congresso sobre o Algarve, 2: 1071-1077.
Castriota, l., s. Campagnuolo and F. andaloro. – 2001. shrimp trawl Fishery By-catch in the straits of sicily (Central Mediter-ranean sea). deep-sea Fisheries symposium. scientific Council Meeting – september 2001, NAFO SCR doc. 01/113, 9 pp.. C.E.C. (Commission of the European Communities), 1993a. -
re-port of EC group of experts on review of Biological informa-tion and technical Measures applicable to the gulf of Cadiz. Commission of the European Communities, sEC (93) 1369, Brussels, 29 pp.
C.E.C. (Commission of the European Communities), 1993b. - deep-water fisheries (Commision staff working paper). Commission of the European Communities dgXiv-C-1 sEC(93) 1791, Brussels, 29 pp.
Clucas, i. – 1997. a study of the options for utilization of bycatch and discards from marine capture fisheries. FAO Fish. Circ., rome, Fao, 928, 59 pp.
de Figueiredo, M.J. and a. viriato. – 1992. distribuição batimétrica e topografia dos pesqueiros de lagostim (Nephrops norvegicus)
na costa Portuguesa. in: instituto nacional de investigação Pesqueira (i.n.i.P.)/liga para a Protecção da natureza (l.P.n.) (eds.), Colóquio sobre Conservação dos recursos vivos Mar-inhos. lisboa, Portugal, 25-27 novembro. 1989. Publ. Avulsas Inst. Port. Invest. Marit., 17: 95.
d.r., 1999. - diário da república. Portaria n.º1124/99 de 29 de dezembro, diário da república – i série-B, Ministério da agri-cultura, do desenvolvimento rural e das Pescas, 301: 9325. d.r., 2000. - diário da república. Portaria n.º1102-E/2000 de 22
de novembro, diário da república – i série-B, Ministério da agricultura, do desenvolvimento rural e das Pescas, 270: 6692(12)-6692(16).
d.r., 2001. - diário da república. Portaria n.º27/2001 de 15 de Janeiro, diário da república – i série-B, Ministério da agricul-tura, do desenvolvimento rural e das Pescas, 12: 229-230. Erzini, K., M.E. Costa, l. Bentes and t.C. Borges. – 2002. a
com-parative study of the species composition of discards from five fisheries from the algarve (southern Portugal). Fish. Manage. Ecol., 9: 31-40.
Fao. – 1996. report of the technical consultation on reduction of wastage in fisheries. FAO Fish. Rep., 547: 27 p.
Fao. – 1997. review of the state of world fishery resources: marine fisheries. 2. northeast atlantic Fao statistical area 27. FAO Fish. Circ. ,rome, 920: 1-9.
Figueiredo, M.J., o. Moura, and i. Figueiredo. – 1994. Peixes de profundidade da costa continental portuguesa. Relat. Cient. Tec. Inst. Port. Invest. Marit., 3: 85 p.
Fonseca, P., a. Campos and J. Feitoria. – 1998. square mesh win-dows experiments in Portuguese waters. ICES Counc. Meet. Pap., C.M. 1998/BB: 12 p.
Fonseca, P., a. Campos, r.B. larsen, t.C Borges and K. Erzini, K. -2005a. Using a modified nordmøre grid for by-catch reduction in the Portuguese crustacean-trawl fishery. Fish. Res., 71(2): 223-239.
Fonseca, P., a. Campos, B. Mendes and r.B. larsen. – 2005b. Potential use of a nordmøre grid for by-catch reduction in a Portuguese bottom-trawl multispecies fishery. Fish. Res., 73(1-2): 49-66.
garcía-rodriguez, M. and a. Esteban. – 1999. on the biology and fishery of aristeus anntenatus (risso, 1816) (decapoda, dendo-branchiata) in the ibiza Channel (Balearic islands, spain). Sci. Mar., 63(1): 27-37.
Hall, M.a. – 1996. on bycatches. Rev. Fish Biol. Fish., 6(3): 319-352.
Hall, M.a. – 1998. an ecological view of the tuna-dolphin problem: impacts and tradeoffs. Rev. Fish Biol. Fish., 8(1): 1-34. Hall, M.a., d.l. alverson and K.i. Metuzals. – 2000. Bycatch:
Problems and solutions. Mar. Pollut. Bull., 41(1-6): 204-219. Kennelly, s.J. – 1995. the issue of bycatch in australia’s demersal
trawl fisheries. Rev. Fish Biol. Fish., 5(2): 213-234.
Kenelly, s.J. – 1997. a framework for solving by-catch problems: examples from new south Wales, australia, the eastern Pacific and the northwest atlantic. in: d.a. Hancock, d.C. smith, a. grant and J.P. Beumer (eds.), Developing and sustaining world fisheries resources. The state of science and management, pp. 544-550. Collingwood, australia CSIRO.
larson, d.M., B.H. House and J.M. terry. – 1996. toward Efficient Management in Multispecies Fisheries: a nonparametric ap-proach. Mar. Resour. Econ., 11: 181-201.
lewison, r.l., l.B. Crowder, a.J. read and s.a. Freeman. – 2004. Understanding impacts of fisheries bycatch on marine mega-fauna. Trends Ecol. Evol., 19(11): 598-604.
liggins, g.W., s.J. Kennelly and M.K. Broadhurst. – 1996. observ-er based survey of By-catch from Prawn trawling in Botany Bay and Port Jackson, new south Wales. Mar. Freshw. Res., 47(7): 877-888.
Merella, P., F. alemany, a. Carbonell and a. Quetglas. – 1998. Fishery and biology of norway lobster Nephrops norvegicus (decapoda: nephropidae) in Mallorca (western Mediterranean). J. Nat. Hist., 32: 1631-1640.
Monteiro, P., a. araújo, K. Erzini and M. Castro. – 2001. discards of the algarve (southern Portugal) crustacean trawl fishery. Hidrobiologia, 449(1-3): 267-277.
Moranta, J., E. Massutí and B. Morales-nin. – 2000. Fish catch composition of the deep-sea decapod crustacean fisheries in the Balearic islands (western Mediterranean). Fish. Res., 45: 253-264.
Murawski, s.a. – 1996. Factors influencing bycatch and discard rates: analyses from multispecies/multifishery sea sampling. J. Northwest Atl. Fish. Sci., 16: 31-89.
nakano, H., M. okazaki and H. okamoto. – 1997. analysis of Catch depth by species for tuna longline Fishery Based on Catch by Branch lines. Bull. Nat. Res. Inst. Far Seas Fish., 34: 43-62. nMFs. – 1999. our living oceans. report on the status of U.s.
liv-ing marine resources. U.s. dep. Commer., NOAA Tech. Memo. NMFS-F/SPO, 41, 301 pp.
oliver, P. – 1993. analysis of fluctuations observed in the trawl fleet landings of the Balearic islands. Sci. Mar., 57(2-3): 219-227. Pauly, d., v. Christensen, s. guénette, t.J. Pitcher, U.r. sumaila,
C.J. Walters, r. Watson and d. zeller. – 2002. towards sustain-ability in fisheries management. Nature, 418: 689-695. Pita, C, a. Marques, K. Erzini, i. noronha, d. Houlihan and M.t.
dinis. – 2001. socio-economics of the algarve (south of Por-tugal) fisheries sector. in: inE (ed.), Estatísticas da Pesca, pp. 1-12. algarve, Portugal.
rawson, M.v. – 1997. Fisheries bycatch: consequences and man-agement. Procedings of the symposium on the Consequences and Management of Fisheries Bycatch. Allaska Sea Grant Col-lege Program Report, 97-02:159 p.
rebecca, l.l., l.B. Crowder, a.J. read and s.a. Freeman. – 2004. Understanding impacts of fisheries bycatch on marine mega-fauna. Trends Ecol. Evol., 9(11): 598-604.
recasens, l., a. lombarte, B. Mortales-nin and g.J. torres. – 1998. spatiotemporal variation in the population structure of the European hake in the nW Mediterranean. J. Fish. Biol., 53: 387-401.
ribeiro-Cascalho, a. and i. arrobas. – 1987. observations on the biology of Parapenaeus longirostris (lucas, 1846) from the south coast of Portugal. Invest. Pesq., 51(suppl. 1): 201-212. rochet, M-J., i. Péronnet, v.M. trenkel. – 2002. an analysis of
discards from the French trawler fleet in the Celtic sea. ICES J. Mar. Sci., 59(3): 538-552.
saila, s.B., 1983. importance and assessment of discards in com-mercial fisheries. FAO Fish. Circ., 765: 62 p.
sánchez, P., M. demestre and P. Martín. – 2004. Characterisation of the discards generated by bottom trawling in the northwestern Mediterranean. Fish. Res., 67(1): 71-80.
sartor, P., M. sbrana, B. reale and P. Belcari. – 2003. impact of the deep sea trawl Fishery on demersal Communities of the northern tyrrhenian sea (Western Mediterranean). J. North-west Atl. Fish. Sci., 31: 275-284.
sbrana, M., P. sartor and P. Belcari. – 2003. analysis of the factors affecting crustacean trawl fishery catch rates in the northern tyrrhenian sea (western Mediterranean). Fish. Res., 65(1-3): 271-284.
s.E.P. (secretaria de Estado das Pescas). – 1984. Programa de re-estruturação, modernização e desenvolvimento da frota de pesca portuguesa. Ministério da agricultura e Pescas e alimentação, secretaria de Estado das Pescas (s.E.P.), lisboa.
slavin, J.W. – 1981. the utilization of shrimp bycatch. Fish bycatch - bonus from the sea. in: Report of a technical consultation on shrimp bycatch utilization, pp. 21-28. 27-30 october 1981, georgetown, guyana, FAO/IDRC ottawa (idrC-198e). stergiou, K.i., a. Machias, s. somarakis and a.Kapantagakis.
– 2003. Can we define target species in Mediterranean trawl fisheries? Fish. Res., 59(3): 431-435.
stobutzki, i., P. Jones and M. Miller. – 2003. a comparison of fish bycatch communities between areas open and closed to prawn trawling in an australian tropical fishery. ICES J. Mar. Sci., 60(5): 951-966.
Ye, Y., a.H. alsaffar and H.M.a. Mohammed. – 2000. Bycatch and discards of the Kuwait shrimp fishery. Fish. Res., 45(1): 9-19. zann, l.P. – 2000. Chapter 32. the by-catch issue and the effects of
trawling. state of the marine Environmental report for austral-ia. technical summary. ocean rescue 2000, department of the Environmental, sport and territories, Canberra, pp.185-187.
zar, J.H. – 1996. Biostatistical analysis, 3rd edn. Upper slade river,
new Jersey: Prentice-Hall. scient. ed.: a. guerra.
received october 25, 2007. accepted May 20, 2008. Published online october 27, 2008.