A European benchmarking system to evaluate in-hospital mortality rates
in acute coronary syndrome: The EURHOBOP project
☆
Irene R. Dégano
a,1, Isaac Subirana
a,b,1, Marina Torre
c, María Grau
a, Joan Vila
a,b, Danilo Fusco
d,
Inge Kirchberger
e,f, Jean Ferrières
g, Antti Malmivaara
h, Ana Azevedo
i, Christa Meisinger
e,f, Vanina Bongard
j,
Dimitros Farmakis
k, Marina Davoli
d, Unto Häkkinen
h, Carla Araújo
i, John Lekakis
k, Roberto Elosua
a,
Jaume Marrugat
a,⁎
, on behalf of the EURHOBOP investigators
a
REGICOR Study Group, Cardiovascular Epidemiology and Genetics Group, IMIM, Hospital del Mar Medical Research Institute, Barcelona, Spain
b
CIBER Epidemiology and Public Health, Spain
c
Istituto Superiore di Sanità, Rome, Italy
dDipartimento di Epidemiologia ASL RME, Rome, Italy
eMONICA/KORA Myocardial Infarction Registry, Augsburg, Germany f
Helmholtz Zentrum München, German Research Center for Environmental Health, Institute for Epidemiology II, Neuherberg, Germany
g
Department of Cardiology, Toulouse Rangueil Hospital, Toulouse University School of Medicine, Toulouse, France
h
Centre for Health and Social Economics, Helsinki, Finland
i
Department of Clinical Epidemiology, Predictive Medicine and Public Health, University of Porto Medical School, Institute of Public Health of the University of Porto (ISPUP), Porto, Portugal
j
Department of Epidemiology, UMR 1027 INSERM, Toulouse University, Toulouse, France
kATTIKON Hospital, University of Athens Medical School, Athens, Greece
a b s t r a c t
a r t i c l e i n f o
Article history: Received 27 August 2014
Received in revised form 30 December 2014 Accepted 4 January 2015
Available online 7 January 2015 Keywords:
Benchmarking Hospital performance Acute myocardial infarction Percutaneous coronary intervention In-hospital mortality
Background: Hospital performance models in acute myocardial infarction (AMI) are useful to assess patient man-agement. While models are available for individual countries, mainly US, cross-European performance models are lacking. Thus, we aimed to develop a system to benchmark European hospitals in AMI and percutaneous cor-onary intervention (PCI), based on predicted in-hospital mortality.
Methods and results: We used the EURopean HOspital Benchmarking by Outcomes in ACS Processes (EURHOBOP) cohort to develop the models, which included 11,631 AMI patients and 8276 acute coronary syndrome (ACS) pa-tients who underwent PCI. Models were validated with a cohort of 55,955 European ACS papa-tients. Multilevel lo-gistic regression was used to predict in-hospital mortality in European hospitals for AMI and PCI. Administrative and clinical models were constructed with patient- and hospital-level covariates, as well as hospital- and country-based random effects. Internal cross-validation and external validation showed good discrimination at the patient level and good calibration at the hospital level, based on the C-index (0.736–0.819) and the concor-dance correlation coefficient (55.4%–80.3%). Mortality ratios (MRs) showed excellent concorconcor-dance between administrative and clinical models (97.5% for AMI and 91.6% for PCI). Exclusion of transfers and hospital stays ≤1 day did not affect in-hospital mortality prediction in sensitivity analyses, as shown by MR concordance (80.9%–85.4%). Models were used to develop a benchmarking system to compare in-hospital mortality rates of European hospitals with similar characteristics.
Conclusions: The developed system, based on the EURHOBOP models, is a simple and reliable tool to compare in-hospital mortality rates between European in-hospitals in AMI and PCI.
© 2015 Elsevier Ireland Ltd. All rights reserved.
1. Introduction
Acute coronary syndrome (ACS) is the leading cause of morbi-mortality in Europe, emphasising the need of assessing ACS quality
of care[1]. To assess quality of care in ACS, it would be useful to an-alyse hospital performance based on quality indicators; such as structure (e.g. access to cardiovascular specialists), process (e.g. timely and appropriate reperfusion) and outcomes (e.g. death)
[2]. Compared to structure and process, outcome indicators
pro-vide a more global measure of quality of care and are the most
rel-evant to patients and physicians[2,3]. In addition, mortality— the
most widely used outcome— has been recommended as a key
indicator of the quality of acute myocardial infarction (AMI)
man-agement[4].
☆ All authors take responsibility for all aspects of the reliability and freedom from bias of the data presented and their discussed interpretation.
⁎ Corresponding author at: Carrer Dr Aiguader 88, E-08003 Barcelona, Spain. E-mail address:jmarrugat@imim.es(J. Marrugat).
1
Both authors have equally contributed to this manuscript.
http://dx.doi.org/10.1016/j.ijcard.2015.01.019
0167-5273/© 2015 Elsevier Ireland Ltd. All rights reserved.
Contents lists available atScienceDirect
International Journal of Cardiology
In the last decade, several models have been developed to analyse hospital performance in ACS management based on in-hospital or 30-day mortality[5–10]. Krumholz et al. provided thefirst model to estimate AMI 30-day mortality for benchmarking purposes, using administrative data[5]. Following similar methodology, other authors developed models to estimate AMI[6–8], ACS[9], and percutaneous coronary intervention (PCI)[10]mortality, mainly using administrative data.
The usefulness of hospital performance models for quality of care improvement is based on the actions that would be implemented as a result of the information obtained. For example, it would be expected that a hospital/department whose AMI mortality is higher than the mortality observed in other units with similar characteristics, regarding patients and resources, would revise and improve their current AMI protocols. Thus, European hospitals, cardiovascular departments and coronary units must be able to compare themselves to others with sim-ilar characteristics. For this comparison to be reliable, the data used to develop the models should be representative of European hospitals.
However, the available models were mainly developed in the US[5,7,
8,10]and most of them, including the only PCI model, were developed for patients older than 64 years[5,8,10]. In addition, cross-European performance models, which would be representative of European hospitals and would allow a common strategy for ACS quality of care
improvement in Europe, are lacking. Tofill this gap, we designed the
EURopean HOspital Benchmarking by Outcomes in ACS Processes
(EURHOBOP) project [11]. The EURHOBOP, was a cohort study
funded by the European Commission, designed to provide a valid ACS benchmarking system to the European Community. The goal of this system was to allow cardiologists and other professionals from European hospitals to easily monitor their outcomes in key ACS diag-nosis and procedures.
The aim of the present study was to derivate and validate a set of models to benchmark in-hospital mortality rates in European hospitals, in AMI and PCI, taking into account the country as well as hospital and patient characteristics. The secondary aim was to provide a computer-based tool, using the developed models, to allow cardiologists to com-pare the data from their own practice with others.
2. Methods
The EURHOBOP Study complies with the Declaration of Helsinki and was approved by the ethics committee of the Parc de Salut Mar (IMIM-PSMAR 2010/3779/I) of Barcelona, Spain.
2.1. Data collection
The EURHOBOP cohort included 15,170 ACS patients from 68 hospitals located in: Finland, France, Germany, Greece, Italy, Portugal, and Spain. Data collection in the EURHOBOP study has been previously described[12]. Briefly, at least 2000 patients were
retrospectively recruited per country from 2008 to 2012, with a mean of 221 consecutive patients recruited per hospital. Patient- and hospital-level data were obtained from the letter of discharge and from medical records (whether on paper or electronic). Patient characteristics included demographic variables, cardiovascular (CV) risk factors, comor-bidities, procedures and complications during hospitalization, and admission and dis-charge data. Hospital characteristics included the number of beds and cardiology patients discharged, as well as ACS care facilities. Collected variables are listed in the Sup-plementary material online, Table S1.
2.2. Study population and outcome
EURHOBOP patients with a discharge diagnosis of unstable angina (UA) or AMI (Inter-national Classification of Diseases 10th revision: I21.0–I21.9 and I20.0) were selected for the present study. Two patient subsets were chosen for hospital benchmarking due to their importance in ACS management: patients with a discharge diagnosis of AMI and pa-tients who underwent PCI during the index admission. Papa-tients from hospitals that re-cruited less than 10 patients for any of the subsets were excluded from the analysis. The flowchart of the included patients is presented in Fig. S1. The selected outcome was in-hospital mortality from any cause during the index admission.
2.3. Candidate variables
Variables predictive of in-hospital mortality were chosen based on literature evidence and clinical experience. Candidate variables for analysis were selected on the basis of the reference time (defined as admission), as suggested for models reporting health outcomes
[13]. Thirteen candidate variables remained for the analysis: 8 at the patient level (age, sex, hypertension, diabetes, past history of CV diseases, ACS type, presence of cardiogenic shock or acute pulmonary oedema on admission and presence of renal failure on admis-sion), and 5 at the hospital level (presence of intensive care unit (ICU), coronary care unit (CCU), catheterization laboratory, cardiac surgery, and university hospital status). Two sets of variables were defined: a clinical set, containing all candidate variables, and an administrative set, excluding the presence of cardiogenic shock or acute pulmonary oe-dema and the presence of renal failure on admission.
2.4. Model description
Two hierarchical logistic mixed models, one with the clinical and the other with the administrative set of variables, werefitted to each patient subset (AMI or PCI). In-hospital mortality was the binary outcome variable; patient and In-hospital characteristics constituted thefixed-effect explanatory variables. Hospital and country were also includ-ed as random-effect variables to deal with the hierarchical clustering of data.
2.5. Expected in-hospital mortality calculation
To calculate the expected in-hospital mortality the model wasfitted using all patients except those admitted to the hospital for which the expected in-hospital mortality was being computed. This procedure, also known as cross-validation was repeated for all hos-pitals. Two types of expected in-hospital mortality rates were computed: (i) for hospitals located in countries included in the sample, by including the specific country effect in the model, and (ii) for hospitals from other countries, using the same hospitals data but as-suming that they were from a country not included in the sample and setting the country effect to zero. Methodological detail regarding the computation of expected in-hospital mortality rates is provided in the Supplementary material online.
Table 1
Comparison of patients from the derivation and the validation cohort.
AMI PCI
Validation Derivation Overall p-value Validation Derivation Overall p-value
N = 54,083 N = 11,631 N = 25,747 N = 8276 Age; mean (SD) 69.0 (13.4) 67.7 (13.6) b0.001 65.2 (12.5) 64.6 (12.6) b0.001 Sex: Female 17,972 (33.2%) 3599 (30.9%) b0.001 6500 (25.2%) 2050 (24.8%) 0.392 Hypertension 14,015 (25.9%) 6100 (52.4%) 0.000 6336 (24.6%) 4364 (52.7%) 0.000 Diabetes 7856 (14.5%) 2904 (25.0%) b0.001 3139 (12.2%) 1841 (22.2%) b0.001 Past history of CVD 14,348 (26.5%) 3819 (32.8%) b0.001 6018 (23.4%) 2679 (32.4%) b0.001 ACS b0.001 b0.001 Non-STEACS 28,033 (52.2%) 5366 (46.6%) 10,696 (41.8%) 3848 (47.0%) STEACS 23,643 (44.0%) 5530 (48.1%) 14,505 (56.6%) 4002 (48.8%) Non classifiable 2074 (3.86%) 607 (5.28%) 409 (1.60%) 343 (4.19%) Shock/pulmonary oedema 1905 (3.53%) 831 (7.14%) b0.001 695 (2.70%) 400 (4.83%) b0.001 Renal failure 4150 (8.28%) 1197 (10.3%) b0.001 1274 (5.54%) 543 (6.56%) 0.001 In-hospital mortality 4469 (8.26%) 868 (7.46%) 0.004 977 (3.79%) 278 (3.36%) 0.073 Unless indicated represented values are: frequencies (percentages).
AMI: acute myocardial infarction; PCI: percutaneous intervention; SD: standard deviation; CVD: cardiovascular disease; ACS: acute coronary syndrome; STEACS: ACS with ST segment elevation.
2.6. Variable selection
A forward stepwise procedure was used to select the variables included in the models from the list of candidate variables. The selection was based on the maximization of the concordance correlation coefficient (CCC). The CCC was computed as the agreement be-tween observed and expected in-hospital mortality rates for each hospital, weighted for the number of patients recruited by that hospital. Expected and observed mortality rates were normalized with the squared-sinus transformation prior to CCC calculation. The step-forward process was repeated until all candidate variables were included (Fig. S2). An extra step was conducted to remove the variables that did not improve the CCC and were not significantly associated with the outcome. Sex was forced into the AMI models to account for the demographic and clinical differences between men and women with an AMI. Due to the high co-linearity of the ICU, CCU and catheterization laboratory vari-ables, if one of these entered in the model, the other two were removed from the list of candidate variables.
2.7. Model validation
Model validation was assessed internally and externally using two measures: the C-index, to assess model discrimination at the patient level, and the CCC between observed and expected rates, to assess model calibration at the hospital level. The CCC was provided together with its 95% confidence interval and an “upper reference value”, which was cal-culated under the hypothesis that, with our sample size, the variables explained 100% of the observed variability. Internal validation was performed by cross-validation as described inSection 2.5. External validation was performed using an independent cohort of 55,955 ACS patients who were included in 3 European registries: the Cooperative Health Research in the Region of Augsburg (KORA) Myocardial Infarction Registry (2005–2011, n = 3973) [14], the Lazio Region Hospital Information System (2008–2013, n = 44,855)[15]and the Spanish MASCARA ACS Study (2004–2005, n = 7127)[16]. Hospitals with less than 10 patients in any of the analysed subsets were excluded.
2.8. Concordance between administrative and clinical models
Administrative and clinical models were compared by assessing the concordance of mortality ratios (MRs)[5,10]for each model type. MRs were computed as the ratio of pre-dicted and expected in-hospital mortality rates in each hospital. The prepre-dicted in-hospital mortality rates were calculated as the expected rates, described inSection 2.5, but adding the specific effect of each hospital. MRs were log-transformed for normalization. Log-MRs from administrative and clinical models were compared for each patient subset (AMI and PCI) using the CCC statistic. Methodological detail regarding the computation of predicted in-hospital mortality rates is provided in the Supplementary material online.
2.9. Sensitivity analyses
The four described models were re-fitted on a subsample, excluding transferred pa-tients and papa-tients who stayed≤1 day at the hospital. The flowchart of the included pa-tients is presented in Fig. S3. Cross-validation was performed with the C-index and CCC measures. MRs were calculated for each model as described and log-MRs were compared to the log-MRs from the full sample using the CCC.
Statistical analysis was performed with R Statistical Package (R Foundation for Statis-tical Computing, Vienna, Austria; Version 3.0.2)[17].
3. Results
3.1. Patient and hospital characteristics
In the derivation cohort patients had a mean age of 66 years and 28% were women. Patient characteristics by subset are presented inTable 1. Crude in-hospital mortality was 7.5% in AMI patients and 3.4% in the pa-tients who underwent PCI. From the included cases, 25.7% and 19.6% in-volved hospital transfers in the AMI and the PCI subset, respectively. The
proportion of patients discharged within thefirst 24 h was 8.2% in the
AMI subset and 5.5% in the PCI subset.
Regarding hospital characteristics, more than 75% of the hospitals had ICU, CCU, or catheterization laboratory, or a combination of these fa-cilities. Around 50% of the hospitals had cardiac surgery facilities or were university hospitals (Table 2).
3.2. Model derivation
The administrative and clinical AMI models included the following predictor variables: sex, age, hypertension, diabetes, ACS type, and
Table 3
Derivation and validation of administrative and clinical models.
AMI PCI Clinical N = 11,503 Administrative N = 11,503 Clinical N = 8192 Administrative N = 8192 Included variables OR [95% CI]
Sex: Female 0.98 [0.83–1.15] 1.04 [0.88–1.21] Age 1.07 [1.06–1.08] 1.07 [1.06–1.08] 1.07 [1.05–1.08] Hypertension 0.65 [0.55–0.78] 0.69 [0.58–0.82] 0.77 [0.57–1.03] Diabetes 1.30 [1.08–1.55] 1.45 [1.22–1.72] 1.26 [0.92–1.72] 1.37 [1.02–1.85] Past history of CVD 1.14 [0.97–1.34] 1.56 [1.17–2.06] 1.31 [1.00–1.73] ACS: STEACS 3.23 [2.70–3.86] 3.00 [2.52–3.56] 5.89 [4.17–8.31] 6.50 [4.66–9.06] ACS: Non classifiable 2.73 [2.05–3.62] 2.99 [2.29–3.92] 1.90 [0.94–3.81] 2.38 [1.22–4.65]
Shock/pulmonary oedema 6.92 [5.68–8.43] 14.0 [10.3–19.1] Renal failure 2.07 [1.68–2.54] 1.92 [1.27–2.91] CCU/ICU 0.48 [0.28–0.85] 0.42 [0.25–0.71] Catheterization laboratory 2.18 [1.01–4.71] 2.21 [1.05–4.65] University hospital 1.22 [0.86–1.73] 1.33 [0.96–1.84] Internal cross-validation C-index [95% CI] 0.819 [0.805, 0.834] 0.773 [0.757, 0.788] 0.812 [0.785, 0.840] 0.800 [0.775, 0.826] CCC% [95% CI] 65.2 [49.6,75.6] 63.1 [48.7,73.5] 58.3 [48.0,64.3] 56.8 [47.3,64.3]
CCC upper reference value% 85.3 84.3 72.6 71.7
External validation
C-index [95% CI] 0.807 [0.800, 0.814] 0.751 [0.744, 0.759] 0.745 [0.727, 0.762] 0.736 [0.720, 0.753] CCC% [95% CI] 53.6 [35.5,61.8] 50.9 [37.5,61.1] 47.8 [14.9,56.1] 42.1 [22.8,52.9]
CCC upper reference value% 92.1 91.8 81.2 75.7
For each variable, the Odds ratio and its 95% confidence interval are presented for the model fitted in the derivation cohort. AMI: acute myocardial infarction; PCI: percutaneous interven-tion; OR: odds ratio; CI: confidence interval; CVD: cardiovascular disease; ACS: acute coronary syndrome; STEACS: ACS with ST segment elevainterven-tion; CCU: coronary care unit; ICU: intensive care unit; CCC: concordance correlation coefficient.
Table 2
Characteristics of the participating hospitals in the derivation cohort.
ICU CCU Cath Lab Cardiac University Total ICU: intensive care unit 61 55 54 32 29 61 CCU: coronary care unit 55 59 54 33 29 59 Cath Lab: catheterization
laboratory
54 54 55 33 29 55
Cardiac: cardiac surgery 32 33 33 33 25 33 University: university hospital 29 29 29 25 30 30 Pairwise combinations and marginal frequencies for the included hospital characteristics in the 68 participating hospitals.
CCU/ICU (Table 3). The clinical model included also cardiogenic shock/ acute pulmonary oedema and renal failure on admission, while the ad-ministrative model included previous history of CV disease instead. Age, diabetes, ACS type, cardiogenic shock/acute pulmonary oedema and renal failure on admission were positively associated with in-hospital mortality. Hypertension and presence of CCU/ICU were negatively asso-ciated with the outcome.
As for PCI, both the administrative and clinical models included the following predictor variables: diabetes, past history of CV disease, ACS type, catheterization laboratory and university hospital (Table 3). The clinical model included also cardiogenic shock/acute pulmonary oedema and renal failure on admission, while the administrative model included age and hypertension instead. All variables, except for hypertension, were positively associated with in-hospital mortality.
Most of the variables included in the AMI and PCI models had a sig-nificant or borderline association with in-hospital mortality at the pa-tient level. In the clinical models, the variable with a larger effect on
in-hospital mortality was cardiogenic shock/pulmonary oedema on ad-mission; in the administrative models, it was ACS type.
3.3. Model validation
Internal cross-validation showed good discrimination at the patient level of AMI models (c-statistic = 0.819 and 0.773 for clinical and ad-ministrative models, respectively) and PCI models (c-statistic = 0.812 and 0.800, respectively) (Table 3). At the hospital level, models showed robust calibration (CCC/upper reference = 76.4% and 74.9%, for AMI clinical and administrative models, respectively; CCC/upper reference = 80.3% and 79.2%, for PCI models, respectively) (Table 3,Fig. 1).
Performance was also analysed assuming that in-hospital mortality rates were predicted for hospitals located in countries not included in the sample. In this scenario, model discrimination was satisfactory for AMI clinical and administrative models (c-statistic = 0.800 and 0.747, respectively) as well as for PCI models (c-statistic = 0.771 and 0.771,
Fig. 1. Concordance between observed and expected in-hospital mortality rates. Concordance of in-hospital mortality rates analysed with the clinical (left) and administrative models (right) in the AMI (top) and PCI subsets (bottom). Dot size is proportional to the number of patients included by hospital (legend). The CCC, its 95% CI, and its upper reference value (Ref.) are provided for each scenario.
respectively). Model calibration, however, was weak in both AMI and PCI models (CCC/upper reference = 21% for AMI models, and 15% and 23%, for PCI clinical and administrative models, respectively).
External validation was performed with the validation cohort sum-marized inTable 1. The proportion of patients with cardiovascular risk factors, and with renal failure and killip classes III–IV on admission, was lower in the validation cohort compared to the derivation cohort (Table 1). In AMI models, all explanatory variables showed similar ORs in the derivation and validation cohort, except for hypertension and CCU/ICU. However, in PCI models, ORs differed in both cohorts for hy-pertension, diabetes, past history of cardiovascular disease, ACS type
and catheterization laboratory (Tables 1and S3). Model discrimination
was good in the validation cohort (c-statistic = 0.736–0.807), and did not differ between the derivation and the validation cohort except for PCI models (Table 3). Model calibration was acceptable in the validation
cohort (CCC/upper reference = 55.4–58.9%) and did not differ between
the derivation and the validation cohort (Table 3and Fig. S5).
3.4. Concordance between administrative and clinical models
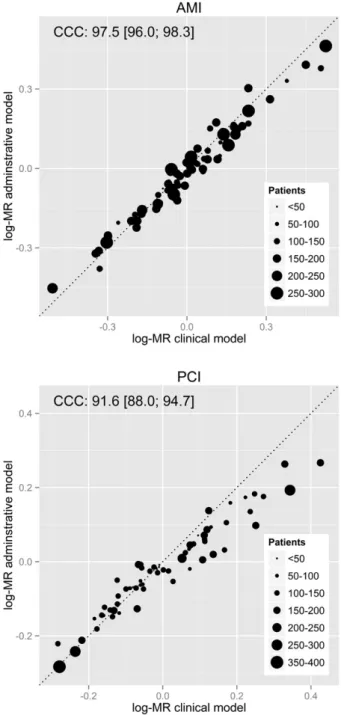
The mean in-hospital MR multiplied by the crude in-hospital mortal-ity was 7.58% (SD = 1.50) for patients diagnosed with AMI and 3.23% (SD = 0.84) for patients who underwent PCI. The concordance between the log-MRs obtained from administrative and clinical models was ex-cellent for AMI and PCI models (97.5% and 91.6%, respectively) (Fig. 2).
3.5. Sensitivity analysis
Model re-fitting in a subsample excluding transfers and hospital stays ≤1 day yielded similar ORs for all explanatory variables at the patient level, except for diabetes in the PCI administrative model (Tables 3and S2). Regarding hospital level variables, neither CCU/ICU had an effect on in-hospital mortality in the AMI clinical model, nor catheterization labora-tory in the PCI models. No difference was observed in model discrimina-tion and calibradiscrimina-tion in AMI models. On the other hand, PCI models showed similar discrimination but lower calibration (CCC/reference = 59.4% and 61.2%, for clinical and administrative models, respectively) (Table S2, Fig. S4). Importantly, there was a high concordance between the log-MRs obtained in the whole sample and in the sensitivity analysis subsample: 82.7% and 80.9% for AMI clinical and administrative models, and 85.4% and 84.3% for PCI clinical and administrative models (Fig. 3).
3.6. Computer-based tool
The developed models were implemented as an on-line application to provide a straightforward tool to compare AMI/PCI in-hospital mor-tality rates from cardiology units and hospitals with others. The
on-line application can be accessed from the EURHOBOP website[11], by
clicking on the Hospital benchmarking icon. Once in the application, a description of the tool is provided and a page for data entry appears. After sending the data the application produces the percentile distribu-tion of the expected in-hospital mortality rates in all EURHOBOP hospi-tals with similar characteristics and the location of the assessed hospital in this distribution (Fig. 4).
4. Discussion
We developed a benchmarking system to compare performance of European hospitals and cardiology units in AMI management and PCI use. Our system is based on in-hospital mortality predicted at the hospi-tal level by multilevel logistic regression models. The developed models
allow cardiologists and other professionals in the cardiologyfield to
compare their own data with others with similar characteristics even if only administrative data is available.
Patient-level variables included in our models were also retained in previous models with similar effects[5–10]. In addition, prior AMI and
PCI models included more comorbidities, admission and procedural
variables[5–8], which were not included in our models due to
non-availability, presence of missing values or non-compliance with the ref-erence time. Regarding hospital-level variables, only the AMI model by Seghieri et al. included one, catheterization laboratory[6], which did not
contribute significantly to our AMI models, even if CCU/ICU was
re-moved from the list of candidate variables. However, catheterization laboratory was the main hospital-level variable in our PCI models. CCU/ICU was negatively associated with in-hospital mortality in our AMI models, while catheterization laboratory was positively associated with in-hospital mortality in our PCI models. This apparent discrepancy
is probably showing— through the CCU/ICU variable — the positive
correlation of larger and better-equipped hospitals with in-hospital
mortality[18]. At the same time, catheterization laboratory would be
representing the negative correlation between time to reperfusion and
Fig. 2. Concordance between hospital MRs obtained with administrative and clinical models. Concordance of log-MRs analysed in the AMI (top) and PCI subsets (bottom). Dot size is proportional to the number of patients included by hospital (legend). The CCC and its 95% CI are provided for each subset.
in-hospital mortality[19,20], as its effect disappeared when transferred patients were excluded.
Model discrimination at the patient level was similar between our
models and those reported in previous studies[5–10]. Our AMI models
showed a C-index of 0.77 and 0.82 for administrative and clinical models, respectively. In previous studies, discrimination of AMI models ranged from 0.70 to 0.83 for administrative models and from 0.77 to 0.84 for clinical models[5–8]. As for PCI, the C-index of our clinical model was 0.81, similar to the discrimination capacity of the only PCI model— clinical — for hospital benchmarking to date (0.84)[10].
The obtained MRs were consistent with previous studies: a mean of 7.58% for AMI patients compared to AMI hospital and 30-day in-hospital mortality rates of 8.10% and 7.99%, respectively[6,7]. As for PCI, Curtis et al. found an SMR of 1.55%, compared to the 3.23% MR ob-served in this study[10]; this difference is probably due to the exclusion of same-day discharges in the Curtis et al. study.
It has been suggested that non-standardized periods of assessment, such as the hospitalization interval, may result in a biased evaluation of hospital performance due to varying lengths of stay (LOS) and transfer of patients[13]. Mean LOS in AMI patients is positively correlated with
in-hospital SMR[21], while inter-hospital transfers of AMI patients
affects 30-day SMR in acute-care hospitals [22] but not in
non-procedure hospitals[23]. On the other hand, it has been argued that
hospitals are only responsible for events that occur within their institu-tion[24]. In this study, we found that 19.6% to 25.7% of the patients were transferred and 5.5% to 8.2% of patients had LOS≤1 day. In contrast to
the current assumption, our study showed good concordance (81%–
86%) between in-hospital log-MR when transfers and short LOS were excluded or not, indicating that these factors do not bias hospital perfor-mance assessment based on in-hospital mortality when the appropriate statistical methodology is used. In addition, excluding transfers may cause an inaccurate estimation of quality of care in certain hospitals/
Fig. 3. Sensitivity analysis: concordance of MR when excluding transfers and hospital stays≤1 day. Concordance between the overall log-MR and those obtained in the sensitivity sample analysed with the clinical (left) and administrative models (right) in the AMI (top) and PCI subsets (bottom). Dot size is proportional to the number of patients included by hospital (legend). The CCC and its 95% CI are provided for each scenario.
cardiology units[21]. Thus, it may not be necessary to exclude transfers and short LOS when comparing in-hospital mortality from clinical cardi-ology practice.
Administrative data, which contain important predictors of mortali-ty[25], are often used for outcomes research. Advantages of administra-tive data are its availability and reduced cost compared to clinical data. On the other hand, administrative data may lack certain predictors of
mortality[7]. Two studies demonstrated good correlation between
ad-ministrative and clinical models for hospital profiling in AMI[5,7]. A more appropriate measure to compare administrative and clinical model is the concordance of their estimates. In this study, we found
an excellent concordance (N90%) between log-MRs obtained with the
administrative and clinical models, especially for AMI (97%). Our ad-ministrative models may perform better than previous models due to the model development strategy and to the inclusion of the ACS-type
flag[9]. These results show that using the EURHOBOP models, an
accu-rate comparison of in-hospital mortality can be performed by either cardiologists or other healthcare professionals provided that at least ad-ministrative data is available.
The available AMI and PCI models for hospital benchmarking are intended for public reporting, and assume access to administrative/
clinical data as well as linkage to mortality registries[5–10]. Our
benchmarking system, however, has been designed for cardiologists
and healthcare professionals directly involved in the improvement of ACS protocols and patient management. Thus, it has been designed as a tool to improve management of AMI and PCI patients, through the comparison of in-hospital mortality rates to the rates from similar hospitals. This comparison can be performed anonymously, in a few minutes, and by different users ranging from cardiologists to hospital managers and other stakeholders, as the only requirement is aggregate data from a sam-ple of ACS patients and there is the possibility of applying administrative/ clinical models depending on variable availability.
Our study has several strengths. We developed the first
cross-European multinational benchmarking models to estimate AMI and PCI in-hospital mortality rates using up-to-date data. We did not exclude pa-tients due to age, LOS, or whether they were transferred or not, which al-lows more representative estimates of in-hospital mortality rates. We used standard methods for variable selection and statistical analysis, including model derivation and validation. We suggested a metric to eval-uate model calibration at the hospital level using the concordance
corre-lation coefficient. And finally, we developed an on-line application to
obtain the expected distribution of in-hospital mortality rates from simi-lar hospitals and the location of the assessed hospital/unit in this distribu-tion. This application is a simple, rapid, and precise tool that can be employed by a variety of users to gather insight into the comparison of AMI and PCI in-hospital mortality rates between similar hospitals.
Fig. 4. Percentile distribution of AMI in-hospital mortality rates from the European hospitals of the validation cohort. Output of the on-line application using the characteristics of the val-idation cohort fromTable 1. For this example we have set the benchmarked hospital/unit in Finland. This unit had ICU/CCU but not catheterization laboratory and it was not a university hospital. The benchmark results show not only the percentile distribution of the hospitals but also the location of the analysed unit in this distribution (Hospital case column), as well as the performance measures of the model.
5. Study limitations
The main limitation of our study is the difference between the deri-vation and the validation cohort. The derideri-vation cohort included ACS pa-tients from 7 countries, while the validation cohort included papa-tients from 3 of these countries. In addition, both cohorts were significantly different regarding the number of patients per hospital and the charac-teristics of the patients. Despite these differences, the proposed models showed good discrimination and acceptable calibration capacity, sug-gesting that the models perform adequately even if the sample is completely different from the derivation cohort. Another limitation re-lates to potential missing variables that could impact in-hospital mortal-ity rates and variabilmortal-ity at the hospital- and country-level, such as pharmacological treatment in the acute phase. This limitation is related to the exclusion criteria used and to the goal of providing a simple and precise tool for hospital benchmarking. To fulfil this goal, we had to bal-ance model parsimony and performbal-ance. Finally, we observed that the CCC was much lower than expected when the country was simulated as outside the EURHOBOP cohort. The validity of the developed models in countries other than those included in the study merits additional research.
6. Conclusions
We present a benchmarking system to assess European hospital per-formance in AMI and PCI, based on predicted in-hospital mortality rates. Our models take into account hospital and patient characteristics, as well as the hospitals' country. Our system allows comparison of in-hospital mortality rates between European in-hospitals sharing similar pa-tient and hospital characteristics, which could be used by cardiologists to improve their own practices, by hospitals and in a common public health strategy to improve ACS quality of care in Europe.
Supplementary data to this article can be found online athttp://dx. doi.org/10.1016/j.ijcard.2015.01.019.
Conflict of interest
During the conduct of the study, all authors were beneficiary of
a grant from the European Commission (SANCO EACH EURHOBOP 2008/1312). IRD, IS, MG, JV, RE and JM received grants from the Health Institute Carlos III-FEDER. IRD received a grant from the Catalan Agency for Management of University and Research Grants. JL received personal fees from BAYER, ASTRA ZENECA and MENARINI outside the submitted work.
Acknowledgements
This work was supported by the SANCO EAHC grants (EUPHORIC 2003/134 and EURHOBOP 2008/1312), the Health Institute Carlos III-FEDER (HERACLES Spanish Cardiovascular Research Network RD06/ 0009 and RD12/0042, CB06/02/0029 and CP12/03287 to MG) and the Catalan Agency for Management of University and Research Grants (2005SGR00577, 2009SGR1195 and 2014SGR240, and 2011BP-B00169
postdoctoral contract to IRD— Beatriu de Pinós Program co-financed
by the European Commission.
The authors thank Yolanda Ferrer for administrative support, Susana Tello for CRF preparation, Elaine Lilly, PhD, for the revision of the English text, and Mascia Masciocchi, Marco Constantini, and Andrea Paladin for the EURHOBOP website management and web implementation of the developed functions.
References
[1] J.A. Spertus, M.J. Radford, N.R. Every, E.F. Ellerbeck, E.D. Peterson, H.M. Krumholz, Challenges and opportunities in quantifying the quality of care for acute myocardial infarction: summary from the Acute Myocardial Infarction Working Group of the American Heart Association/American College of Cardiology First Scientific Forum on Quality of Care and Outcomes Research in Cardiovascular Disease and Stroke, Circulation 107 (2003) 1681–1691.
[2] Quality of Care and Outcomes Research in CVD and Stroke Working Groups*, Mea-suring and improving quality of care: a report from the American Heart Association/ American College of Cardiology First Scientific Forum on Assessment of Healthcare Quality in Cardiovascular Disease and Stroke, Circulation 101 (2000) 1483–1493.
[3] A. Donavenian, The role of outcomes in quality assessment and assurance, QRB Qual. Rev. Bull. 11 (1992) 356–360.
[4] J. Tu, L. Khalid, L.R. Donovan, D.T. Ko, Indicators of quality of care for patients with acute myocardial infarction, CMAJ 179 (2008) 909–915.
[5] H.M. Krumholz, Y. Wang, J.A. Mattera, et al., An administrative claims model suitable for profiling hospital performance based on 30-day mortality rates among patients with an acute myocardial infarction, Circulation 113 (2006) 1683–1692.
[6] C. Seghieri, S. Mimmi, J. Lenzi, M.P. Fantini, 30-day in-hospital mortality after acute myocardial infarction in Tuscany (Italy): an observational study using hospital dis-charge data, BMC Med. Res. Methodol. 12 (2012) 170.
[7] W.E. Weller, G. Kabra, K.S. Cozzens, E.L. Hannan, Appending limited clinical data to an administrative database for assessing institutional quality outliers for AMI care: does it matter? Int. J. Cardiol. 140 (2010) 95–101.
[8] J.S. Ross, C. Maynard, H.M. Krumholz, et al., Use of administrative claims models to assess 30-day mortality among Veterans Health Administration hospitals, Med. Care 48 (2010) 652–658.
[9] A. Bottle, R.D. Sanders, A. Mozid, P. Aylin, Provider profiling models for acute coro-nary syndrome mortality using administrative data, Int. J. Cardiol. 168 (2013) 338–343.
[10]J.P. Curtis, L.L. Geary, Y. Wang, et al., Development of 2 registry-based risk models suitable for characterizing hospital performance on 30-day all-cause mortality rates among patients undergoing percutaneous coronary intervention, Circ. Cardiovasc. Qual. Outcomes 5 (2012) 628–637.
[11] The EURHOBOP Project,http://www.eurhobop.eu(28th December 2014). [12]R. André, V. Bongard, R. Elosua, et al., International differences in acute coronary
syndrome patients' baseline characteristics, clinical management and outcomes in Western Europe: the EURHOBOP study, Heart 100 (2014) 1201–1207.
[13]H.M. Krumholz, R.G. Brindis, J.E. Brush, et al., Standards for statistical models used for public reporting of health outcomes: an American Heart Association Scientific Statement from the Quality of Care and Outcomes Research Interdisciplinary Writ-ing Group: cosponsored by the Council of Epidemiology and Prevention and the Stroke Council. Endorsed by the American College of Cardiology Foundation, Circu-lation 113 (2006) 456–462.
[14] K. Burkhardt, I. Kirchberger, M. Heier, et al., Hyponatremia on admission to hospital is associated with increased long-term risk of mortality in survivors of myocardial infarction, Eur. J. Prev. Cardiol. (Nov 11 2014) (pii: 2047487314557963, Epub ahead of print).
[15] P. Colais, M. Di Martino, D. Fusco, et al., Using clinical variables and drug prescription data to control for confounding in outcome comparisons between hospitals, BMC Health Serv. Res. 14 (Oct 23 2014) 495.
[16] I. Ferreira-González, G. Permanyer-Miralda, M. Heras, MASCARA study group, et al., Patterns of use and effectiveness of early invasive strategy in non-ST-segment eleva-tion acute coronary syndromes: an assessment by propensity score, Am. Heart J. 156 (5) (2008) 946–953 (953. e2).
[17] R Core Team, R: A Language and Environment for Statistical Computing, R Founda-tion for Statistical Computing, Vienna, Austria, 2014. (URLhttp://www.R-project. org/).
[18] V. Bertomeu, A. Cequier, J.L. Bernal, et al., In-hospital mortality due to acute myocar-dial infarction. Relevance of type of hospital and care provided. RECALCAR Study, Rev. Esp. Cardiol. 66 (2013) 935–942.
[19]C.P. Cannon, C.M. Gibson, C.T. Lambrew, et al., Relationship of symptom-onset-to-balloon time and door-to-symptom-onset-to-balloon time with mortality in patients undergoing angio-plasty for acute myocardial infarction, JAMA 283 (2000) 2941–2947.
[20] D.S. Pinto, A.J. Kirtane, B.K. Nallamothu, et al., Hospital delays in reperfusion for ST-elevation myocardial infarction. Implications when selecting a reperfusion strategy, Circulation 114 (2006) 2019–2025.
[21]E.E. Drye, S.L. Normand, Y. Wang, et al., Comparison of hospital risk-standardized mortality rates calculated by using in-hospital and 30-day models: an observational study with implications for hospital profiling, Ann. Intern. Med. 156 (2012) 19–26.
[22] M. Kosseim, N.E. Mayo, S. Scott, et al., Ranking hospitals according to acute myocar-dial infarction mortality: should transfers be included? Med. Care 44 (2006) 664–670.
[23]S.F. Jenks, D.K. Williams, T.L. Kay, Assessing hospital-associated deaths from dis-charge data. The role of length of stay and comorbidities, JAMA 260 (1988) 2240–2246.
[24]J.A. Barreto-Filho, Y. Wang, S.S. Rathore, et al., Transfer rates from nonprocedure hospitals after initial admission and outcomes among elderly patients with acute myocardial infarction, JAMA Intern. Med. 174 (2014) 213–222.
[25] P. Aylin, A. Bottle, A. Majeed, Use of administrative data or clinical databases as pre-dictors of risk of death in hospital: comparison of models, BMJ 334 (2007) 1044.