A GRAPHICAL USER INTERFACE FOR THE
FASTCOMP SOFTWARE
Patrícia C. T. Gonçalves1, João Manuel R. S. Tavares2 and Pedro P. R. C. Camanho3 1, 2 Optics and Experimental Mechanics Laboratory,
Mechanical Engineering and Industrial Management Institute 2, 3 Mechanical Engineering and Industrial Management Department 1, 2, 3 Engineering Faculty of the University of Porto, Porto, Portugal Email: pgoncalves@inegi.up.pt, tavares@fe.up.pt, pcamanho@fe.up.pt
SYNOPSIS
FastComp is a computational tool used in mechanical engineering for the determination of the forces that a composite bolted joint subjected to multiaxial loads supports until fracture occurs. The main intention of the present work was the development of a graphical user interface (GUI) for the referred software that allows its parameterization and the visualization of its results.
Using VTK, a computational library for graphical objects, visualization and image processing; C#, an object-oriented programming language; and the design principles of a good human/computer interaction, a graphical interface was developed as an efficient and effective means of interaction with the FastComp software.
INTRODUCTION
The number of applications of composite materials is considerably increasing. Good mechanical behaviour in corrosive environments and under fatigue, high resistance and rigidity and reduced weight are the main factors that contribute to the increasing search of composites in the most diverse areas of engineering.
In aeronautics industry, the use of these materials has already become popular. ESA – European Space Agency, for example, uses composite materials in the construction of the well known Ariane rockets. In these rockets, the cylindrical components that constitute the structure are connected with bolted joints. It is exactly in these joints, more precisely in the fastener hole, that composites present major problems: failure can occur (Portela, 2004). FastComp is a computational tool that analyzes a double, single bolted, composite joint subjected to loads. Given these loads, the geometry of the plates, the specifications of the laminate and the elastic and mechanical properties of the involved materials, the program determines not only the stress and strain fields around the hole, but also the failure load and failure mode of the joint.
FastComp is still being improved, but its use and results analysis were not simple until the development of the GUI concerned in this paper. In effect, for FastComp to work correctly, it needs an input file with all the data relative to the joint being analyzed. Before the GUI existed, that file was manually built; with the new interface the file is automatically generated after the introduction of all the required data, in a simple and attractive way.
failure data, another with strain field data and a last one with stress field data. These last two files contain a significant volume of data, and so its direct analysis is not easy. The developed GUI also deals with the visualization of these results, presenting them as surfaces illustrative of the stress and strain fields around the fastener hole.
In the next section, an analysis of FastComp’s architecture and applications is presented. The third section approaches the tools used in the development of this interface, namely the programming language C#, the graphical library VTK and the wrapper that makes possible the interaction C#/VTK. The following section introduces some points to consider while developing an interface as an adequate human/computer interaction. Next, the interface is presented and, finally, in the last section, the GUI’s evaluation is reported and its results analyzed. This article ends with some concluding remarks and proposals for future developments.
FASTCOMP
As already referred, FastComp is a computational tool to determine the forces that a composite bolted joint subjected to multiaxial loads supports until fracture occurs.
This software is based on the theories of classical lamination and anisotropic plates, together with the complex function method and superposition principles to determine stress and strain distribution around the fastener hole. To determine failure load and failure mode, a method that combines concepts of characteristic distance and appropriate failure criteria is used (Portela, 2004).
Calculation of stress distributions around the hole is based on the anisotropic plates theory and strain fields are determined based on classical lamination theory.
Failure analysis uses the stress field around the fastener hole’s boundaries and one out of two possible failure criteria:
YAFC - Yet Another Failure Criteria: based on Yamada-Sun’s failure criterion, it considers that shear stresses affect the laminate’s response to compression, but not its tensile behaviour in the composite’s fibres direction (Broughton, 2002; Portela, 2004); LaRC03 (Langley Research Centre): based on lamina fracture mechanisms, it was
developed to foresee initial damage in the layers of the composites (Camanho, 2004). Both YAFC and LaRC03 criterions are implemented in two distinct ways: using the point-stress method or the average point-stress method (Broughton, 2002). Point-point-stress method considers that failure occurs when the local value of tensile stress reaches the un-notched tensile strength of the laminate at a certain distance from the hole. On the other hand, average stress criterion considers failure to occur when the average tensile stress over a certain distance from the hole reaches the un-notched strength of the laminate.
Failure is searched along a characteristic curve, depending on characteristic distances, and failure mode is defined based on the angular position of the point where failure initiates.
DEVELOPMENT TOOLS
It is the purpose of this section to briefly present the tools used in the development of the interface for the FastComp software, namely the programming language C#, the graphical
library VTK and the wrapper that makes possible the interaction between them. C#
One of the tools used to develop FastComp’s GUI was C# (Sharp, 2003), an object-oriented programming language that incorporates elements of C, C++, Pascal, Java and others (Gonçalves, 2005).
Although the four languages directly supported by the Microsoft .NET platform (C#, Visual Basic .NET, C++ and JavaScript) are quite efficient, C# is .NET’s reference language because it was developed especially for this new platform, without compatibility concerns with already existing code (Petzold, 2002). In addition, it’s simple and secure and, therefore, easy to learn and use, robust and achieves good performance.
VTK
VTK – The Visualization ToolKit is a freeware, object-oriented software for 2D/3D graphics, visualization and image processing. Although implemented in C++, VTK also supports Tcl, Python and Java programming languages (Schroeder, 1999; Tavares, 2004).
The Visualization Toolkit is a computational tool useful in scientific visualization since it has a set of classes that provide reading/writing, processing and mapping of many visualization techniques for various types of data, including sets of points, polygons, images, volumes and rectilinear, structured and unstructured, grids. It contains readers and writers for data exchange with other applications and has available hundreds of data processing filters, from image convolution to the Delaunay triangulation. VTK’s rendering model supports 2D data, polygonal data, volumetric and texture data that can be combined (Tavares, 2004).
WRAPPER FOR THE .NET PLATFORM
Although VTK is mainly intended for the C++ language, as already referred, Frank (Frank, 2003) developed a wrapper for the .NET platform, thus allowing its use with the C# programming language.
A wrapper is a sort of a language translator; in this case, it allows C# to use VTK classes written in C++. The most complicated part of that work concerns the conversion of C# data types into adequate C++ ones and vice-versa.
Code written in C# is managed, while C++ code used in VTK is not. The conversion of data types in unmanaged code to data types in managed code is not always possible, or at least it’s not trivial. It was due to this difficulty that many VTK methods were not considered by Frank in his wrapper. That was the case of SetParentId(void* arg), a method used by class vtkRenderWindow. This class opens a visualization window where VTK objects are rendered and argument arg of SetParentId defines the component inside of which that window will be created. It’s of type void* – a pointer to unspecified data –, one of the data types not converted by Frank’s wrapper.
In C#, a component is identified by its Handle property of type IntPtr. IntPtr represents a pointer, but not a pointer to unspecified data. However, its method ToPointer() does precisely that: it converts the variable it refers to into a pointer to unspecified data, whose equivalent in C++ is void*.
The disadvantage of using ToPointer() is that it compels to the use of the unsafe declaration in C# code. This declaration must include all the code lines that use pointers, transforming them into unmanaged code.
In the source code of Frank’s wrapper, the lines that implement method SetParentId were commented. For the implementation of the GUI developed in this work, the comments were removed and the code rebuilt, thus creating a new wrapper that contains the implementation of SetParentId (Gonçalves, 2005).
HUMAN/COMPUTER INTERACTION
An adequate GUI takes advantage of all the potentials of a computational system, from the graphics board to the mouse and other peripheral components, in order to make a computational program easier and more attractive to use.
In any interface, graphical or not, the user values the easiness and comfort in executing its intended tasks. Therefore, the key-points for implementing an adequate interface are its purpose and its target users. Thus, the choices and decisions to make along the development process of an interface must be based on the understanding of its users. This involves taking into consideration what users are good or less good at, what might help them in performing their tasks, hearing what they expect from the interface and involving them in the development process, as well as adopting techniques tested by them along the whole development. To sum up, we have to identify the users’ needs and, from there, create a useful, usable and pleasant interface.
Essentially, the development process of an interface involves four basic activities (Preece, 2002):
identify needs. It is necessary to study users’ behaviour and the way they usually perform their tasks in order to mould the interface to their needs;
idealize interfaces that answer to those needs;
develop different interactive versions of the interface so they can be used and compared by the users;
continually evaluate each phase of the development process.
These steps are complementary and shall be repeated as many times as necessary. By evaluating what was developed so far, new necessities arise and changes are made to the interface in development.
Because FastComp wasn’t finished yet, its graphical interface was idealized regarding the needs of its implementers since they were the only available users. Thus, through various and frequent conversations, the main aspects to focus on were determined and the GUI was developed.
While developing the graphical interface, security issues where regarded, such as preventing a process to evolve if the necessary input textboxes are empty or filled with invalid data, and the deactivation of menu items and/or buttons that can only be used after the fulfilment of certain previous requirements (Gonçalves, 2005).
As the interface to be developed needs to be intuitive, it is important to visualize the requested input data using interactive images, as well as a detailed description of each item, provided when the mouse cursor stops on them. These needs were considered in the developed
interface.
In this work, an evaluation of the interface was also taken to test its usability (Gonçalves, 2005). The results obtained are presented and discussed in the next sections.
THE DEVELOPED INTERFACE
As already mentioned above, for FastComp to work correctly it needs a text file containing all the input data referring to the composite bolted joint in analysis. To create this input file, the user has to define, using the graphical interface developed in this work, all the properties of the various materials used in the laminate, the structure of the laminate and of each of its lamina, the geometric data concerning the joint and the applied loads, as well as the failure criteria to be used in the calculations.
The developed interface starts by opening a main window that represents the user’s working environment. Starting a new analysis, or opening an already existing one, a single window is shown to input the data to be considered by the FastComp program. This window is divided in separator tabs, each one referring to different data domains: types of materials, Figure 1; laminate structure, Figure 2; plate geometry, Figure 3; applied loads, Figure 4; and failure options and indication of the desired output results, Figure 5. This structure was chosen due to its simplicity, which makes it easy to learn.
It should be noted that the interactive images included in separator tabs Joint geometry and Load case, Figures 3 and 4, whose purpose is to facilitate the understanding of the requested data, are entirely built using VTK classes.
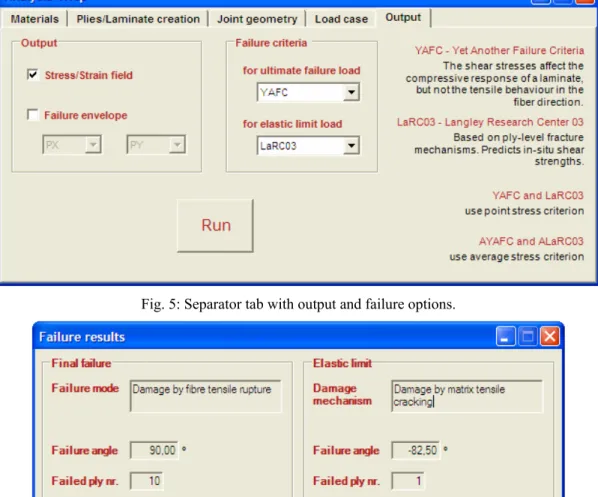
When the user presses button Run in the Output separator tab, Figure 5, a text file carrying all input data is created and FastComp automatically started. After that, as soon as FastComp ends, a window is opened to present the obtained failure results, Figure 6.
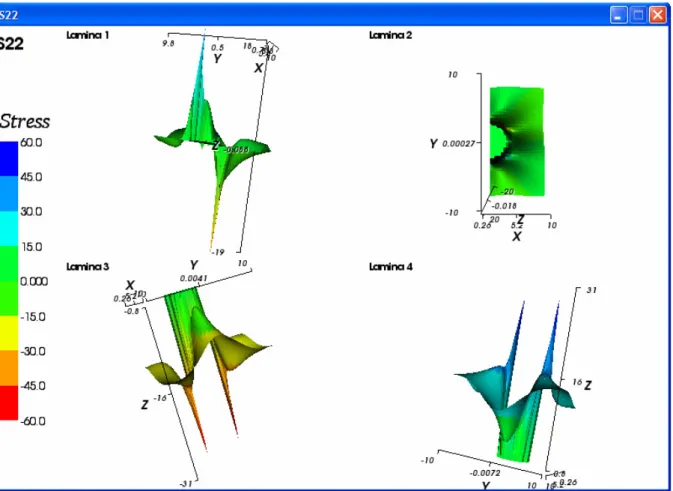
The Output menu of the graphical interface allows the visualization of, for example, the stress field in the yy axis direction. Thus, selecting s22 in the Output menu, Figure 7, a method is activated that reads the file with stress field data generated by FastComp, stores the relevant values in appropriate variables and processes data visualization using VTK. The final results obtained for this example are shown in Figure 8.
Fig. 2: Separator tab concerning laminate structure.
Fig. 3: Separator tab concerning joint geometry.
Fig. 5: Separator tab with output and failure options.
Fig. 6: Output window with failure results.
Fig. 7: Menu for selection the visualization of the results obtained by FastComp.
EVALUATION
Any user wants systems easy to learn and use, efficient, effective and safe. To know if all these requirements are satisfied, it is necessary to evaluate the developed interface.
While implementing an interface, developers must not assume that users think like them, nor presume that the fact that they followed all existing rules for the excellent execution of an interface is guarantee of good usability. Evaluation is always necessary to verify if users know
and like to use an interface.
During the first stages of development, the main goals of an evaluation of the interface are the prediction of usability, the perception of users’ requirements and the informal test of the adopted design.
Fig. 8: Graphical visualization of the output data concerning the stress field along the yy axis direction. To evaluate the interface developed in this work, a few users’ opinions were collected. The evaluation method adopted was a questionnaire distributed together with the interface to eight users who individually evaluated it in their usual work environment.
The developed questionnaire comprehended twenty four questions. The goal of the first ten questions was to define and characterize the user in terms of age, sex, academic qualifications, area of study/work and experience, theoretical and practical knowledge on composite materials and experience in the use of computers and graphical interfaces.
Different users demand different interface behaviour and appearance. For example, young users usually prefer an interface rich in extra options, like the possibility to modify the colours of a chart, while older users generally prefer a simpler and sober interface, which sticks to the strictly necessary so they don’t get distracted during its use.
Users with more knowledge and experience in the area the interface was developed for must be more critic than users who know little or nothing about the same domain. These last ones will probably be more interested in the graphical aspects of the interface, while the previous ones will be judging more its effectiveness, efficiency and utility.
Obviously, users with little experience in the use of graphical interfaces, or even computers, should have increased difficulties in the evaluation of such type of systems.
The next five questions of the evaluation questionnaire ask the user to evaluate and specify the difficulties he came across using each one of the separator tabs included in the input data window. The purpose of these questions is to identify possible improvements in items’ disposition and terminology.
The two following questions ask the user to evaluate if the two images included in the input data window serve their purpose, which is to help the user understand what the requested data are.
The next two questions intend to define the user’s difficulties using the Output menu and understanding the visualization of the results obtained by FastComp. The main purpose of the following question is to characterize the utility of the cartesian axes included in the graphical visualization of the output data.
The next three questions’ goal is the evaluation of the developed interface in more general terms. Thus, the first question characterizes the user’s difficulties using the interface; the second one asks the user to classify the interface aesthetically; and the third question asks for a general classification, accounting for all good and bad aspects identified in the interface. Finally, the last question on the evaluation questionnaire allows the user to make any suggestion/critic to improve the GUI developed that far.
RESULTS
Of the eight users inquired, only two are more than 30 years old, they are all male and all work in mechanical engineering. Five of the users have good theoretical knowledge on composite materials, but only four of these five have work experience with these materials. The other three users have little knowledge on composite materials; however, their evaluation has been considered as well, mainly for the purpose of design evaluation, because, as already referred, users with less knowledge in the area will give more relevance to graphical aspects. All of the eight users use the computer frequently, as well as graphical interfaces.
Analysing the results of the collection of opinion (Gonçalves, 2005) it can be concluded that the use of the input data window was not a problem for the users. Two of them encountered some difficulties but didn’t specify which ones.
Three of the eight users agree that the images included in separator tabs Joint geometry and Load case are not relevant to understand the input data, but don’t explain why. Perhaps this opinion relates to the fact that these users have good knowledge on composite materials and, therefore, do not need any extra aid in the understanding of the required data.
In general, the interface’s input data window seems to satisfy all users.
Three users say not to understand entirely the visualization of the results, but don’t specify why. However, one of them suggests the enlargement of the visualization windows, because, he says, it’s difficult to perceive the numerical values. This problem is probably due to the reduced size of the monitor used and can be solved in the future by implementing the option of visualizing in independent windows each one of the surfaces built to display the results obtained by FastComp.
Two of the users inquired for the evaluation of the developed interface do not like the cartesian axes included in the graphical visualization of the stress/strain fields. In a future version of the GUI, representation of these axes should be optional.
in separator tab Materials, to have the possibility to select materials whose properties are predefined;
to present a description of the way mouse buttons interact with the images; to identify the acronyms s11, s22, etc., used in the Output menu (Figure 7).
From 1 to 5, the interface scored an average of 4.75 for aesthetic classification and 4.63 for general classification.
CONCLUSIONS
The analysis of the results obtained in the evaluation of the developed interface allowed the detection of some new necessities, like the consideration of some predefined materials or the option to visualize each surface representative of the results obtained by FastComp in independent windows. Out of the same analysis we can also conclude that the developed interface is efficient and represents an adequate human/computer interaction for the FastComp software.
After the required alterations in the GUI to meet the detected users’ needs, a new collection of opinion should be carried out, preferably with a larger number of users. In addition, for a more complete evaluation, the users should be given concrete tasks so that specific issues of the interface can be evaluated. However, as there will always be users that do not specify their difficulties in detail, the collection of opinion should also be made throughout some interviews to clarify all doubts. Other types of evaluation can also be used, like the observation of each user interacting with the interface.
REFERENCES
Broughton, W., Crocker, L., Gower, M. Design Requirements for Bonded and Bolted Composite Structures. National Physical Laboratory Materials Centre, Teddington, Middlesex, UK, 2002
Camanho, P., Dávila, C. Failure Criteria for Prediction of Transverse Matrix Cracking in Composites. Comptest 2004, Bristol, UK, 2004
Frank, M., Skala, V. VTK for .NET platform. Diploma thesis - University of West Bohemia, Pilsen, Czech Republic, 2003
Gonçalves, P. Desenvolvimento de uma Interface Gráfica para o Programa FastComp. MSc Thesis (Computational Methods in Sciences and Engineering) - Engineering Faculty of the University of Porto, Portugal – Submitted December 2005
Petzold, C. Programming Microsoft Windows with C#. Redmond, USA: Microsoft Press, 2002
Portela, P., Melro, A. FastComp: Strength prediction of composite laminates containing stress concentrations using complex variable theory. Engineering Faculty of the University of Porto, Portugal, 2004
Preece, J., Rogers, Y., Sharp, H. Interaction Design: beyond human-computer interaction. New York, USA: John Wiley & Sons, 2002
Schroeder, W., Martin, K., Lorensen, B. The Visualization Toolkit. 2nd edition. New Jersey, USA: Prentice Hall, 1998
Sharp, J., Jagger, J. Microsoft Visual C# .NET Step by Step. Redmond, USA: Microsoft Press, 2003
Tavares, J., Barbosa, J. Apontamentos da disciplina de Visualização Científica. Master in Computational Methods in Sciences and Engineering. Engineering Faculty of the University of Porto, Portugal, 2004