Does wage reflect labor productivity?
A comparison between Brazil and the United States*
Os salários refletem a produtividade do trabalho?
Uma comparação entre o Brasil e os Estados Unidos
ALEXANDRE GORI MAIA** ARTHUR SAKAMOTO***
RESUMO: O trabalho compara a relação entre salários e produtividade do trabalho para diversas categorias de ocupados no Brasil e nos Estados Unidos. As análises destacam em que medida o equilíbrio entre salários e produtividade do trabalho está relacionado ao está-gio de desenvolvimento econômico. Os salários nos Estados Unidos têm se mostrado mais associados à produtividade do trabalho, enquanto o Brasil tem passado por diversos ciclos econômicos em que o rendimento cresce inicialmente muito mais rápido que a produtivi-dade, mas cai repentinamente nos anos subsequentes. As análises também destacam como a igualdade entre os diferenciais de renda e produtividade é válida para algumas categorias, mas não para outras.
PALAVRAS-CHAVE: Mercado de trabalho; estrutura ocupacional; desigualdade; desenvolvi-mento econômico.
ABSTRACT: The study compares the relationship between wages and labor productivity for different categories of workers in Brazil and in the U.S. Analyses highlight to what extent the equilibrium between wages and productivity is related to the degree of economic develop-ment. Wages in the U.S. has shown to be more attached to labor productivity, while Brazil has experienced several economic cycles were average earnings grew initially much faster than labor productivity, suddenly falling down in the subsequent years. Analyses also stress how wage differentials, in fact, match productivity differentials for certain occupational groups, while for others they do not.
KEYWORDS: Labor market; occupational structure; inequality; economic development. JEL Classification: J21; J24; J31.
Brazilian Journal of Political Economy, vol. 38, nº 4 (153), pp. 629-649,October-December/2018
* This study was supported by FAPESP – Fundação de Amparo à Pesquisa do Estado de São Paulo (grant number 2014/09678-2).
** Instituto de Economia da Universidade Estadual de Campinas – Unicamp, Campinas/SP, Brasil. E-mail: gori@unicamp.br.
INTRODUCTION
The relation between wages and labor productivity has been a source of sub-stantial controversy. Classic labor economic theory assumes that workers receive a salary equal to their marginal labor productivity, once labor market is perfectly petitive, this means, labor demand equals labor supply. Nonetheless, imperfect com-petition, which are triggered, for example, by informational asymmetries and insti-tutional factors, creates wedges between average productivity and average worker compensation (Manning, 2010). As a result, employers or workers can get rents from an existing employment relationship. Alternative views of wage formation also em-phasize the role of occupational and industry characteristics, human capital forma-tion, adjustment costs, erroneous expectations, or even discrimination that can make wages deviate substantially from labor productivity (Ilmakunnas & Maliranta, 2005). The first aspect in this analysis of labor market efficiency is to understand to what extent the equilibrium between wages and productivity is related to the degree of economic development. Comparing sub-Saharan countries, Biesebroeck (2011) indicated that the equality between wages and marginal productivity holds in the most developed country, but not in the least developed country. Biesebroeck (2005) also investigated the effectiveness of labor markets in several African countries and indicated that the reallocation mechanism is less effective than in the United States (U.S.). In the U.S., between the 1970s and the 2000s wages increased at approxi-mately the same pace of labor productivity, which more than double in the period (Feldstein, 2008). In Brazil, wages increased remarkably in the 2000s, although labor productivity had with few changes in most economic sectors, except for the technological revolution in the agricultural sector (Maia & Menezes, 2014).
A second important aspect is to determine the extent to which occupational characteristics are rewarded differently from their marginal productivity. Hellerstein et al. (1996) and Sakamoto and Kim (2014) compared relative productivity and relative wages for various groups of workers in the U.S.. Both studies highighted how, for certain social groups,wage differentials, in fact, match productivity dif-ferentials, while for others they do not. Hellerstein et al. (1996), for example, high-light that the relative wages of prime-aged workers (aged 35-54) and older workers (aged 55 and over) are significantly higher than estimated productivity differentials, especially for the later group. Sakamoto and Kim (2014) higlighted the substantial overpayment of college degree workers and managers, which means higher returns on wages than on labor productivity. Moreover, while professionals have a large positive wage premium, blue-collars have a significant negative premium. The au-thors then suggest that the labor market reward includes many noncompetitive but institutionalized employment relations that deviate substantially from the perfect-ly competitive economy of idealized models.
esti-mate the impact of occupational characteristics on the relation between productiv-ity and wages, examining which groups are rewarded more equally. The character-istics used in this analysis are occupation, education, age, education, sex and race. Brazil and the U.S. provide an interesting comparison, not only because they are the most representative developing and developed economies of America, but also because they experienced substantial economic changes in recent decades.
Results are based on the dynamics of the relative wages, defined in this study as a ratio between average wages and labor productivity. Empirical analysis of the relationship between wage and productivity is difficult, since the productivity of individuals is not observed, although their wages can be reasonably well measured in household surveys. However, if the individuals are aggregated to the industry level, the relation between productivity and wage should still hold. The panel data used in this analysis contain two hierarchical levels for the cross-section units (in-dustry sectors and occupational groups) and time series units for the period be-tween 1983 and 2013.
HISTORICAL BACKGROUND
Brazil and the U.S. presented remarkable, albeit divergent, trends in the dynam-ics of wages and labor productivity. Debt crisis in early-1980s introduced a long period of high inflation and low and unsteady growth in Brazil (Hermann, 2005). In the 1990s, Brazil reached success controlling hyperinflation, but some unpopu-lar economic reforms brought additional difficulties to the Brazilian labor market, contributing to increase unemployment, informality and to constrict real wages growth (BID, 2004). Several international crises, such as the Mexican crisis in 1994, Asian in 1997 and Russian in 1998 also contributed to the unsatisfactory
eco-nomic dynamics in Brazil (Galbraith, 2010). This country recovered the potential of economic growth in the 2000s, largely due to increasing prices of commodities and depreciation of its national currency. Indeed, the country showed strength in the last world economic crisis in late-2000s, exhibiting a better performance than many developed economies.
In the U.S., the most unstable period occurred in the 1970s, when the two oil-price shocks were responsible for periods of severe recessions (Eichengreen, 2004). Since then, the U.S. maintained a sustainable economic growth, reaching 3.3 percent per year in the 1980s and 3.4 percent per year in the 1990s, in spite of short periods of economic crises, such as savings and loan crisis in the early 1990s and dot com crisis in 2001 (Caldentey, Titelman & Pineda, 2009). But the financial crises in the late-2000s affected intensively the developed economies, especially the U.S. During the worst periods of the subprime crisis, initiated in 2007, the economic growth of the main developing countries overcame that of the developed ones. Unemployment grew remarkably and wages dropped fast for most occupational groups.
occupa-tional structure, which is still characterized by low-paid manual positions in agri-culture and in the service sectors of low productivity (Maia & Sakamoto, 2015). Economic growth in the U.S. has been more intensive in the use of skilled occupa-tions, which would justify the larger prevalence of skilled professionals and techni-cians in this country, a group that characterizes the middle and top classes in de-veloped capitalist societies (Acemoglu & Autor, 2010).
The low qualification of the Brazilian labor force also limits the productivity gains, a main determinant of income, quality of employment and socio-economic development (ILO, 2004). Despite some improvements in recent decades, the edu-cational attainment of the Brazilian labor force is still very low and the advances are having few or now impacts on labor productivity (Barbosa Filho, Pessôa & Veloso, 2010). The large supply of low-skilled and low-wage workers in Brazil also tends to squeeze wages in occupations at the bottom of the occupational structure and contribute to the low level of average productivity.
Economic growth and improvements in labor productivity would be essential to generate better opportunities of income and employment. However, the most significant changes observed in recent decades in Brazil are reported to be the significant increase in agricultural productivity and the reduction in the share of agricultural workers. This dynamics reflects, above all, (i) the advance of new and modern agriculture in the Midwest and Northern regions and (ii) the intergen-erational mobility of rural workers: young workers leaving their rural homes in search of new opportunities of income and employment in the urban areas (C. S. Sakamoto & Maia, 2012).
EMPIRICAL FRAMEWORK
Data source
The comparison between the dynamics of the gross value added (GVA) in Brazil and in the U.S. from 1983 to 2013 was based on time series of National Accounts provided by World Data Bank (WDB)1 and United Nation Statistical
Division (UNSD)2. We also used labor market information provided by microdata
of PNAD (Pesquisa Nacional por Amostra de Domicílios), sponsored by IBGE
(Instituto Brasileiro de Geografia e Estatística), and microdata of CPS (Current
Population Survey), sponsored by BLS (Bureau of Labor Statistics)3. The measure
1 Available at http://databank.worldbank.org. Access on March 2011. 2 Available at http://unstats.un.org. Access on March 2011.
3 In both surveys, employed has been considered that with 16 years of age or older who, during the
of GVA used in this study is based on the concept provided by the UNSD, this means, the value of outputs less the value of inputs, which covers: (a) value of materials and supplies for production (including cost of all fuel and purchased electricity); and (b) cost of industrial services received (mainly payments for con-tract and commission work and repair and maintenance work).
Although the dynamics of the GVA and labor earnings provide useful informa-tion to identify trends in the distribuinforma-tion of wage and profits in the labor market, it must be highlighted that wages and GVA may not be directly comparable in a specific point in time, since they are based on distinct methodologies (Barros, Foguel & Ulyssea, 2007; Hoffmann & Ney, 2008). Earnings in household surveys tend to be under-reported, as well as it is very difficult to measure some types of labor benefits. Differences may be more expressive in Brazil, where wages are based on monthly estimates (in the U.S. they are yearly estimates), which may be sub-jected to seasonality and periods of high volatility.
Annual earnings in the American CPS were divided by 12 to be comparable with the Brazilian monthly values of PNAD. Brazilian and American nominal labor earnings were deflated to constant values of July 2013 using the INPC (Índice
Nacional de Preços ao Consumidor) in Brazil and the CPI (Consumer Price Index)
in the U.S. Subsequently, Brazilian wages were converted to PPP (Purchasing Power Parity) dollars based on the conversion factor provided by WDB4. Similar
proce-dures were adopted to convert current values of GVA to PPP values of July 2013: using first the GDP deflator and second, just for Brazil, the PPP conversion factor. PPP is both a currency convertor and a spatial price deflator.
Economic activities were classified according to the main groups suggested by the UNSD: AB) agriculture, hunting, forestry and fishing; CE) mining and utilities (electricity, gas and water supply); D) manufacturing; F) construction; GH) whole-sale, retail trade, restaurants and hotels; I) transport, storage and communication; GP) other activities (financial intermediation, real state, renting, business activities, public administration, defense, education, health, social work, social services, per-sonal activities, private households and others services).
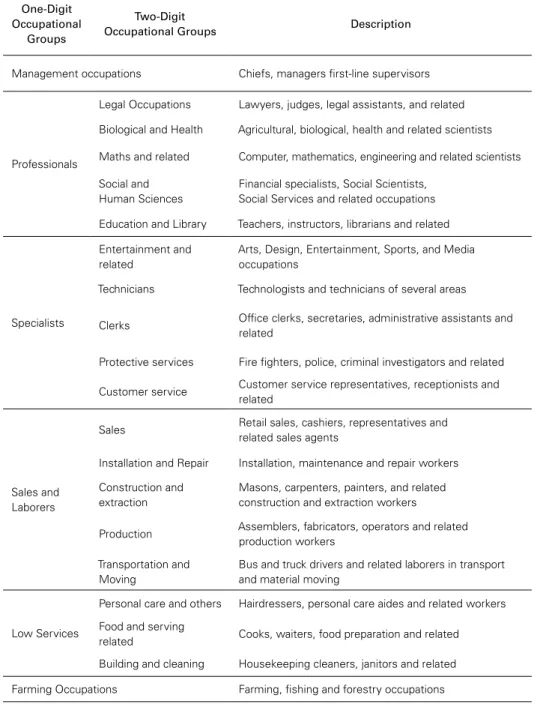
Occupational codes of PNAD and CPS were aggregated into 20 occupational groups (see Table 1). According to the analytical convenience, these 20 two-digit
occupational groups can also be analyzed into 6 one-digit occupational groups: 1) Managers; 2) Professionals; 3) Specialists; 4) Sales and Laborers; 5) Low Services; 6) Farming.
employed during the reference week and had made specific efforts to find an employment some time during the 4-week period ending with the reference week.
Table 1: One-digit and two-digit occupational groups
One-Digit Occupational
Groups
Two-Digit
Occupational Groups Description
Management occupations Chiefs, managers first-line supervisors
Professionals
Legal Occupations Lawyers, judges, legal assistants, and related
Biological and Health Agricultural, biological, health and related scientists
Maths and related Computer, mathematics, engineering and related scientists
Social and Human Sciences
Financial specialists, Social Scientists, Social Services and related occupations
Education and Library Teachers, instructors, librarians and related
Specialists
Entertainment and related
Arts, Design, Entertainment, Sports, and Media occupations
Technicians Technologists and technicians of several areas
Clerks Office clerks, secretaries, administrative assistants and
related
Protective services Fire fighters, police, criminal investigators and related
Customer service Customer service representatives, receptionists and
related
Sales and Laborers
Sales Retail sales, cashiers, representatives and
related sales agents
Installation and Repair Installation, maintenance and repair workers
Construction and extraction
Masons, carpenters, painters, and related construction and extraction workers
Production Assemblers, fabricators, operators and related
production workers
Transportation and Moving
Bus and truck drivers and related laborers in transport and material moving
Low Services
Personal care and others Hairdressers, personal care aides and related workers
Food and serving
related Cooks, waiters, food preparation and related
Building and cleaning Housekeeping cleaners, janitors and related
Farming Occupations Farming, fishing and forestry occupations
RELATIVE WAGES AND THE OCCUPATIONAL PREMIUM
The relative wage was defined as the ratio between average labor earnings and
average productivity. The relative wage W for the h-th occupational group in the
i-th economic sector is given by:
=
W Y L
GVA L hi
hi hi
i i
(1)
Where Y is the total labor earnings, L is the total employed population and
GVA is the total GVA. This means that W represents the relation between the aver-age earnings of an occupational group and the averaver-age productivity in each eco-nomic sector. Due to limited available data, analysis was restricted the 20 two-digit occupational groups and 6 economic sectors provided by UNSD. This means that there were 120 relative wages computed for each year, in Brazil and in the U.S.
For analytical simplicity, the average relative wage of the occupational group h
can also be computed. This statistic represents the weighted average relative wage for the h-th occupational group among the economic sectors, and can be computed as:
W
h=
Y
hi i=1
k
∑
Lhi i=1
k
∑
Lhi
(
GVAi Li)
i=1k
∑
⎡
⎣⎢ ⎤⎦⎥ i=1Lhi k
∑
=Y
hi i=1
k
∑
Lhi
(
GVAi Li)
i=1k
∑
(2)Where k is the total number of economic sectors.
The relative wage W can be determined by several factors. For example, oc-cupations that are more productive, i.e., that contribute more than others to GVA, tend to have higher wages in their respective economics sectors. The level of educa-tion and the years of work experience, for example, tend to affect productivity and, thus, relative wages. These factors can be observed through proxies given by, for example, the years of education and age. But there are other important factors that are not easily observable. For example, the demand and supply of jobs and institu-tional aspects, such as minimum wage and other labor compensations, that may differently affect the relation between wages and productivity between occupa-tional groups.
In order to control for socioeconomic characteristics that also affect relative wages, one regression model was fitted by ordinary least squares for each country. Estimates were based on a panel data with two hierarchical levels for the cross-section units (level one defined by 6 economic sectors, and level two defined by 20 two-digit occupational groups) and 31 time series units (from 1983 to 2013)5. The
dependent variable in both models was the logarithm (log) of relative wage. In other words, the models were given by:
5 Besides the absence of data for PNAD in the years 1991, 1994, 2000, and 2010, the sample used in
∑
∑
∑
β β φ δ δ γ
( )
= + + + + + += = =
W X cc cc year year e
ln
hit j j
j p
m m m m t
m
t m
i hit 0
1
0 1
5
1 5
hit 0 hit 0 hitx (3)
Where the subscript h=1,..,20 is the h-th occupational group, i=1..6is the i-th economic sector, t=0..30 is the time period. The variable Xjhit is the share (proportion,
ranging from 0 to 1) of the j-th socioeconomic group in the occupational group h, economic sector i and year t; 0ccm is the share of the m-th occupational group; year is the time period (year ranging from –30 for 1983 to 0 for 2013), and e is the un-predicted error. The coefficients β express the variation in the log relative wage given one percentage variation in X, f express the variation due to one percentage variation in the share of the m-th occupational group (sales and laborers used as reference), and the coefficients dm represent changes in these later relations across the years. The coefficient do represents the time trend for the occupational group of
reference (sales and laborers). Finally, the parameters gi representing the unobserv-able heterogeneity among the economic sectors are controlled by fixed effects.
We considered the following explanatory factors to control socioeconomic characteristics:
i. Education: the share of workers with less than secondary diploma (reference), less than college diploma (Less than Superior) and with superior diploma or more
(Superior or more);
ii. Age: the share of workers between 16 and 24 years old (reference), 30 and 49 years (30-49) and 50 years or older (50 or more);
iii. Race: the share of workers who reported to be white (White), black (Black) and other race/color (reference – brown, Asian, Indian, among others);
iv. Gender: the share of women (Female).
Besides theoretical adherence to applied studies of social inequality, the defini-tion of these variables was also based on the availability of informadefini-tion provided simultaneously by the American and Brazilian household surveys. Since the depen-dent variable is the log of relative wage and the independepen-dent variables are the share of each group (proportion ranging from 0 to 1), the coefficients represent the percentage variation in the relative wage due to one percentage point increase in the share of a respective group.
RESULTS
The dynamics of wages and productivity
Figure 1 gives a snapshot of the strong relation between labor productivity and average wage6. The average wages of the economic sectors (in US$ PPP) are
repre-6 The data, tables and figures used in this study are available at http://www4.eco.unicamp.br/docentes/
sented in the vertical axis and the labor productivities (also in US$ PPP) are repre-sented in the horizontal axis. The areas of the circles are proportional to the number of workers in each economic sector, within each country separately. The sector Mining
and Utilities (CE) is not represented in 2013, since its unusual labor productivity in
this year would make visual comparison difficult. Labor productivity in this sector is intrinsically related to the price of commodities, which grew unexpectedly in the late 2000, making GVA per worker soar to 21 thousand per worker in Brazil (8 times higher than the national average) and 25,000 per worker in the U.S. (2.5 times high-er than the national avhigh-erage). Nevhigh-ertheless, the numbhigh-er of workhigh-ers in this sector was not representative: 0.8% of the working population in Brazil and 1.6% in the U.S.
The sectors of Agriculture (AB), Construction and Wholesale (F), Retail Trade,
Restaurants and Hotels (GH) present the lowest labor productivities and average
wages, in both countries. On the other hand, the sectors of Manufacturing (D),
Transport, Storage and Communication (I), Mining and Utilities (CE) and Other
Activities (JP) present the highest labor productivities and average wages. The
for-mer sectors (AB, F and GH) are more representative in Brazil (42% in 2013, against 29% in the U.S.) and the later sectors (D, CE, I and JP), especially Other Activities
(JP), in the U.S. (71% in 2013, against 58% in Brazil).
Figure 1: Distribution of economic sectors1 according to average labor earnings
(Wage in US$ PPP), GVA per worker (GVA in US$) and number of workers (proportional circles) – Brazil and the U.S., 1983 and 20132
0 200 400 600 800 1000 1200 1400
0 1000 2000 3000 4000 5000 6000 7000 8000
Wa
ge
GVA
1983 2013 Linear (1983) Linear (2013)
JP
JP
F DD
I I F AB AB GH GH CE 0 1000 2000 3000 4000 5000 6000
0 2000 4000 6000 8000 10000 12000 14000 16000
Wage
GVA
1983 2013 Linear (1983) Linear (2013)
AB GH GH F F AB JP JP D D I CE
Source: Based on data from UNSD, WDB, CPS and PNAD. Values in US$ PPP of July 2013
1 AB) agriculture; CE) mining and utilities; D) manufacturing; F) construction; GH) wholesale, retail trade,
restau-rants and hotels; I) transport, storage and communication; JP) other activities
2 Exclusive sector Mining and Utilities in 2013
The dashed lines, which represent the linear trend between labor productivity and average wages, highlight how average wages tend to be relatively higher than labor productivity in some economic sectors – particularly, Other Activities (JP) – and lower in others – particularly, Agriculture (AB). Several factors help to explain differences in the relative wages, which can be exogenous, such as institutions and infra-structure, or endogenous factors, such as technological skills and labor force qualification.
which in turn affects social and human capital. And there are remarkable differ-ences in the composition of the occupation groups among the economic sectors (see Appendix A). For example, the sector Agriculture, Hunting, Forestry, Fishing, where relative wages tend to be lower than labor productivity, is almost exclusively com-posed by farming workers (especially in Brazil) characterized by low levels of skills and education. In turn, the sector Other Activities, which presents high relative wages, concentrates the most representative share of Professionals in both countries (23% in Brazil and 36% in the U.S.).
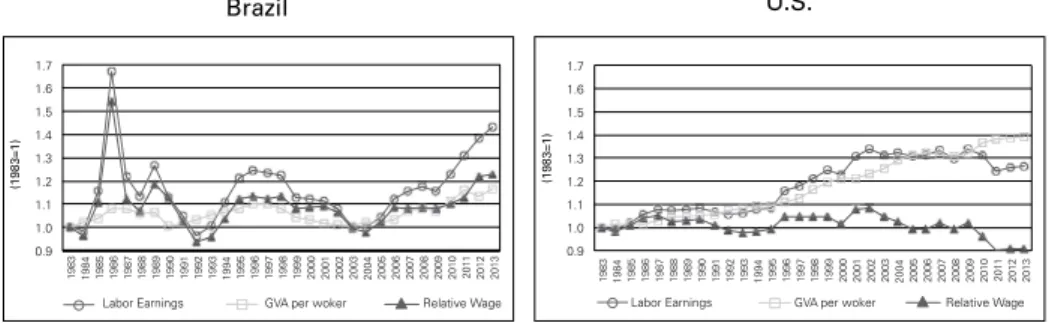
Since the linear trend in 2013 is above the trend in 1983, average wages are relatively higher than labor productivity. This is particularly true in Brazil, were average wages grew much faster than labor productivity. Nonetheless, in opposition to a steadier dynamics of labor productivity, average labor earnings in Brazil wit-nessed periods of high volatility between 1983 and 2013 (Figure 2). In the 1980s, labor earnings reached peaks during the Cruzado Plan I in 1986 and the Cruzado Plan II in 1989. However, due to the ineffectiveness of these economic adjustments, based on price freeze to control hyperinflation, labor earnings fell sharply in the short run to adjust for the dynamics of labor productivity.
Figure 2: Index ration (1983=1) for average labor earnings, productivity (GVA per worker) and relative wages – Brazil and the U.S., 1983 to 2013
Brazil U.S.
0.9 1.0 1.1 1.2 1.3 1.4 1.5 1.6 1.7
1983 1984 1985 1986 1987 1988 1989 1990 1991 1992 1993 1994 1995 1996 1997 1998 1999 2000 2001 2002 2003 2004 2005 2006 2007 2008 2009 2010 20
11
2012 2013
(1983=1)
Labor Earnings GVA per woker Relative Wage 0.9 1.0 1.1 1.2 1.3 1.4 1.5 1.6 1.7
1983 1984 1985 1986 1987 1988 1989 1990 1991 1992 1993 1994 1995 1996 1997 1998 1999 2000 2001 2002 2003 2004 2005 2006 2007 2008 2009 2010 20
11
2012 2013
(1983=1)
Labor Earnings GVA per woker Relative Wage
Source: Based on data from UNSD, WDB, CPS and PNAD.
Labor earnings were especially affected by the return of hyperinflation in the 1990s. In 1992 average labor earnings reached the lowest level in the whole period of analysis, pushing down relative wages. After several plans fail to control hyperin-flation, the Real Plan in 1994 brought stability to the economy and gave opportu-nity to a substantial valuation of labor earnings. However, four years later Brazil underwent a new cycle of economic crisis and wage squeezing with the outbreak of the Asian financial crisis in 1997. Foreign capital flew away and the Brazilian govern-ment was forced to apply a new fiscal adjustgovern-ment and a sharp devaluation of the national currency, which contributed to reduce both average earnings and GVA per worker. The economic crisis reached a peak in 2003, when the uncertainty generated by the change of government frightened away foreign investment. In 2004, average earnings, labor productivity and relative wages reached the same levels of 1983.
and the substantial valuation of the commodity prices. Between 2004 and 2013, labor productivity grew 26 percentage points. Influenced by the economic prosperity and important institutional changes, such as successive valuations of the minimum wage and increasing share of formal job positions in the labor market, average earnings grew 43 percent between 2004 and 2013. Because labor productivity grew more slowly (just 14 percent), relative wages reached the highest level since 1986.
In opposition to the unstable dynamics of labor indicators in Brazil, labor productivity grew almost steadily in the U.S., bringing together labor earnings. The main structural change happened in 2009 when, as a consequence of the financial crisis in 2007-08, unemployment grew strongly and labor earnings plummeted. Nonetheless, labor productivity continued growing and relative wages reached their lowest levels in three decades. After three decades, the overall result in the American labor market was still strongly positive: between 1983 and 2013 average labor earnings grew 26 percent and GVA per worker, 39 percent.
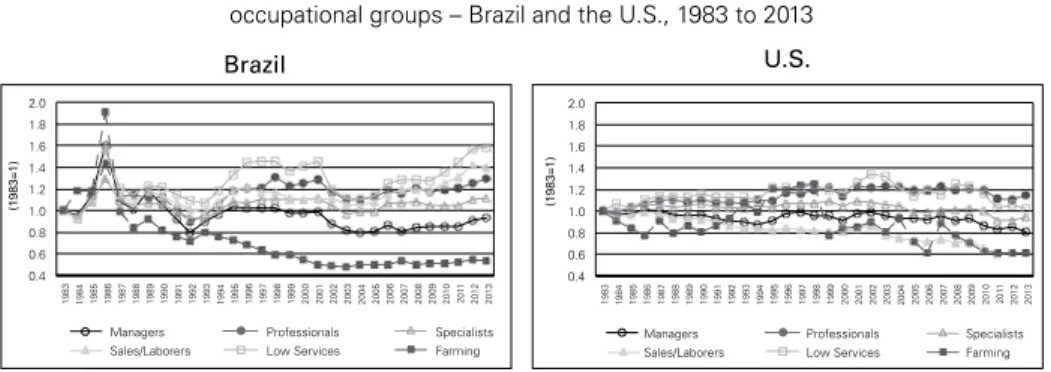
The rise of Brazilian relative wages in the 2000s was strongly influenced by the dynamics of the low-paid occupational groups: sales and laborers, and low
services (Figure 3) These two groups represent more than half of the occupational
structure in Brazil and had, together with professionals, the most striking increases in the relative wages during the whole period of analysis. The group low services, which represents low paid occupations in the service sector of the economy,
ac-counted for 19 percent of the Brazilian employed population and presented the lowest relative wage of the occupational structure (see Table 1 for information about percentage distribution, average earnings and labor productivity, and Appendix B for information about relative wages according to two-digit occupa-tional groups). The average labor earnings of this group grew 57 percent between 1983 and 2013 (the highest value in the occupational structure), although GVA per worker in their respective sectors did not grow in the period (Table 1). As a result, relative wages jumped from 0.124 in 1983 to 0.197 in 2013 (Appendix B).
Figure 3: Index ratio (1983=1) for relative wages according to one-digit occupational groups – Brazil and the U.S., 1983 to 2013
Brazil U.S.
0.4 0.6 0.8 1.0 1.2 1.4 1.6 1.8 2.0
1983 1984 1985 1986 1987 1988 1989 1990 1991 1992 1993 1994 1995 1996 1997 1998 1999 2000 2001 2002 2003 2004 2005 2006 2007 2008 2009 2010 20
11
2012 2013
(1983=1)
Managers Professionals Specialists Sales/Laborers Low Services Farming
0.4 0.6 0.8 1.0 1.2 1.4 1.6 1.8 2.0
1983 1984 1985 1986 1987 1988 1989 1990 1991 1992 1993 1994 1995 1996 1997 1998 1999 2000 2001 2002 2003 2004 2005 2006 2007 2008 2009 2010 20
11
2012 2013
(1983=1)
Managers Professionals Specialists Sales/Laborers Low Services Farming
Source: Based on data from UNSD, WDB, CPS and PNAD.
The sales and laborers group, which represents mainly sales workers and
is the most representative in the Brazilian occupational structure (38 percent in 2013) and presents the second lowest relative wage, even lower than that of the group of farming workers. The dynamics of relative wages in this groups was also determined mainly by the rising average earnings, since the average labor produc-tivity in their respective economic sectors did not rise in the period. The sub-group
of construction and extraction workers presented the most striking increase in the
relative wage (93 percent, shifting from 0.197 in 1983 to 0.380 in 2013), which would be mainly related to the growing demand of workers as a consequence of the housing boom witnessed in this country in the 2000s.
The group of farming workersis notably known in Brazil by its low levels of earnings and productivity. Nonetheless, the agricultural sector underwent a late technological revolution in recent decades, with the new frontier of agricultural development in the Brazilian Midwest. As a result, average labor earnings increased by 61 percent between 1983 and 2013 (the highest score in the occupational struc-ture) and GVA per worker soared more than twice. Since productivity grew faster than average earnings, relative wage reduced by 47 percent (from 0.581 to 0.308). Nonetheless, their lower levels of average earnings and labor productivity in com-parison with other occupational groups largely reflect regional heterogeneities in the systems of agricultural production (Maia & Sakamoto, 2014).
The group of professionals is represented by highly qualified workers, usually with a higher education diploma, with high average earnings (just lower than that of the group of managers). Their relative wage is the second highest in the occupa-tional structure and had a substantial growth between 1983 and 2013 (30 percent). The relative wage is extremely high for some occupations in this group. For ex-ample, in 2013 the relative wage was higher than 1 for legal, biological and health,
mathematics and related, and social and human sciences occupations. This means
that the average labor earnings of these groups was higher than the average GVA per worker in their respective economic sectors.
Finally, managers and specialists had few changes in their relative wages during the last three decades. The average earnings of managers, who control the capital or the labor force in public and private institutions, increased by just 5 percent between 1983 and 2013, while the GVA per worker in their respective sectors in-creased by 13 percent. As a result, relative wage reduced by 7 percent in the period.
Specialists, represented mainly by administrative support occupations and other
jobs in offices with intermediary qualification, had the second lowest variation in the average earnings in the period (just 16 percent), while the GVA per worker in their respective economic sectors increased by 4 percent. As a result, relative wage increased just 12 percent.
to Brazil, average earnings in the American agricultural sector grew more slowly than labor productivity between 1983 and 2013: 57 percent against 154 percent. Similar phenomenon was witnessed among sales and laborers, where average labor earnings increased by just 8 percent and labor productivity soared 74 percent.
The determinants of relative wages
Two regression models, one for Brazil and other for the U.S., were estimated by Ordinary Least Squares using the log of relative wage as dependent variable (equation 3)7. Industry-level heterogeneities were controlled by fixed effects. Results
allow us to examine the extent to which differentials of relative wages between occupational groups is due to their socioeconomic characteristics, for example, higher age or education, or due to an unobservable occupational premium, which means differentials that are not merely explained by social or productive charac-teristics. Surely, the accuracy of this analysis depends on the quantity and quality
7 We also tested different specifications of estimators for heteroskedastic standard errors, which gave
us similar results. For operational simplicity, we kept the OLS estimates that are more efficient under the traditional asymptotic theory.
Table 2: Percentage distribution (N %), average labor earnings (Wage) and GVA per worker (GVA) according to one-digit occupational groups – Brazil and the U.S., 1983 to 2013
Occupational Group
1983 2013
N
(%) Wage GVA
N
(%) Wage GVA
Brazil
Management 7 2,353 2,311 7 2,471 2,610
Professionals 5 1,567 2,667 10 2,099 2,752
Specialists 14 854 2,764 18 990 2,867
Sales and laborers 39 568 2,589 38 791 2,578
Low services 16 326 2,626 19 513 2,609
Farming 19 325 559 8 523 1,698
Total 100 695 2,219 100 996 2,582
U.
S.
Management 15 4,705 6,222 18 5,733 9,373
Professionals 16 4,426 9,629 23 5,817 11,053
Specialists 23 2,672 8,600 21 3,095 10,599
Sales and laborers 34 2,979 5,442 26 3,204 9,471
Low services 11 1,315 7,601 12 1,544 8,722
Farming 1 1,453 3,370 1 2,282 8,563
Total 100 3,197 7,150 100 4,042 9,957
of explanatory factors that are used to control wage and productive differentials. In this study, they were mainly limited by the information that was simultaneously available for Brazil and the U.S.
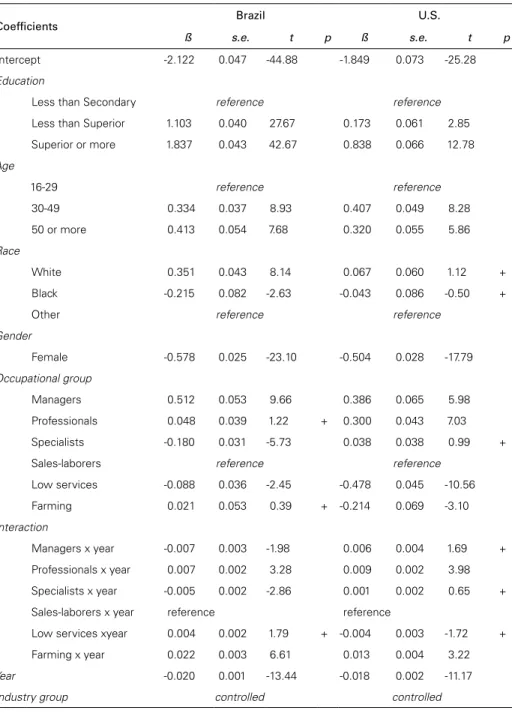
Both models, for Brazil and the U.S., fitted well to the sample of observations. The coefficient of determination was equal to 0.89 in Brazil and 0.63 in the U.S. The F statistics were significant at 0.01% in both countries. Table 3 presents the ordinary least square estimates for the coefficients (equation 3), which were also mostly significant at 5%.
A positive coefficient may be due to four reasons: i) positive variation of both average earnings and labor productivity, but in higher degree for average earnings; ii) positive variation for average earnings and no change for labor productivity; iii) no change for average earnings and negative variation for labor productivity; iv) negative variation for both average earnings and labor productivity, but in higher degree for labor productivity. Reason (i) is more likely to occur in the U.S., since productivity increased in most economic sectors. Reason (ii) is more likely to occur in Brazil, since productivity remained with few changes for most activities, with the exception of the substantial improvement in the agricultural sector. For analytical simplicity, we will say that average earnings increase faster than labor productivity. On the contrary, a negative coefficient would be mainly due to (i) positive variation for both average earnings and labor productivity, but in higher degree for labor pro-ductivity. In other words, labor productivity increases faster than average earnings.
Results highlight that differences between most groups is higher in Brazil. For example, when compared to basic education (less than superior), a one percentage point increase in the share of secondary education (less than superior) in Brazil would increase average relative wage in 1.103%. In the U.S. the partial effect is just 0.173%. Opportunely, the groups of education present the most striking differ-ences of relative wages in both countries, probably because average labor earnings tend to grow much faster than GVA per workers as the share of highly educated workers in the labor force increases.
Differences between age groups are also substantial in both countries. The high-er the share of adult (30 to 49 years) and oldhigh-er workhigh-ers (50 or more), the highhigh-er the average relative wages. In turn, this result suggests that the group of young workers (up to 29 years old) contributes more to reduce average wages than to affect labor productivity. Differences between groups of race are significant only in Brazil, where the increasing participation of white workers contributes to raise relative wages and the increasing participation of black workers contributes to reduce relative wages. In turn, differences of gender are substantial and similar in both countries: the higher the share of women workers, the lower the relative wages.
The coefficients for the occupational groups have the group sales and laborers
oc-cupational groups (partial effects) tend to be lower than that observed for the
unconditional averages (Appendix B).
Table 3: Ordinary least square estimates for the coefficients related to the dependent variable log relative wage – Brazil1 and the U.S., 1983 to 2013
Coefficients Brazil U.S.
ß s.e. t p ß s.e. t p
Intercept -2.122 0.047 -44.88 -1.849 0.073 -25.28
Education
Less than Secondary reference reference
Less than Superior 1.103 0.040 27.67 0.173 0.061 2.85
Superior or more 1.837 0.043 42.67 0.838 0.066 12.78
Age
16-29 reference reference
30-49 0.334 0.037 8.93 0.407 0.049 8.28
50 or more 0.413 0.054 7.68 0.320 0.055 5.86
Race
White 0.351 0.043 8.14 0.067 0.060 1.12 +
Black -0.215 0.082 -2.63 -0.043 0.086 -0.50 +
Other reference reference
Gender
Female -0.578 0.025 -23.10 -0.504 0.028 -17.79
Occupational group
Managers 0.512 0.053 9.66 0.386 0.065 5.98
Professionals 0.048 0.039 1.22 + 0.300 0.043 7.03
Specialists -0.180 0.031 -5.73 0.038 0.038 0.99 +
Sales-laborers reference reference
Low services -0.088 0.036 -2.45 -0.478 0.045 -10.56
Farming 0.021 0.053 0.39 + -0.214 0.069 -3.10
Interaction
Managers x year -0.007 0.003 -1.98 0.006 0.004 1.69 +
Professionals x year 0.007 0.002 3.28 0.009 0.002 3.98
Specialists x year -0.005 0.002 -2.86 0.001 0.002 0.65 +
Sales-laborers x year reference reference
Low services xyear 0.004 0.002 1.79 + -0.004 0.003 -1.72 +
Farming x year 0.022 0.003 6.61 0.013 0.004 3.22
Year -0.020 0.001 -13.44 -0.018 0.002 -11.17
Industry group controlled controlled
The group managers presents the highest positive differential of relative wage, in both countries. In other words, their positive differential of average earnings would be much higher than their contribution to increase labor productivity, even after socioeconomic characteristics are controlled for. In turn, the partial effect of
professionals is just significant in the U.S., where the differentials of average
earn-ings seem to be much higher than their impact on labor productivity. In Brazil, they present similar relative wages than sales and laborers, after socioeconomic charac-teristics are controlled for.
The groups of specialists, sales and laborers, low services and farming present the lower relative wages after socioeconomic characteristics are controlled for. In Brazil, specialists are more likely to be underpaid than other occupational groups: their relative wage is 16 percent lower than that of sales and laborers (e–0.180–1)
when other factors are controlled for. This is a peculiar result because, specialists
present an average relative wage 13 percent higher than sales and laborers (see Appendix B) when socioeconomic characteristics are not controlled for. Although
specialists tend to have higher level of education than sales and laborers, it seems
that they are not paid accordingly.
Finally, the coefficients associated with the variable year (ranging from -30 for 1983 to 0 for 2013) and its interactions with the occupational groups identify structural changes in the relation between the occupational structure and relative wages across the years. The group sales and laborers is used as reference again. Thus, the variable year identify the annual trend of relative wage for the group sales and
laborers, holding constant socioeconomic characteristics. The interactions between
year and the occupational groups identify how this growth rate differs from the previous one for each specific occupational group.
In both countries, there is an overall trend toward the reduction of relative wages. In other words, similar socio-occupational groups would be in a more un-favorable condition of labor earnings in relation to the average labor productivity in their respective economic sectors. In Brazil, this trend is more apparent among
blue collars, specialists and managers. In the U.S., among blue collars and low
services.
CONCLUDING REMARKS
Since the definition of average earnings and the GVA per worker were based on different approaches, relative wages in Brazil and in the U.S. cannot be directly comparable. For example, formal workers in Brazil have the right to receive an annual 13th wage and a vacation bonus8, which is not easily captured by monthly
self-reported measures in its household surveys. While in Brazil the Consolidation
of Labor Laws (CLT, or Consolidação das Leis do Trabalho) bring together most of the employees’ rights, in the U.S. the states have more autonomy to define the extent to which the benefits provided to workers and labor laws are more flexible, which is mainly used by employers to attract the most qualified workers.
Nonetheless, the comparison of the trends in the long run provides valuable insights to analyze how the relation between average earnings and labor productiv-ity were affected by structural changes in these countries. For example, the dynam-ics of labor earnings in the U.S. showed to be more attached to labor productivity, where both indicators exhibited substantial growth in the last three decades. The main change occurred with the outbreak of financial crisis in 2007-08, when, as a consequence of rising unemployment, average earnings plummeted while GVA per worker continued growing. Meanwhile, Brazil witnessed several economic cycles during which average earnings grew initially much faster than labor productivity, suddenly falling down in the subsequent years. The historical trend of relative wages in this country also raises serious doubts about the sustainability of its growth in the early 2000s. When compared to 1983, average earnings grew more than 40 percent in 2013, while labor productivity grew less than 20 percent. As a result, relative wages reached the highest value since 1986, attaining levels that did not show to be historically sustainable in the long run.
The differentials of relative wages among socioeconomic groups reinforce prior studies, highlighting how wage differentials match productivity differentials for some groups, but not for others (Sakamoto & Kim, 2014). For example, in-creases in the participation of highly educated (with secondary school diploma or more), prime-aged and older (aged 30 and over) and male workers tend to increase labor earnings more significantly than labor productivity. In turn, gender differen-tials are significant just in Brazil, where race also seems to determine more remark-ably wages than productivity.
The differences of relative wages among occupational groups also reinforce the theoretical hierarchy of classes among these social groups (Maia & Sakamoto, 2015). The group of managers, which aggregates both employers and hired manag-ers, presents the highest occupational premium, in both countries. But this result must be analyzed carefully, since differences between earnings and the firm surplus are not easily captured for small employers in household surveys. Nonetheless, Weeden and Grusky (2014) identify three main sources that could justify how
When compared to the group sales and laborers, the occupational premium of
professionals is significant just in the U.S. This later group is composed by highly
educated and highly paid occupations. In Brazil, professionals’ average wage is almost twice higher than that of sales and laborers, with few differences in the average labor productivity (just 7%). Nonetheless, a larger share of this wage dif-ferential seems to be explained by the net effect of the superior diploma: 77 percent of the professionals had a superior diploma in 2013, against 4 percent of sales and
laborers.
Specialists come before than sales and laborers in the hierarchy of the
occupa-tional structure, but their net impact on relative wages (occupational premium) is significantly lower than the latter group, which is historically characterized by lower levels of wage and education. In other words, specialists are not being paid accordingly to their levels of educational attainment and skills, which would be due to the growing supply of specialists with secondary diploma in Brazil. In fact, this group witnessed the second highest reduction in the occupational premium between 1983 and 2013, while the share of specialists with secondary diploma almost doubled, shifting from 36 percent to 61 percent.
Finally, the groups with the lowest occupational premium are: sales and
labor-ers, low services and farming. Occupations characterized by routinized activities
demand low levels of skills and education. In Brazil, the historical oversupply of unskilled and badly educated workers, many of them migrants from rural areas, help to explain their low levels of wage in relation to average productivity. In the U.S., the sharp progress in information and communication technologies would have stimulated employers to substitute labor for information technology in per-forming workplace tasks, especially in activities that could be easily routinized by computers (Acemoglu & Autor, 2010). Routine tasks are characteristic of many middle skilled cognitive and manual jobs in these bottom occupational groups, such as cashiers, assemblers, operators and production-related workers.
In Brazil, the rise of average earnings, especially among occupational groups on the bottom of the occupational structure in the last decade, seemed to be more influenced by institutional factors, such as the valuation of the minimum wage and the increasing share of formal workers under the labor legislation, than by eco-nomic factors, such as rising productivity. The only exception is the group of farm-ing workers, since relative wages in this group plummeted in last decades due to the substantial improvement of labor productivity in the agricultural sector, phe-nomenon that was also witnessed in the U.S.
in the supply of skilled professionals. But we must also to consider a potential source of heterogeneity within the categories of occupations and economic sectors used in this study. For example, differences between labor productivity across firms within the one-digit economic sectors may also help explaining the rising inequal-ity observed in the U.S. in the last decades (Card, Ana R, Heining & Kline, 2018; Song, Price, Guvenen & Bloom, 2015).
Surely, a more accurate analysis of these trends should be done using a firm level data on labor productivity. However, firm level data are not easily accessible for all economic sectors. There are also intrinsic difficulties to compare GVA between extremely diverse sectors. For example, while the GVA in the manufac-turing sector is estimated on the basis of the total production of goods, the GVA of public services available for free is estimated on the basis of the production costs assumed by the government. Thus, differences in the provision of public services can also affect labor productivity. Nonetheless, the methods recently used to compute national accounts have improved substantially to attenuate such dif-ficulties and provide a fair basis to analyze productivity in the short and long term (Piketty, 2014).
REFERENCES
Acemoglu, D., & Autor, D. (2010). Skills, tasks and technologies: implications for employment and earnings. NBER Working Paper Series, (16082), 154.
Autor, D. H. (2014). Skills, education, and the rise of earnings inequality among the “other 99 percent.” Science, 344(6186), 843–51. https://doi.org/10.1126/science.1251868
Barbosa Filho, F. D. H., Pessôa, S. D. A., & Veloso, F. a. (2010). Evolução da produtividade total dos fatores na economia brasileira com ênfase no capital humano - 1992-2007. Revista Brasileira de Economia, 64(2), 91–113. https://doi.org/10.1590/S0034-71402010000200002
Barros, R. P. De, Foguel, M. N., & Ulyssea, G. (2007). Desigualdade de renda no Brasil : uma análise da queda recente. Brasília: IPEA.
BID. (2004). Procuram-se bons empregos: o mercado de trabalho na América Latina. Washington: Banco Interamericano de Desenvolvimento.
Biesebroeck, J. Van. (2005). Firm size matters : growth and productivity growth in African manufactu-ring. Economic Development and Cultural Change, 53(3), 545–583.
Biesebroeck, J. Van. (2011). Wages Equal Productivity . Fact or Fiction ? Evidence from Sub Saharan Africa. World Development, 39(8), 1333–1346. https://doi.org/10.1016/j.worlddev.2010.12.002 Caldentey, E. P., Titelman, D., & Pineda, R. (2009). The current global financial crisis : What was really
‘ purely prime ’?
Card, D., Ana R, C., Heining, J., & Kline, P. (2018). Firms and Labor Market Inequality: Evidence and Some Theory. Jounral of Labor Economics, 36(S1), S13.
Eichengreen, B. (2004). Capital flows and crises. MIT Press.
Feldstein, M. S. (2008). Did wages reflect growth in productivity. NBER Working Paper Series2, (13953), 1–8.
Hellerstein, J. K., Neumark, D., & Troske, K. R. (1996). Wages, Productivity, and Worker Characteris-tics: Evidence from Plant-Level Production Function and Wage Equations. NBER Working Paper Series, June 1996(5626), 51.
Hermann, J. (2005). Auge e declínio do modelo de crescimento com endividamento: o II PND e a crise da dívida externa (1974-1984). In A. Villela, F. Giambiagi, J. Hermann, & L. B. Castro (Eds.), Economia Brasileira Contemporânea (1945-2004) (pp. 93–115). Rio de Janeiro: Elsevier. Hoffmann, R., & Ney, M. G. (2008). A recente queda da desigualdade de renda no Brasil : análise de
dados da PNAD , do Censo Demográfico e das Contas Nacionais. Econômica, 10(1), 7–39. Ilmakunnas, P., & Maliranta, M. (2005). Technology, labour characteristics and wage-productivity
gaps. Oxford Bulletin of Economics and Statistics, 67(5), 623–645.
ILO. (2004). World employment report 2004-2005: employment, productivity and poverty reduction. Geneva.
Maia, A. G., & Menezes, E. (2014). Economic growth, labor and productivity in Brazil and the United States: A comparative analysis. Revista de Economia Politica, 34(2). https://doi.org/10.1590/ S0101-31572014000200003
Maia, A. G., & Sakamoto, A. (2015). Occupational structure and the sources of income inequality: a comparison between Brazil and the U.S. In Anais do 43o Econtro Nacional da ANPEC (p. 22). Florianópolis.
Manning, A. (2010). Imperfect Competition in the Labour Market. CEP Discussion Paper, (981). Piketty, T. (2014). Capital in the twenty-first century. Cambridge, MA: The Belknap Press of Harvard
University Press.
Sakamoto, A., & Kim, C. (2014). Bringing Productivity Back In: Rising Inequality and Economic Rents in the U.S. Manufacturing Sector, 1971 to 2001. Sociological Quarterly, 55(2), 282–314. https:// doi.org/10.1111/tsq.12055
Sakamoto, C. S., & Maia, A. G. (2012). Dinâmica do mercado de trabalho agrícola e impactos sobre a distribuição de rendimentos nos anos 2000. Revista Da Abet, XI(2), 11–31.
Song, J., Price, D. J., Guvenen, F., & Bloom, N. (2015). Firming Up Inequality. CEP Discussion Paper, (1354), 36.
Weeden, K. A., & Grusky, D. B. (2014). Inequality and Market Failure. American Behavioral Scientist, 58(3), 473–491. https://doi.org/10.1177/0002764213503336
Appendix A: Percentage of workers according to one-digit occupational group and economic sector1 – Brazil and the U.S., 1983 and 2013
Brazil U.S.
7 8 6 4 1 1 14
19
3 8 40 36
1 1
64
48
68 66
90 88 65 60 75 71
12
5
19
25
16 19
5
4
8 8 17 14
28
31
4
9 2 2
1
2
1
1 2
15
23
6 4 6 10 8 8
3
6
12 12 4 5 5 5
0% 10% 20% 30% 40% 50% 60% 70% 80% 90% 100%
83 13 83 13 83 13 83 13 83 13 83 13 83 13
AB CE D F GH I JP Managers Professionals Specialists Sales/Laborers Low Services Farming
2 1 1 1
18 22 2 1
16 13
4 6
49 47
59 53 71 65 47 36
46 49
9 9 4 7 19 17 16 12 8 6 12 14 34 26
34
27
2 2
13
14
9
16
3
4 4 4
5
8
30
36
51 44
16 21 15 18 19 24 20 24
12 15 11 15
0% 10% 20% 30% 40% 50% 60% 70% 80% 90% 100%
83 13 83 13 83 13 83 13 83 13 83 13 83 13
AB CE D F GH I JP Managers Professionals Specialists Sales/Laborers Low Services Farming
Source: Based on data from CPS and PNAD.
1 AB) agriculture; CE) mining and utilities; D) manufacturing; F) construction; GH) wholesale, retail trade,
Appendix B: Average relative wages according to two-digit occupational groups – Brazil and the U.S., 1983 and 2013
Occupational Structure
Brazil U.S.
1983 2013 1983 2013
Management Occupations 1.018 0.947 0.756 0.612
Professionals 0.588 0.763 0.460 0.526
Legal 1.303 1.322 0.649 0.923
Biological and health 0.959 1.110 0.500 0.686
Maths and related 1.222 1.040 0.764 0.584
Social and human sciences 0.800 0.839 0.466 0.494
Education and Library 0.307 0.468 0.289 0.325
Specialists 0.309 0.345 0.311 0.292
Entertainment and related 0.436 0.370 0.395 0.372
Technicians 0.405 0.353 0.311 0.269
Clerks 0.286 0.350 0.295 0.278
Protective services 0.236 0.398 0.327 0.381
Customer service 0.357 0.237 0.316 0.243
Sales and laborers 0.219 0.307 0.547 0.338
Sales 0.276 0.356 0.608 0.453
Installation and Repair 0.270 0.331 0.695 0.374
Construction and extraction 0.197 0.380 0.405 0.435
Production 0.186 0.238 0.585 0.260
Transportation and Moving 0.230 0.261 0.481 0.248
Low services 0.124 0.197 0.173 0.177
Personal care and others 0.162 0.209 0.131 0.159
Food and serving related 0.185 0.258 0.267 0.207
Building and cleaning 0.087 0.164 0.146 0.170
Farming 0.581 0.308 0.431 0.266
Total 0.313 0.386 0.447 0.406