i
A LABEL-FREE IMMUNOSENSOR FOR
ELECTROCHEMICAL DETERMINATION OF
α-SYNUCLEIN
INÊS AURORA LUCAS COSTA MAIA
DISSERTAÇÃO DE MESTRADO APRESENTADA
À FACULDADE DE ENGENHARIA DA UNIVERSIDADE DO PORTO EM ENGENHARIA BIOMÉDICA
iv
v
“Genius is the ability to put into effect what is on your mind”
F. Scott Fitzgeraldvii
Resumo
A doença de Parkinson é a segunda doença neurodegenerativa mais comum mundialmente, depois da doença de Alzheimer. Cerca de 6 milhões de pessoas em todo o Mundo, e 13 mil só em Portugal, são afetadas por esta doença. Deste modo, é pertinente fazer a deteção da doença num estado ainda inicial. Atualmente, não existe nenhum teste laboratorial para efeitos de diagnóstico, por isso o desenvolvimento de um imunossensor para detetar um possível biomarcador para esta doença seria um avanço importante nesta área de investigação.
Os Corpos de Lewy têm um papel importante na propagação da patologia da doença de Parkinson. A proteína α-sinucleína é o principal constituinte deste corpos, sendo considerada um potencial biomarcador para a deteção da doença.
Os imunossensores eletroquímicos apresentam vantagens significativas comparativamente aos outros tipos de biossensores. Estes são portáteis, fáceis de utilizar, económicos e oferecem uma especificidade e sensibilidade elevadas, uma vez que são baseados na interação entre anticorpo e respetivo antigénio. A sensibilidade, especificidade e performance do sensor podem ser melhoradas através do uso de nanomateriais, como nanopartículas de ouro, grafeno ou nanotubos de carbono. Para além disso, estes materiais oferecem um microambiente favorável para a imobilização de proteínas. Deste modo, o objetivo deste trabalho é desenvolver um imunossensor para a deteção da α-sinucleína. O sensor desenvolvido tem por base um elétrodo de ouro modificado com quitosano e nanopartículas de ouro onde o anticorpo é incorporado para fazer o reconhecimento da α-sinucleína. Para caracterizar e avaliar a construção do imunossensor foram utilizadas técnicas voltamétricas, como a voltametria cíclica e de onda quadrada e a técnica de impedância.
Em condições ótimas, o imunossensor desenvolvido mostrou que a percentagem de aumento da corrente de pico relativa ao par Fe(CN)63-/4- é logaritmicamente proporcional à concentração de α-sinucleína numa gama linear desde 50 a 400 ng/mL, com um limite de deteção de 32 ng/mL.
ix
Abstract
Parkinson disease is the second most common neurodegenerative disorder after Alzheimer’s disease. Almost 6 million people worldwide and about 13 thousands just in Portugal are suffering from Parkinson. Thus, an earlier detection of this disease is extremely pertinent. Since there is currently no definitive laboratory test for diagnostic purposes, the development of an immunosensor for detection of Parkinson’s biomarkers can be part of the solution for this problem.
α-synuclein is the major component of Lewy bodies and plays an important role in the propagation of the pathology of Parkinson Disease. This protein is the most acceptable potential biomarker for this neurodegenerative disorder.
Electrochemical immunosensors have significant advantages compared to other biosensors. They are portable, easy to use, and cost effective and offer high sensitivity and specificity, since they are based on antigen-antibody reactions. The sensitivity, selectivity and performance of the sensor can be further improved by using nanomaterials, such as gold nanoparticles and graphene. These materials can also provide a suitable microenvironment for proteins immobilization.
Thereby, the purpose of this work was the development of an electrochemical immunosensor for α-synuclein detection. The developed sensor is based on a gold electrode modified with chitosan and gold nanoparticles to improve the biosensor performance. After this matrix has been done the antibody was embedded to later recognize α-synuclein. In order to characterize and evaluate the immunosensor construction, electrochemical techniques such as cyclic voltammetry, square-wave voltammetry and electrochemical impedance spectroscopy were used.
Under optimal conditions, the developed immunosensor shows that the percentage decrease of the Fe(CN)63-/4- peak current is logarithmically proportional to the α-Syn concentration over a range of 50 to 400 ng/mL with a detection limit of 32 ng/mL.
xi
Acknowledgements
First, I am deeply grateful to my supervisors Prof. Maria do Carmo Silva Pereira and Prof. Simone Barreira Morais for helping me whenever I need and for sharing their knowledge and experience with me.
Secondly, I want to thank to all members from GRAQ, especially to the electrochemistry group, such as Pedro, Helder, Raquel and João that always supported and helped me.
Finally, I must thank my mum, friends, family and my boyfriend for giving me the encouragement and possibility of being here today.
This work was financially supported by: Project UID/EQU/00511/2013-LEPABE, by the FCT/MEC with national funds and when applicable co-funded by FEDER in the scope of the P2020 Partnership Agreement.
xiii
Contents
Resumo vii Abstract ix Acknowledgements xi Contents xiii List of figures xvAbbreviations,acronyms and symbols xix
Chapter 1 - Introduction 1
1.1 Parkinson’s disease 1
1.2 Biomarkers for Parkinson’s disease 2
1.2.1 α-synuclein 3
1.2.1.1 Electrochemical biosensors for α-synuclein 4
1.3 Biosensors 5
1.3.1 Electrochemical Immunosensors 6
1.3.1.1 Nanomaterials based immunosensors 8
1.3.1.2 Antibody-antigen interaction 11
1.3.1.3 Immunoassays 11
1.3.1.4 Antibody immobilization techniques 12
1.4 Electrochemical Techniques 13
1.4.1 Cyclic voltammetry 14
1.4.2 Square-wave Voltammetry 15
1.4.3 Electrochemical Impedance Spectroscopy 16
1.4.4 Electrode materials 17
1.4.4.1 Carbon electrodes 18
1.4.4.2 Gold electrodes 18
1.5 Aim 19
Chapter 2 - Materials and Methods 21
2.1 Materials 21
xiv
2.3 Pre-treatment of the working electrode 22
2.4 Synthesis of AuNPs 22
2.5 Deposition of the CS layer 23
2.6 Antibody immobilization 23
2.7 α-Syn detection 24
Chapter 3 – Results and discussion 25
3.1 Characterization of the gold electrode surface 25
3.2 Characterization of the gold nanoparticles 26
3.3 Immunosensor assembly 27
3.3.1 Modification of the AuE with chitosan layer 27
3.3.2 Deposition of AuNPs onto CS/AuE 32
3.3.3 Antibody immobilization onto the AuNPs/CS/AuE 33
3.3.4 α-Syn detection 36
Chapter 4 – Conclusion 39
xv
List of figures
Figure 1.1 - Hypothesis on the development of premotor symptoms among persons who will or will not develop PD in lifetime [10].
Figure 1.2 - Schematic structure of α-synuclein [22].
Figure 1.3 - Scheme of the sensor developed by Yarui et al. [34]. Figure 1.4 - Scheme of the sensor developed by Yarui et al. [35]. Figure 1.5 - Typical elements of a biosensor [37].
Figure 1.6 - Different categories of biosensor [37].
Figure 1.7 - Schematic representation of electrochemical immunosensors [36].
Figure 1.8 - Illustration of different types of nanomaterials in the electrochemical immunosensors fabrication [48].
Figure 1.9 - An example of antibody-antigen interaction [90].
Figure 1.10 - a) Sandwich-type (non-competitive) immunoassay with a labeled-secondary antibody. b) Competitive-type immunoassay [41].
Figure 1.11 - Typical excitation signal for cyclic voltammetry [100]. Figure 1.12 - Waveforms employed and obtained in SWV [101].
Figure 1.13 - a) Idealized Nyquist plot for a redox active species in solution. b) Randles equivalent circuit for a redox active species in solution [46].
Figure 3.1 - Cyclic voltammogram of the tested gold electrode in 0.5 M H2SO4 aqueous solution at 100 mV/s scan rate.
Figure 3.2 - Zeta Size distribution of gold nanoparticles. Figure 3.3 - Zeta Potential of gold nanoparticles.
Figure 3.4 - Percentage increase of the peak current with different deposition potentials (CS 248KDa)(120s).
2
3
5
5
6
6
9
11
12
14
16
27
17
25
5
5
7
27
28
xvi
Figure 3.5 - Percentage increase of the peak current with different percentages of AuNPs and CS % (v/v) (-2V).
Figure 3.6 - Percentage increase of the peak current with different deposition time (AuNPs+CS 40% (v/v) (-2V)).
Figure 3.7 - Square-wave voltammograms obtained for anti-α-Syn/CnTs/CS/AuE (red) and CnTs/CS/AuE (blue). Profiles obtained in a 0.1 M PBS solution pH=7.4 containing 0.01M Fe(CN)63-/4-at a 0.405 V/s scan rate.
Figure 3.8 - Square-wave voltammograms obtained for anti-α-Syn/GP/AuNPs/CS/AuE (red) and GP/AuNPs/CS/AuE (blue). Profiles obtained in a 0.1 M PBS solution pH=7.4 containing 0.01M Fe(CN)63-/4-at a 0.405 V/s scan rate.
Figure 3.9 - Square-wave voltammograms obtained for CS/AuE (red), AuNPs/CS/AuE (blue) and AuNPs modified CS/AuE (grey) by electrodeposition. Profiles obtained in a 0.1 M PBS solution pH=7.4 containing 0.01M Fe(CN)63-/4-at a 0.405 V/s scan rate.
Figure 3.10 - Nyquist plot of electrochemical impedance spectra for bare AuE (red) and CS/AuE (blue). Profiles obtained in a 0.01M Fe(CN)63-/4- solution by applying a frequency range from 10-1 to 105 Hz with an amplitude perturbation of 5mV.
Figure 3.11 - Square-wave voltammograms obtained for CS/AuE (red), AuNPs/CS/AuE (blue). Profiles obtained in a 0.1 M PBS solution pH=7.4 containing 0.01M Fe(CN)63-/4-at a 0.405 V/s scan rate.
Figure 3.12 - Nyquist plots of electrochemical impedance spectra for bare AuE (black), CS/AuE (blue) and AuNPs/CS/AuE (red). Profiles obtained in a 0.01M Fe(CN)6 3-/4-solution by applying a frequency range from 10-1 to 105 Hz with an amplitude perturbation of 5mV.
Figure 3.13 - Square-wave voltammograms obtained for AuNPs/CS/AuE (blue) and Anti-α-Syn/AuNPs/CS/AuE at different antibody concentrations: 10 µg/mL (green), 7.5 µg/mL (grey), 5 µg/mL (black) and 2.5 µg/mL (red). Profiles obtained in a 0.1 M PBS solution pH=7.4 containing 0.01M Fe(CN)63-/4-at a 0.405 V/s scan rate.
Figure 3.14 - Square-wave voltammograms obtained for AuNPs/CS/AuE (red) and Anti-α-Syn/AuNPs/CS/AuE at different incubation times: 4h (blue), 7h (green) and 10h (grey). Profiles obtained in a 0.1 M PBS solution pH=7.4 containing 0.01M Fe(CN)63-/4-at a 0.405 V/s scan rate.
Figure 3.15 - Square-wave voltammograms obtained for Anti-α-Syn/AuNPs/CS/AuE (red) and BSA/Anti-α-Syn/AuNPs/CS/AuE at different incubation times: 10 min (blue), 20 min (grey) and 30 min (green). Profiles obtained in a 0.1 M PBS solution pH=7.4 containing 0.01M Fe(CN)63-/4-at a 0.405 V/s scan rate.
29
29
30
30
31
32
33
33
34
35
34
xvii
Figure 3.16 - Nyquist plots of electrochemical impedance spectra for AuNPs/CS/AuE (red), Anti-α-Syn/AuNPs/CS/AuE (blue) and BSA/Anti-α-Syn/AuNPs/CS/AuE (pink). Profiles obtained in a 0.01M Fe(CN)63-/4- solution by applying a frequency range from 10-1 to 105 Hz with an amplitude perturbation of 5mV.
Figure 3.17 - Nyquist plots of electrochemical impedance spectra for AuNPs/CS/AuE (red), BSA/Anti-α-Syn/AuNPs/CS/AuE (pink) and α-Syn/BSA/Anti-α-Syn/AuNPs/CS/AuE (green). Profiles obtained in a 0.01M Fe(CN)63-/4- solution by applying a frequency range from 10-1 to 105 Hz with an amplitude perturbation of 5mV.
Figure 3.18 -The several steps for the immunosensor construction.
Figure 3.19 - Nyquist plots of electrochemical impedance spectra for bare AuE (black), AuNPs/CS/AuE (red), Anti-α-Syn/AuNPs/CS/AuE (blue) BSA/Anti-α-Syn/AuNPs/CS/AuE (pink) and α-Syn/BSA/Anti-α-BSA/Anti-α-Syn/AuNPs/CS/AuE (green). Profiles obtained in a 0.01M Fe(CN)63-/4- solution by applying a frequency range from 10-1 to 105 Hz with an amplitude perturbation of 5mV.
Figure 3.20 - Percentage increase of the peak current with different deposition potentials (CS 248KDa) (120s).
35
37
37
36
38
xix
Abbreviations, acronyms and symbols
Acronyms and abbreviations list α-syn – α-synuclein
AADC – Aromatic amino acid decarboxylase Ab – Antibody
Au - Gold
AuE – Gold electrode AuNPs – Gold nanoparticles BSA – Bovine serum albumin CNTs – Carbon nanotubes CPE – Carbon paste electrode CS – Chitosan
CSF – Cerebrospinal fluid CT – Computerized tomography CV – Cyclic Voltammetry DA – Dopamine
DAT – Dopamine transporter DET – Direct electron transfer DLS – Dynamic Light Scattering DJ-1 - Parkinson disease protein 7 DNA – Deoxyribonucleic acid DWI – Diffusion weighted imaging
xx
EIS – Electrochemical Impedance Spectroscopy ELISA – Enzyme-Linked Immunosorbent Assay ET – Electron transfer
FDG – Fludeoxyglucose GR – Graphene
GO – Graphene oxide
HPLC – High-performance liquid chromatography IgG – Immunoglobulin G
ITO – Indium Tin Oxide
LDV – Laser Doppler Velocimetry LOD – Limit of detection
MRI – Magnetic resonance imaging mAb – Monoclonal antibodies NDs – Neurodegenerative diseases NSB – Non-specific binding
pAb – Polyclonal antibodies PD – Parkinson Disease
PET – Positron emission tomography Ret – Electron transfer resistance rGO – Reduced graphene oxide SAM – Self-assembled monolayer
SPECT – Single photon emission computed tomography SWV – Square wave Voltammetry
TCS – Transcranial sonography UA – Uric acid
VMAT2 – Vesicular monoamine transporter 2 Vs - Versus
xxi
Symbols list E - Potential I - Current K - Kelvin
∆E - Potential variation m - Meter µm - micrometer mg - milligram mL - milliliter M - Molar mM - Millimolar s - Second wt% - Percentage by mass % - Percent V - Volt (w/v)% - Mass concentration min - Minute nm - nanometer d - Diameter (v/v)% - Volumetric percentage Ip - Peak current
Parkinson’s disease 1
Chapter 1 - Introduction
1.1 Parkinson’s disease
Neurodegenerative diseases (NDs) are incurable conditions that result in progressive degeneration or loss of neurons in the affected individuals [1]. Parkinson disease (PD) is the second most common neurodegenerative disorder after Alzheimer’s disease [1,2]. PD affects about 0.3% of the general population including all ethnic and socioeconomic groups, with a slight predominance in males [1]. Its incidence and prevalence increase with age, affecting approximately 1% of people over the age of 65 and approximately 4% of the population aged over 80 years [1,3]. In Portugal, according to an epidemiological study developed this year, 13 thousands of people are diagnosed with Parkinson [4].
All the basic signs of PD relate to motor dysfunction and include resting tremor, bradykinesia, rigidity and postural reflex impairment [5,6]. Other manifestations include psychiatric symptoms such as anxiety and depression and dysautonomic symptoms such as hypotension and constipation, paresthesias, cramps, olfactory dysfunction, and seborrheic dermatitis [3,5]. As the disease progresses, decreased cognitive ability may appear [3,5].
Neuropathological hallmarks of PD are loss of dopaminergic neurons in the substantia nigra and the formation of intraneuronal protein inclusions termed Lewy bodies, composed primarily of α-Synuclein [1,2,6]. Symptoms do not develop until about 50–60% of the nigral neurons are lost and about 80–85% of the dopamine content of the striatum is depleted [5].
The diagnosis of PD currently relies on clinical assessment, with the application of diagnostic criteria, such as the UK Brain Bank diagnostic criteria [7,8]. However, this diagnosis can be difficult, at initial presentation when clinical symptoms are subtle or only early premotor symptoms might be present (figure 1.1) [7]. There is currently no definitive laboratory test for diagnostic purposes. Thus, it is necessary to develop new and effective techniques for an earlier diagnosis that will allow therapy and disease prevention [9].
2 Introduction
Figure 1.1 - Hypothesis on the development of premotor symptoms among persons who will or will not develop PD in lifetime [10].
1.2 Biomarkers for Parkinson’s disease
A biomarker is defined as a “characteristic that is objectively measured and evaluated as an indicator of normal biologic processes, pathogenic processes, or pharmacologic responses to a therapeutic intervention” [1,6]. Such biomarkers can be used in the clinic to diagnose, predict disease progression, monitor the activity of the disease, assess therapeutic response, or guide molecular targeted therapy [8]. Biomarkers can be classified into molecular biomarkers and imaging biomarkers (CT (Computed Tomography), PET (Positron emission tomography), SPECT (Single-photon emission computed tomography), and MRI (Magnetic resonance imaging)) [6]. Molecular biomarkers include nucleic acids-based biomarkers such as gene mutations or polymorphisms, gene expression analysis, peptides, proteins, lipid metabolites, and other small molecules [6].
A consensus report for biomarkers suggested that the ideal biomarker should detect a fundamental feature of neuropathology, be validated in neuropathological confirmed cases, have a diagnostic sensitivity and specificity of >80% [11,12]. Biomarker collection should also be reliable, reproducible, non-invasive, simple to perform, inexpensive, and it should be investigated by at least two independent studies [11,12].
Recently, many authors have focused their attention on the investigation of potential biomarkers for PD. Several studies have found possible biomarkers for PD, including genetic biomarkers (PARK 1, 2, 4, 6, 7, 8) [6,13], imaging biomarkers (AADC (18F-dopa), DAT, VMAT2, FDG network, TCS (transcranial sonography) and MRI (DWI, iron deposit)) [12,14-16], protein-based biomarkers (α-Synuclein, DJ-1 , amyloid-β and tau protein [6,7,12,17,18]) and biochemical biomarkers such as uric acid and dopamine [19,20]. Although, α-Synuclein was shown to be the most acceptable potential biomarker for PD [1,7,11,21]. In this study α-Synuclein is the biomarker that will be explored.
Biomarkers for Parkinson’s disease 3
1.2.1 α-synuclein
α-synuclein (α-syn) is a small protein (~14 kDa) comprising 140 amino acid residues encompassing the positively charged N-terminus (residues 1-60), the aggregation-prone non amyloid components (NAC, residues 61-95), and the negatively charged C-terminus (residues 96-140), as can be seen in figure 1.2 [22-24]. The exact physiological function of α-syn remains not yet defined [25], but several works have investigated its role in neurodegenerative diseases including PD. This protein is mainly expressed by neuronal cells, and is generally considered to exist as a cytoplasmic and lipid vesicle associated protein [2]. Although, recently it was shown that neural cells also release α-syn into their conditioned culture medium, and that α-syn can be found in cerebrospinal fluid (CSF) and peripheral plasma [2,13,24,26–28]. Notably, secreted α-syn can impact neuronal homeostasis and lead to neuronal death, even at concentrations close to those identified in biological fluids [27]. In addition, oligomeric-aggregated α-syn species appear to be predisposed to uptake and have the potential to “seed” fibrillation of endogenous α-syn [2]. This observation could potentially explain the propagation of pathology observed in PD, according to the Braak hypothesis of staging of the disease [2]. Moreover, α-syn is a major component of Lewy bodies and Lewy neurites found in sporadic cases [25]. Thus, the quantification of extracellular α-syn in body fluids could be used as a biomarker in order to develop diagnostic tests for PD.
Figure 1.2 - Schematic structure of α-synuclein [22]
The gene encoding α-syn (SNCA) is mutated in rare inherited forms of PD, resulting in amino acid substitutions (A53T, A30P, or E46K; classified as PARK1) (figure 1.2), or multiplication of its allele (PARK4) [25,26].
Brit Mollenhauer et al. [27] and Malin Wennstrom et al. [29] showed that CSF α-syn values differed significantly between Parkinson’s disease and Alzheimer’s disease and that low mean CSF α-syn concentrations were detected in patients with an synucleinopathy (PD, multiple system atrophy, and dementia with Lewy bodies) compared with other disorders. Takahiko Tokuda et al. [2] and Brit Mollenhauer et al. [27] found that CSF α-syn
4 Introduction
concentrations measured by ELISA are significantly lower in patients with Parkinson’s disease. Min Shi et al. [9] found a trend of decrease α-syn plasma levels in patients with Parkinson’s or Alzheimer’s disease compared with healthy controls. Although no statistical difference was observed, which shows that α-syn in plasma alone is not useful as biomarker for PD diagnosis. In the cerebrospinal fluid (CSF), most studies appear to show a reduction of total α-syn levels in PD patients compared with controls [12,26]. A recent review article by Brit Mollenhauer [11] investigated if the syn is an ideal biomarker for PD. The author concluded that CSF α-syn fits some criteria for an ideal biomarker according to the consensus report, but there are still aspects to address and major drawbacks for the introduction in the clinical routine [11]. Although, this protein is considered the most acceptable biomarker for PD but it still needs more investigation and more studies to fortify this idea.
1.2.1.1 Electrochemical biosensors for α-synuclein
After an extensive research on several platforms, only six original research articles were found about biosensors for α-syn. Of this group of six, only two were about electrochemical immunosensors for the protein.
Dmytro Yushchenko et al. [30] introduced sensor molecules consisting of covalent adducts of Ala-to-Cys mutants of α-syn with a thiol-reactive (maleimide) probe (MFC) based on 2-(2-furyl)-3-hydroxychromone. These are representative of the new, versatile excited-state intramolecular 3-hydroxyl ⇁ 4-carbonyl proton transfer (ESIPT) probes of amyloid aggregation, with unprecedented sensitivity for the initial stages of reaction.
Mihaela Dragusanu et al. [31] developed an on-line combination of a surface acoustic wave (SAW) biosensor with electrospray ionization mass spectrometry (SAW-ESI-MS) that identifies immobilized anti-α-syn–human/α-syn complex on a biosensor chip.
Daekyun Lee et al. [32] introduced surface-enhanced Raman scattering (SERS)-active gold nanoparticles (AuNPs) individually isolated with an ultrathin α-synuclein shell and their 2-D array into a tightly packed monolayer on a glass support, which permits a quantitative SERS measurement of phthalocyanine tetrasulfonate (PcTS), a chemical ligand of the pathological protein.
Michal MasaroeÌk et al. [33] developed an electrochemical biosensor for aggregated α-syn based on electrochemical methods, such as current chronopotentiometric stripping analysis (CPSA) to measure hydrogen evolution catalysed by α-syn (peak H) at hanging mercury drop electrodes (HMDE) and square-wave stripping voltammetry (SWSV) to monitor tyrosine oxidation at carbon paste electrodes (CPE).
Yarui An at al. [34] utilized Au-doped TiO2 nanotube arrays to design a photoelectrochemical immunosensor for the detection of α-syn. This immunosensor exhibit a linear range from 50 pg.mL-1 to 100 ng.mL-1 and a limit of detection (LOD) of 34 pg.mL-1. The scheme of the sensor is represented in figure 1.3.
Biomarkers for Parkinson’s disease 5
Figure 1.3 - Scheme of the sensor developed by Yarui et al. [34].
The same authors, Yarui An at al. [35], in the following year developed an electrochemical immunosensor for α-syn based on dual signal amplification using PAMAM dendrimer-encapsulated Au and enhanced gold nanoparticle labels. This immunosensor exhibits a better performance than the developed before, showing a linear range from 20 pg.mL-1 to 200 ng.mL-1 and a LOD of 14.6 pg.mL-1. The scheme of the sensor is represented in figure 1.4.
Figure 1.4 - Scheme of the sensor developed by Yarui et al. [35].
1.3 Biosensors
Biosensors technology has emerged as one of the most promising platforms for studying proteins [36]. A biosensor is commonly defined as an analytical device that uses a biological recognition system to target molecules or macromolecules [37]. Typically biosensors are comprised of three components, a bioreceptor, a transducer and the signal processing system [36–38]. The bioreceptor generally consists of an immobilized biocomponent that is able to detect the specific target analyte, and could be composed of antibodies, nucleic acids,
6 Introduction
enzyme, cell and etc. [37]. The transducer is a converter, since it converts the biochemical signal into an electric signal and can be electrochemical, optical, piezoelectric, magnetic or calorimetric [36]. Lastly, the electrical signal is amplified and sent to a microelectronics and data processor [37]. A typical biosensor construction is shown in figure 1.5.
Figure 1.5 - Typical elements of a biosensor [37].
Biosensors can be applied to a large variety of samples including body fluids, food samples, and cell cultures and be used to analyse environmental samples [39]. These devices provide advanced platforms for biomarker analysis with the advantages of being easy to use, inexpensive, rapid and robust as well as offering multi-analyte testing capability [37,40].
Biosensors can be classified either by the type of biological signalling mechanism they utilize or by the type of signal transduction they employ (Figure 1.6) [37].
Figure 1.6 - Different categories of biosensor [37].
1.3.1 Electrochemical Immunosensors
Immunosensors are of great value for use in clinical testing, because they are based on antigen-antibody reactions which are highly sensitive and specific, since they combine the inherent specificity of immunoreactions with high sensitivity and convenience of various
Biosensors 7
physical transducers [41,42]. An antibody based biosensor was applied for the first time in the 1950s, leading the possibility of immune-diagnosis [37,41,43]. In developing immunosensors, the immobilization of antibody is an important step because antibody acts as the recognition element for antibody-antigen reaction [37,41,43].
There are two types of detection methods which are frequently used in immunosensors, optical and electrochemical (amperometric, potentiometric, conductometric, capacitative) [41]. Recently, the role of electrochemical immunosensors in clinical analysis has increased significantly [42]. Important developments have been recorded especially in sensor design concerning the type of the membrane selected, transducers and the immobilization technique [37,42]. The electrochemical immunosensors (Figure 1.7) rely on the measurements of currents and/or voltage to detect binding between antibody and antigen [41,44].
Figure 1.7 - Schematic representation of electrochemical immunosensors [36].
In potentiometric measurements, the potential difference between a working and a reference electrode is determined by a voltammeter when there is no significant current flowing through them [41]. The potential difference is measured due to the oxidation and reduction of the species in sample solution [41]. This technique relies on the use of an ion-selective electrode and ion-sensitive field effect transistor for obtaining the analytical information [37].
In amperometric measurements, a current occurs as a result of electrochemical oxidation or reduction of an electroactive species [41]. This type of measurement is taken by maintaining a constant amplitude voltage at working electrode (gold, platinum or carbon) related to reference electrode, under a fixed potential, current pass through sample [41] The amperometric transduction can be integrated with enzymes, nucleic acids and an immunosensors biological element recognition [43].
Impedimetric immunosensors can be used to determine quantitative parameters of electrochemical properties, since when biorecognition elements occur at the modified surfaces, the interfacial properties change [41]. Each reaction process represented by an electric circuit consists of resistance, capacitors, or constant phase elements combined in parallel or in series [40,42]. The most favorite model of electric circuit for a simple electrochemical reaction is the Randles-Ershler electric equivalent circuit model [41,45,46].
In conductometric measurements, there is a relationship between a biorecognition event and conductance [41]. While a reaction, a change in the ionic species concentration leads to change the solution’s electrical conductivity or current flow [41]. The conductometric device is made of two electrodes which are separated by a certain distance or by a medium [40,42].
8 Introduction
Electrochemical immunosensors are of great interest, since they are portable, simple, easy to use, cost effective and disposable in most cases and can offer high speed and multitarget analysis and miniaturization [36,40,42,46]. An efficient immunosensor must achieve high capture efficiency (defined as the ratio of the number of antigens captured to the maximum available antibodies) in minimum time [47].
Several electrochemical immunosensors have been employed for antigen detection in many diseases [35,48–62].
1.3.1.1 Nanomaterials based immunosensors
Recent years have faced interesting developments in the functionalization of electrode surfaces with biological materials, especially due to the significant input of nanotechnology [63]. Nanotechnology plays an important role in the development of biosensors. The sensitivity, selectivity and performance of bioelectrodes (enzymatic biosensors, DNA sensors, immunosensors and cell sensors) are improved by using nanomaterials through new signal transduction technologies [40,42,63,64].
Nanomaterials attractiveness relies not only on their ability to act as effective immobilization matrices, such as enhancement of long-term stability of bioelectrochemical devices, but also on their intrinsic and unique features (large surface areas, electrocatalytic properties, controlled morphology and structure, possible use as labels) that can be advantageously combined with the functioning of biomolecules [63].
The unique properties of nanomaterials to provide a suitable microenvironment for proteins immobilization, maintaining their bioactivity, and at the same time facilitating electron transfer between their redox center and electrode surfaces, have led to an intensive use of different nanostructured materials for the construction of electrochemical biosensors with enhanced analytical performance [65]. In a typical development of nanomaterials based immunosensors (figure 1.8), nanomaterials are firstly attached on the electrode, and capture probes are then immobilized on the nanomaterials modified electrode [66]. These modified surfaces provide a considerable large area for the immobilization of antibodies and more conformational freedom, resulting in a higher binding affinity to target [40,66].
Biomarkers for Parkinson’s disease 9
Figure - 1.8 Illustration of different types of nanomaterials in the electrochemical immunosensors fabrication [66].
Several nanobiosensor architecture-based mechanical devices, optical resonators, functionalized nanoparticles, nanowires, nanotubes, and nanofibers have been in use [48,63]. As nanobiosensor technology becomes more refined and reliable, it will eventually make lab-on-a-chip devices for rapid screening of a wide variety of analyses at low cost [63]. In particular, nanomaterials (gold nanoparticles [35,48,50,65,67], carbon nanotubes [51,68,69], graphene [19,20,70,71], magnetic nanoparticles [72,73] and quantum dots [40]) have been actively investigated for their applications in biosensors, which have become a new interdisciplinary frontier between biological detection and material science [42,63,72,74].
1.3.1.1.1 Gold nanoparticles
Nanostructured particles of noble metals, especially gold nanoparticles (AuNPs) are in great demand depending on their excellent properties, such as high surface energy, strong adsorption ability, biocompatibility, enhanced electrical conductivity, and excellent catalytic activity [65,67] and also potential applications in the field of physics, chemistry, biology, medicine and materials science and in their different interdisciplinary fields [75]. AuNPs are one of the most commonly used nanomaterials in the field of electrochemical biosensing. In general, compared to the gold electrode, Au nanolayer provides faster electron transfer kinetics and causes a decline in residual voltage [75]. Nanoparticle coated Au surfaces can attach strongly to the functional groups such as -CN, -NH2 or -SH [75].
Several studies in literature use AuNPs for the development of sensitive sensors to specific molecules, such as casein, bovine serum albumin, and human immunoglobulin (IgG) [76,77]) and in the detection of antigens for cancer and neurodegenerative diseases [34,35,48,50,52,53,67,76].
10 Introduction
1.3.1.1.2 Graphene
Graphene (GR) is one of the most exciting materials being investigated today with numerous potential applications [78]. GR, a two-dimensional single layer of graphite, exhibits a large specific surface area, high thermal and good electrical conductivity, great mechanical strength and potential low manufacturing cost [70,71,78,79]. Thus, theoretically GR is an ideal support substrate.
Chemically converted graphene can be prepared by reduction of graphene oxide [71]. GR and its derivatives may have various potential applications such as, electrocatalysis, super-capacitor, biomedicines, mechanic resonators, and biosensors [71,78,79].
Graphene embedded in the interface of biological sensors can increase the effective surface area of electrode and enhance direct electron transfer between biomolecules and electrodes, because of the oxygen groups on graphene surface [79]. Thus, graphene-modified electrodes could be useful for the development of simple and effective electrochemical biosensors [79].
1.3.1.1.3 Carbon Nanotubes
Carbon nanotubes (CNTs) are often used in the construction of electrochemical sensors due to their extraordinary properties including high strength and flexibility, high thermal and electrical conductivity, large surface areas, excellent electron transfer rates, and low density [80–83]. The combination of functional material with carbon nanotubes is of increasing importance due to its simplicity of construction and ability to incorporate biorecognition elements into its porous structures [80]. CNTs can be both single walled CNTs (SWCNTs) and multi-walled CNTs (MWCNTs). MWCNTs are significantly easy to produce making them pertinent for large-scale applications [84]. A careful functionalization of CNTs makes them biocompatible for their use as biosensors [84,85].
1.3.1.1.4 Chitosan
Chitosan (CS) is a cationic polysaccharide that can be produced by the deacetylation of chitin monomer [49,50,68]. CS exhibits excellent properties such as good film forming ability, abundant amino groups, high water permeability and biocompatibility [49,50,68]. The attraction to CS lies in its substantial amine groups that can support functional manipulations such as the direct binding of nanoparticles for further antibody immobilization [56,61].
Recently, CS has been used in many studies for biosensors development [49,50,54–62,86– 88]. However, CS has poor electrical conductivity and requires an additional conducting material such as AuNPs, CNTs or GP for electrochemical immunosensors fabrication.
Biosensors 11
1.3.1.2 Antibody-antigen interaction
The immune system has the capability to distinguish self from nonself [42]. This specificity is essential for immunosensors development. Antibodies are complex glycoproteins produced by the organism to bind target molecules, namely, antigens. [41,89]. Antigens can be a variety of different molecules, from protein to DNA, lipids, etc. [41]. Five antibody classes exist in humans (IgA, G, D, E and M) [89].
There are two types of antibodies, polyclonal and monoclonal [36,40]. Polyclonal antibodies (pAb) have an affinity for the target antigen, and are directed to different binding sites, with different binding affinities [36,40]. Monoclonal antibodies (mAb), on the other hand, are identical, once they are produced from one type of immune cell, showing higher sensitivity and selectivity than pAb [36,40]. An example of antibody-antigen interaction is shown in figure 1.9. Antibody binding sites are located at the ends of two arms (Fab units) of the Y-shaped protein [36,66,89]. The tail end of the Y (Fc unit) contains species-specific structure, commonly used as an antigen for production of species-specific antibodies [36,66,89].
Figure 1.9 - An example of antibody-antigen interaction [90].
1.3.1.3 Immunoassays
Immunoassay techniques based on the highly specific molecular recognition reaction of antigens by antibodies, have become main analytical methods for biochemical analysis [34,50,74].
There are two possible immunoassay formats, non-competitive (figure 1.10a) or competitive (figure 1.10b). Sandwich-type immunoassay (non-competitive) with labelled-secondary antibody first bind the target antigen to the primary antibody-modified surface, and then the secondary antibody with a label is introduced to form the sandwich type complex [36,74]. Various molecules such an enzyme (e.g. horseradish peroxidase (HRP) [35,53,60,86]) or a nanoparticle [34,35,53] can act as the source of electrochemical responses [36]. In this type of immunoassay the signal is directly proportional to the analyte concentration [74].On the other hand, in a competitive-type immunosensor, the target molecule competes with its labelled form to attach on the primary antibodies [36,74]. The
Fab Fab
12 Introduction
electrochemical responses obtained from the labelled antigens are inversely proportional to the concentration of the target antigen [36,74].
An important issue in immunoassays is the minimization of non-specific binding (NSB) of interfering species in samples such as serum or blood, as well as NSB of the labelled Ab2 that arises when this signal producing species is bound to non-antigen sites on the sensor [91]. NSB is usually minimized by washing with bovine serum albumin (BSA) [54–59,86].
Figure 1.10 - a) Sandwich-type (non-competitive) immunoassay with a labeled-secondary antibody. b) Competitive-type immunoassay [41].
1.3.1.4 Antibody immobilization techniques
The performance of the detection and antigen binding capacity can be increased by a suitable antibody surface [41,62]. Several methods including physical and chemical adsorption have been used for the preparation of oriented antibody molecular layers on the surface of the transducer.
1.3.1.4.1 Physical immobilization
Physical immobilization is based on the adsorption of proteins onto electrode surfaces via non covalent interactions, mainly electrostatic force, ionic bonds and hydrophobic interactions [43,66]. However, physical immobilization is considered to be non-specific, as no reaction occurs between residues and often results in random orientation and weak attachment [43,66]. One common example of physical adsorption is the immobilization of the Ab on the surface of microtiter plate (as in ELISA) [43].
1.3.1.4.2 Covalent immobilization
Covalent bonds are mostly formed between side-chain-exposed functional groups of proteins with suitably modified electrodes, resulting in an irreversible binding and producing a high surface coverage [66]. The general chemical immobilization method involves
Biosensors 13
immobilization of Abs or other proteins based on the reaction between amino residues on the protein and groups on the sensing surface that can react with amines. An important approach for modification of electrodes is using bi-functional crosslinking reagents, such as glutaraldehyde [49,61,66]. Another method frequently used in covalent immobilization is SAM [43,52,65,92–94]. SAMs are formed by spontaneous absorption of macromolecules containing the functional groups on the surface, especially on the Au surface [43]. The functional groups (e.g. -COOH) can interact and ensure the immobilization of Ab onto the surface [43].
Covalent immobilization presents great advantages in the fabrication of electrochemical immunosensors. Nevertheless, the affinity efficiency of immobilized proteins can be improved by two main approaches, the oriented immobilization and the utilization of nanomaterials [43,66].
1.3.1.4.3 Oriented immobilization
In some cases, immobilization may lead to partial or complete loss of protein activity, due to random orientation and structural deformation [43,66]. Although, as mentioned above, oriented immobilization can improve the performance of the immunosensor. Oriented immobilization means that the capture probes are immobilized in such a way that antibodies recognition sites (Fab) are uniformly arranged and exposed to the sample solution [66]. As the active sites of the antibody are on the Fab segment, the ideal orientation of the immobilized antibody is when the Fc adsorbs onto the surface and the Fabs orient to the analyzing solution.
A method that ensure proper orientation is the EDC–NHS (Ethyl(dimethylaminopropyl) carbodiimide– N-Hydroxysuccinimide) based coupling method that converts antibody into NHS (N-Hydroxysuccinimide) ester intermediate [43]. This NHS ester intermediate is highly reactive, forming peptide bond with amine functionalized surface, which facilitates Ab immobilization [43]. Several studies have applied this immobilization method [34,51,52,65,73,76]. Another way to achieve the proper orientation is by capturing the fragment crystallizable (Fc) region of the Ab using an aptamer [35,92] or another probe (e.g. Protein A [62,92] and G [62,95]) on the sensing surface [43,66]. In addition, the oriented immobilization can also be performed by thiolation, using EDTA and iminothiolane [96].
1.4 Electrochemical Techniques
Analyses of smaller amounts of biological samples such as blood, serum and urine are often requested. Thereby, determination methods must have low detection and determination limits and should be applicable to small samples [45]. Electrochemical techniques are powerful and versatile analytical techniques that offer high sensitivity, accuracy, and precision as well as large linear dynamic range, with relatively low-cost instrumentation [97].
All voltammetric techniques involve the application of a potential (E) to an electrode and the monitoring of the resulting current (i) flowing through the electrochemical cell [98]. These electrochemical analyses commonly require the use of three electrodes, a working
14 Introduction
electrode, a reference electrode and a counter electrode, and also a contacting solution (electrolyte) [98]. The working electrode is the electrode at which the reaction of interest occurs, and it can be of different materials [97]. Saturated calomel, silver chloride, or mercury sulphate electrodes are used as reference electrodes, often insulated from the sample solution by means of an intermediate bridge in order to prevent the contamination of the solution to be analysed [99]. Inert conducting materials (platinum wire or graphite rod) are used as the auxiliary electrode [99]. The performance of voltammetry is strongly influenced by the working electrode material as mentioned above. Ideally, the electrode should provide a high signal-to-noise ratio as well as a reproducible response [99].
In the present study, cyclic voltammetry, square wave voltammetry, and electrochemical impedance spectroscopy techniques were used.
1.4.1 Cyclic voltammetry
Cyclic voltammetry (CV) is the most versatile electroanalytical technique for the study of electroactive species [100]. The CV method has become very popular for initial electrochemical studies of a compound, a biological material, or an electrode surface, since its used for acquiring qualitative information about electrochemical reactions [97,100].
CV is based on varying the applied potential at a working electrode in both forward and reverse directions while monitoring the current [98]. Depending on the analysis, one full cycle, a partial cycle, or a series of cycles can be performed.
Thus, the waveform is usually of the form of an isosceles triangle (figure 1.11) [97]. This triangular potential excitation signal sweeps the potential of the electrode between two values, sometimes called the switching potentials [100]. This sweep is described in general by its initial, high, final potentials, and scan rate. The important parameters of CV scan are the magnitude of the peak current and the peak potentials [97].
Figure 1.11 - Typical excitation signal for cyclic voltammetry [100].
A redox couple in which both species are stable and rapidly exchange electrons with the working electrode is termed an electrochemically reversible couple. The peak current
Electrochemical techniques 15
obtained at a planar electrode for a reversible process is described by Randles-Sevcik equation (for T=298 K) (1.1) [97]:
𝐼𝑝 = 2,69 × 10⁵ 𝑛2 3 𝐴. 𝐷12 𝐶𝜈12 , (1.1) where Ip is the peak current (Amperes); n is the number of electrons (equivalent/mol); 𝜈 is the potential scan rate (V/sec); A and D are the electrode area (cm2) and the diffusion coefficient (cm2/sec), respectively; and C is the analyte concentration (mol/L).
1.4.2 Square-wave Voltammetry
Square-wave voltammetry (SWV) is one of the four major voltammetric techniques provided by modern computer-controlled electroanalytical instruments, such as Autolab [101]. This powerful technique is used for both kinetic and analytic measurements [102]. SWV is a large amplitude differential technique in which a waveform composed of a symmetrical square wave, superimposed on a staircase, is applied to the working electrode [97].
The excitation signal in SWV consists of a symmetrical square-wave pulse of amplitude Esw superimposed on a staircase waveform of step height ∆E, where the forward pulse of the square wave coincides with the staircase step (figure 1.12). The net current, inet, is obtained by taking the difference between the forward and reverse currents (ifor – irev) and is centered on the redox potential [98]. The current is sampled twice during each square-wave cycle, once at the end of the forward pulse, and once at the end of the reverse pulse. The difference between the two measurements is plotted vs. the staircase potential [45]. The resulting peak-shaped voltammogram displays excellent sensitivity and effective discrimination against background contributions [97].
16 Introduction
Figure 1.12 - Waveforms employed and obtained in SWV [101].
Square-wave voltammetry has several advantages. Among these are its excellent sensitivity and the rejection of background currents [98]. The greater advantage of SWV is that a response can be found at a high effective scan rate, thus reducing the scan time. Because of this advantage, SWV is employed more often than other pulse techniques [97].
Applications of square-wave voltammetry include the study of electrode kinetics with regard to preceding, following, or catalytic homogeneous chemical reactions, determination of some species at trace levels, and its use with electrochemical detection [98]. SWV method was also applied to numerous drug active compounds. Because of the sensitivity and rapidity SWV is useful for drug analysis in their dosage forms and biological samples [97].
1.4.3 Electrochemical Impedance Spectroscopy
Electrochemical impedance spectroscopy (EIS) has become a mature and well-understood technique. It is now possible to acquire, validate, and quantitatively interpret the experimental impedances [46,103]. Important areas of application are corrosion, electrode kinetics, membranes, semiconductors, surface treatment, batteries and fuel cells, interfaces, etc [104].
This technique is based on the perturbation of a system at equilibrium by a small amplitude AC potential wave form (typically 5-10 mV) [45]. An advantage of EIS is that a range of different experimental time scales are examined within the one experiment that measures the impedance of the concerned electrochemical system over a range of
Electrochemical techniques 17
frequencies. Therefore the frequency response of the system is determined, including the energy storage and dissipation properties [45,104].
A common approach for the interpretation of impedance spectra is the method of equivalent circuits, which states that the components of an electrochemical and mathematical cell can be modelled using electronic and theoretical components: that is, circuit can be built that has an impedance spectrum identical to the electrochemical system under investigation [45]. For example, the impedance spectrum (expressed as a Nyquist plot) for a redox-active species in solution, consists of a semicircle at high frequencies, and a straight line at low frequencies, as shown in figure 1.13a [45]. The Randles circuit of this system is showed in figure 1.13b [45]. The semicircle is related to the parallel combination of the double-layer capacitance (Cdl) and the charge-transfer resistance (Rct), whereas the straight line at low frequencies is related to the Warburg diffusion parameter [45]. At high frequencies, the impedance is determined by slow electron transfer kinetics, whereas at lower frequencies the impedance is diffusion-controlled [45,46].
Figure 1.13 - a) Idealized Nyquist plot for a redox active species in solution. b) Randles equivalent circuit for a redox active species in solution [46].
EIS can be used as a label-free detection tool for many biosensors [46]. Appropriate surface modification allows the electrode to selectively interact with target analytes or to form host-guest complexes, these analytes include large biological compounds such as proteins, DNA, cells, and trace amounts of heavy metal ions, as well as biological cells and bacteria. EIS sensitively analyses the interactions of modified electrodes with analytes, producing measurable electric signals [46].
1.4.4 Electrode materials
The term working electrode is reserved for the electrode at which the reaction of interest occurs and the performance of the voltammetric procedure is strongly influenced by these [97,105]. Solid or mercury-based electrodes [33] are used as working electrodes in voltammetric techniques [97,105]. In general, solid electrode materials have the advantage
18 Introduction
of being more mechanically stable, and they provide a larger anodic range than mercury-based electrodes [97,105]. The choice of the electrode to be used for an electrochemical immunosensor is crucial for several aspects including the sensitivity of the method, the cost of the assay and the possibility to adopt different immobilization procedures [72,105]. Electrodes used for this task are commonly made of inert metals such as platinum [72], gold [51–53,65,75,92,94] and several forms of carbon including carbon paste [50,93,106] or glassy carbon [20,48,49,69,70,79,107] or from indium tin oxide (ITO) [19,67,68]. Therefore, the use of such electrodes requires precise electrode pre-treatment to obtain reproducible results [105]. Mechanical polishing and potential cycling are commonly used for metal electrodes, while various chemical, electrochemical, or thermal surface procedures are added for activating carbon based electrodes [105,108].
1.4.4.1 Carbon electrodes
Carbon electrodes are currently in widespread use in electroanalysis, primarily because of their broad potential window, low background current, rich surface chemistry, low cost, chemical inertness, and suitability for various sensing and detection applications [105,109]. In contrast, electron transfer rates observed at carbon surfaces are often slower than those observed at metal electrodes [105,110]. Glassy carbon has been very popular because of its excellent mechanical and electrical properties, wide potential window, chemical inertness, and relatively reproducible performance [105]. Carbon paste electrodes, which use graphite powder mixed with various water-immiscible non conducting organic binders (pasting liquids), offer an easily renewable and modified surface, low cost, and very low background current contributions [105,110].
1.4.4.2 Gold electrodes
Gold electrodes are the most widely used metallic electrodes. Such electrodes offer favourable electron transfer kinetics and a large anodic potential range [105]. Compared to platinum electrodes, gold ones are more inert, and hence are less prone to the formation of stable oxide films or surface contamination. Gold electrodes are also widely used as substrates for self-assembled monolayers or for stripping measurements of trace metals [105].
Aim 19
1.5 Aim
The physical symptoms that currently characterize the Parkinson disease only appear in advanced stages. Moreover, there is currently no definitive laboratory test for diagnostic purposes. Thus, it is necessary to develop a method for an earlier diagnosis that will allow therapy and disease progress prevention.
The aim of this research is to develop a biosensor for α-synuclein, a Parkinson’s disease biomarker, in order to promote an earlier diagnosis of PD. To achieve this goal, the following objectives were defined:
Selection and construction of the immunosensor to detect α-synuclein: optimization of the supporting matrix and antibody immobilization;
Materials 21
Chapter 2 - Materials and Methods
2.1 Materials
Alumina solution (γ-Al2O3) 0.3 μm and 0.05 μm were purchased from Gravimeta. All other chemicals were of analytical grade. Sulfuric acid (H2SO4, 98%), hydrogen peroxide (H2O2, 30% Sigma-Aldrich, Steinheim, Germany) and absolute ethanol were purchased from Panreac (Spain). Potassium nitrate (KNO3) was purchased from Pronalab (Mexico). Potassium ferrocyanide (K4[Fe(CN)6].3H2O), potassium ferricyanide (K3Fe(CN)6), potassium hydrogen phosphate (K2HPO4), potassium phosphate monobasic (KH2PO4) and sodium phosphate dibasic (Na2HPO4), sodium chloride (NaCl) and potassium chloride (KCl) were purchased from Riedel-de Haën (Germany). Gold(III) chloriRiedel-de solution, ethylenediaminetetraacetic acid (EDTA), 2-imninothiolane hydrochloride, bovine serum albumine (BSA) and graphene were purchase form Sigma-Aldrich (Steinheim, Germany). Mouse monoclonal to alpha Synuclein (1 mg/mL) IgG (ab27766) was purchased from Abcam (U.K). Human antigen α-Synuclein (S7820-500UG) was purchased from Sigma-Aldrich (Steinheim, Germany). Ultrapure water (18.2 MΩcm-1 resistivity) was produced by a Milli-Q Simplicity 185 system (Millipore, Molsheim, France). Nitrogen (99.999%) was obtained from LINDE (Portugal). Carbon nanotubes were purchased from DropSens (Oviedo, Spain). Chitosan powder (MW=20 kDa; 248 kDa) was purchased from Altakitin (Lisbon, Portugal). Acetic acid was purchased from Merck (Germany).
Eight inches microcloth polishing cloth (Buehler) was used to perform the mechanical cleaning of the working electrode.
2.2 Electrochemical assays
The voltammetric measurements were realized using an Autolab electrochemical system (Eco Chemie, The Netherlands) equipped with PGSTAT-30 and General Purpose Electrochemical system for Windows (GPES) software and NOVA Impedance spectroscopy (NOVA). The electrochemical cell was mounted using a conventional three-electrode cell which included a polycrystalline gold electrode (AuE, BASi MF-2014, surface area 2.0 mm2) as a working electrode, a Ag|AgCl|KClsat reference electrode and a glassy carbon as counter-electrode. Firstly, the supporting electrolyte for the electrochemical studies was a solution of 10 mM K3[Fe(CN)6]/K4[Fe(CN)6] prepared in KNO3 (0.1 M). Posteriorly this solution was diluted with PBS (0.1 M; 80% K2HPO4 and 20% KH2PO4), getting a electrolyte solution of 1 mM K3[Fe(CN)6]/K4[Fe(CN)6].
22 Materials and Methods
Experiments were performed by cyclic voltammetry (CV), square-wave voltammetry (SWV) and electrochemical impedance spectroscopy (EIS) using Fe(CN)63-/4- as electroactive indicator. CV measurements were made using a scan rate of 0.005 V/s. SWV measurements were performed by varying the potential from 0.0 to 0.60 V at 0.0405 V/s and at a frequency of 50 Hz. EIS measurements were performed using a set potential of 0.2 V and a frequency range from 10-1 to 105 Hz with an amplitude perturbation of 5 mV.
2.3 Pre-treatment of the working electrode
The Au working electrode was firstly immersed in Piranha solution (70% H2SO4 and 30% H2O2) during 5 minutes. Then, the electrode was carefully polished to obtain a mirror-like surface with alumina solution of 0.3 μm and 0.05 μm. Hereafter, the electrode was rinsed with ethanol and ultrapure water. For the electrochemical activation of the surface (to create –COOH and –OH functional groups onto the gold electrode), the electrode was cycled from 0.0 to +1.6 V in 0.5 M H2SO4 solution at 100 mV/s. This step was also used to ensure that the electrode was thoroughly cleaned, applying successive cycling until a typical gold cyclic voltammogram was obtained [111].
2.4 Synthesis of AuNPs
The gold nanoparticles were synthesized by two different methods. In the first, AuNPs were synthesized in accordance with the Turkevish-Frens method [86]. First, 86.5 µL of 0.5 M HAuCl4 solution was added to 125 mL of ultrapure water and the mixture was refluxed with stirring and heated. The trisodium citrate solution (12.5 mL) was added to the mixture when it began to boil and the mixture was refluxed for 15 min. The resultant gray solution turned slowly to a light wine red color. Finally the solution was left to cool at room temperature.
The nanoparticles evaluation was performed by two techniques, Dynamic light scattering (DLS) and Laser Doppler Velocimetry (LDV). DLS, based on the time-dependent correlation of light intensity fluctuation due to Brownian motion of particles, is robust for qualitatively analyzing particle size and sample polydispersity for particle diameters from several nanometers to a few micrometers [112,113]. The scattered light from small particles fluctuates rapidly and that from large particles fluctuates slowly. The particle diffusion coefficient can be determined by intensity autocorrelation function, from which we can obtain the particle size information [113]. LDV is used to measure the movement of nanoparticles (electrophoretic mobility), when an electric field is applied across the sample [114]. Nanoparticles with a zeta potential between -10 mV and +10 mV are considered neutral, while nanoparticles with zeta potentials of greater than +30 mV or less than -30 mV are considered strongly cationic and anionic, respectively [114].
Deposition of the CS layer 23
In the second method, the AuNPs were synthesized by electrodeposition. The gold electrode were immersed in a 0.1 M KNO3 solution containing 3 mM of HAuCl4 and the electrochemical deposition was performed by applying a -0.2 V potential during 120 s.
2.5 Deposition of the CS layer
Chitosan solution (0.5 wt%) was prepared by dissolving chitosan powder in 1.0% (v/v) acetic acid with stirring until completely dissolution. Chitosan with different molecular weights (20 KDa and 248 KDa) were tested in order to evaluate which promote the best film forming. Then, the chitosan solution was mixed with nanoparticles in different proportions to evaluate which formulation promotes the best film deposition. The deposition of the different CS solutions onto the gold electrode was tested both by electrodeposition and drop-casting.
The different CS solutions were:
AuNPs/CS
AuNPs synthesized by Turkevish-Frens method were added to the chitosan solution to obtain several concentrations, 20, 30, 40, 50, 60 and 70 % (v/v)
CNTs/CS
5 mg of functionalized carbon nanotubes were dispersed in 5 mL of chitosan solution and ultrasonicated for 2 h.
GP/CS
5 mg of graphene were dispersed in 5 mL of chitosan solution and ultrasonicated for 2 h.
GP/AuNPs/CS
First, 5 mg of graphene were dispersed in 5 mL of chitosan solution and ultrasonicated for 2 h. Then, AuNPs synthesized by Turkevish-Frens method were also added to this homogenous solution to obtain a 50% (v/v).
2.6 Antibody immobilization
The antibody immobilization was performed by immobilizing the anti-α-syn on the AuNPs using thiol (-SH) groups. As mention earlier, this step is crucial to improve the immunosensor performance by oriented immobilization. Thus, in order to promote proper orientation the antibody was chemically modified by thiolation using EDTA and iminothiolane.
A mixed solution containing 1 μL of EDTA (0.28 mol/L), 82.6 μL of iminothiolane (0.198 mg/mL) and monoclonal antibody against α-syn was prepared in PBS; the volume of PBS added to the antibody was the necessary to make up a volume of 110.6 μL. The prepared solution reacted for 50 to 60 minutes at room temperature. After reaction 389.4 μL of PBS were added to the solution in order to make up a volume of 500 μL and then the resulting solution was purified by passing through a sephadex PD MiniTrap G-25 column (GE Healthcare), following the gravity protocol. This first 500 μL were discarded, then the column
24 Materials and Methods
was eluted with 1.0 mL of PBS and the eluate was collected to an eppendorf. Four concentrations of antibody in PBS were tested, 2.5, 5.0, 7.5 and 10.0 μg/mL. The AuNPs/CS modified gold electrodes were immersed in 300 μL of the different antibody solutions and incubated at 4 ºC for 12 h. After concentration optimization, the incubation time was also optimized. For that purpose, three incubation times were tested 4, 7 and 10 h.
Finally, the remaining non-specific binding sites on the electrode surface were blocked with a 1.0% (w/v) BSA for 30 min.
2.7 α-Synuclein detection
Lastly, after antibody immobilization the anti-α-syn/AuNPs/CS modified electrodes were immersed in 300 µL of α-Syn solution for 20 min at room temperature. The antigen solutions were prepared in PBS (0.1 M, pH=7.4). In this study, seven concentrations of α-syn (10, 50, 100,150, 200,3 00 and 400 ng/mL) were used. To analyze the results, inhibition percentages (IR, %) corresponding to the selected antigen concentrations were calculated by the following equation (2.1):
%𝐼𝑅 = [1 − (𝐼𝑝
𝐼𝑝0)] × 100, (2.1)
where Ip0 and Ip are the peak currents before and after the incubation of the immunosensor with the antigen solution.
The regression equation and the standard error were used to determine the detection and quantification limits [58]. These values were calculated by the following equations (2.2) and (2.3) [115]:
3
y xs
LOD
b
, (2.2)
10
y xs
LOQ
b
, (2.3)
where b represents the slope of the regression line and sy/x the standard error. This standard error was calculated using the excel function STEYX, which returns the standard error of the predicted y-value for which x in a regression.Immunosensor assembly 25
Chapter 3 – Results and discussion
3.1 Characterization of the gold electrode surface
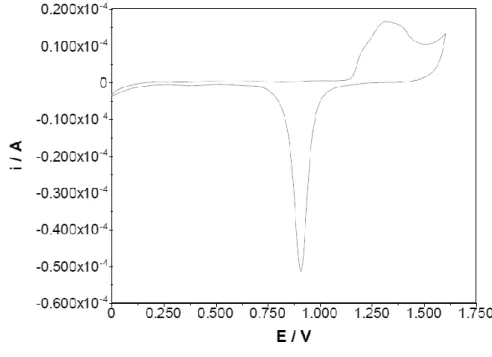
The gold surface of the non-modified working electrode was qualitatively evaluated by cyclic voltammetry to ensure that it was properly cleaned and could be used in the next stages. The attained cyclic voltammogram (Figure 3.1) in the selected range of potentials include: the electrochemical double layer region, the formation of a monolayer of oxide (and its subsequent reduction), and the beginning of the reduction of protons (or of the solvent) [111].The voltammogram obtained is in agreement with the typical and characteristic voltammogram found in literature [111]. In the first region (0 V – 0.865 V) the current is associated with charging of the double layer capacitance C (which itself may vary with potential) [111]. In the second region (0.865V – 1.625V), surface oxidation/reduction processes occur; then in response to a change of potential with time, a faradaic current flows through the interface [111]. In Figure 2.1, the voltammogram exhibited one broad oxidation peak at 1.375V, attributed to the formation of Au surface oxides, and a sharp reduction peak at 0.900 V due to subsequent removal of the oxides.
Figure 3.1 - Cyclic voltammogram of the bare gold electrode in 0.5 M H2SO4 aqueous solution at 100
26 Materials and Methods
3.2 Characterization of the gold nanoparticles
The gold nanoparticles prepared by the Turkevish-Frens method exhibit a hydrodynamic size of 24.7 ± 9.9 nm and a zeta potential of -48 ± 11 mV), as it can be seen in the results of DLS (figure 3.2) and LDV (figure 3.3), respectively. As it is typical in a gold nanoparticles suspension, the results showed two populations of nanoparticles. Although the smaller population, with a hydrodynamic size of 24.7 ± 9.9 nm showed an intensity percentage of 67.1% which means that the majority of the AuNPs have this size. Thus, the synthesized AuNPs are anionic since its zeta potential was -47.6 ± 10.8 mV. These results confirm the stability of the nanoparticles obtained by the citrate-capped effect [116].
![Figure 1.1 - Hypothesis on the development of premotor symptoms among persons who will or will not develop PD in lifetime [10]](https://thumb-eu.123doks.com/thumbv2/123dok_br/18700277.916232/24.892.219.629.106.356/figure-hypothesis-development-premotor-symptoms-persons-develop-lifetime.webp)
![Figure 1.2 - Schematic structure of α-synuclein [22]](https://thumb-eu.123doks.com/thumbv2/123dok_br/18700277.916232/25.892.182.739.590.852/figure-schematic-structure-α-synuclein.webp)
![Figure 1.3 - Scheme of the sensor developed by Yarui et al. [34].](https://thumb-eu.123doks.com/thumbv2/123dok_br/18700277.916232/27.892.183.749.103.387/figure-scheme-sensor-developed-yarui-et-al.webp)
![Figure 1.5 - Typical elements of a biosensor [37].](https://thumb-eu.123doks.com/thumbv2/123dok_br/18700277.916232/28.892.186.664.223.467/figure-typical-elements-biosensor.webp)
![Figure 1.7 - Schematic representation of electrochemical immunosensors [36].](https://thumb-eu.123doks.com/thumbv2/123dok_br/18700277.916232/29.892.203.731.391.615/figure-schematic-representation-electrochemical-immunosensors.webp)
![Figure - 1.8 Illustration of different types of nanomaterials in the electrochemical immunosensors fabrication [66]](https://thumb-eu.123doks.com/thumbv2/123dok_br/18700277.916232/31.892.342.591.108.472/figure-illustration-different-types-nanomaterials-electrochemical-immunosensors-fabrication.webp)
![Figure 1.11 - Typical excitation signal for cyclic voltammetry [100].](https://thumb-eu.123doks.com/thumbv2/123dok_br/18700277.916232/36.892.245.631.742.997/figure-typical-excitation-signal-cyclic-voltammetry.webp)
![Figure 1.12 - Waveforms employed and obtained in SWV [101].](https://thumb-eu.123doks.com/thumbv2/123dok_br/18700277.916232/38.892.239.597.105.595/figure-waveforms-employed-obtained-swv.webp)
![Figure 1.13 - a) Idealized Nyquist plot for a redox active species in solution. b) Randles equivalent circuit for a redox active species in solution [46]](https://thumb-eu.123doks.com/thumbv2/123dok_br/18700277.916232/39.892.166.730.448.727/figure-idealized-nyquist-species-solution-randles-equivalent-solution.webp)