A STUDY OF DROPOUT BEHAVIOR IN THE PORTUGUESE HIGHER
EDUCATION SYSTEM, WITH AN APPLICATION TO MASTERS
PRO-GRAMS IN ECONOMICS
Luís Paulo Sá Gonçalves
Dissertation
Master in Economics
Supervised by
Diogo Campos Monteiro de Melo Lourenço
September 2018
i Biographical Notes
Luís Paulo Sá Gonçalves was born on the 14th of July of 1990 in Funchal (Portugal), where he lived and studied until the age of 18. In 2008 he moved to Oporto, in order to enroll at Faculdade de Economia do Porto. This would become his alma mater, from which he obtained his degree in Economics in 2015. During this time, he was a part of the Tuna Académica da Faculdade de Economia do Porto, having organized music tours through numerous European countries, as head of the travel department.
In late 2015 he entered the Master in Economics program, again at Faculdade de Economia do Porto. Around the same time, he enjoyed his first experience on the labor market, working as a Financial Assistant at Nilorn Portugal. He currently works as a Sales Assistant at Novo Banco.
ii
Acknowledgements
To Professor Diogo Lourenço, for the guidance, advices and passion displayed during the creation of this study. His contributions cannot be overstated and without him this work would not have come to fruition.
To my parents, for asking “Is it done yet?” on a daily basis during the latter stages of this work. Their love and support drove me forward towards attaining this goal. To my sister, for having the patience to answer my questions regarding the English language and always believing in me.
To Andrea, for everything. Words cannot explain how much she aided me during the last year.
iii
Abstract
Despite continued efforts towards improving higher education, not much has been written on dropout behavior in Portugal. This work aims to fill this gap by studying dropout behavior in the Portuguese higher education system.
An extensive review of the existing literature is presented, tacking the subject matter of this dissertation from various perspectives. It is accompanied by a brief history of the Portuguese higher education, which helps understand the current landscape of the system. Both of these aid in understanding dropout behavior and contribute towards the selection of the determinants included.
Using these select determinants of dropout, we analyze how this behavior relates to Portuguese students. Three different regressions were calculated, with the first regarding the entire student population, the second focusing in master’s degrees in general and the third on 2nd degrees in the field of Economics.
We employ a Negative Binomial Regression Model on the chosen database, in order to measure the impact of the selected variables on dropout in Portuguese tertiary education.
Finally, we formulate and answer a set of research questions related with dropout behavior. This allows us to reach several conclusions regarding dropout in Portuguese higher education, paying particular attention to master’s degrees in Economics.
JEL Codes: I21, I23
iv
Resumo
Apesar de contínuos esforços efetuados no sentido de melhorar o ensino superior, pouco foi escrito sobre abandono escolar em Portugal. Este trabalho tenta preencher este vácuo, através do estudo do abandono escolar no Ensino Superior português.
Uma extensa revisão da literatura existente é apresentada, abordando o tema desta dissertação de várias perspetivas. É acompanhada por uma breve história do ensino superior Português, que ajuda a compreender o panorama atual do sistema. Ambas auxiliam a compressão do abandono escolar e contribuem para a seleção dos determinantes incluídos.
Utilizando os determinantes de abandono escolhidos, analisamos como este comportamento se relaciona com os estudantes portugueses. Três regressões diferentes foram calculadas, sendo a primeira referente a toda a população estudantil, a segunda focada nos mestrados em geral e a terceira nos mestrados na área de Economia.
Empregamos um Modelo de Regressão Binomial Negativa na base de dados escolhida, de forma a medir o impacto das variáveis selecionadas no abandono escolar na educação superior portuguesa.
Finalmente, formulamos e respondemos a um conjunto de questões de pesquisa relacionados com abandono. Isto permite-nos chegar a várias conclusões quanto ao abandono escolar no ensino superior, com especial atenção nos mestrados em Economia.
JEL Codes: I21, I23
Keywords: Abandono Escolar – Ensino Superior – Mestrado em Economia – Universidades Portuguesas
Index
1. Introduction ... 1
2. Existing Research on Dropout ... 4
2.1 Defining Dropout 4
2.2 Sociological Approaches to Dropout 5
2.3 Costs, Financing and Dropout Behavior 6
2.4 Other Factors 8
3. Overview of the Portuguese Higher Education Landscape ... 10
3.1 Past 10
3.2 Present
12
3.2.1 Students and Institutions in numbers 12
3.2.2 Attainment
16
3.3 Future 18
4. Methodology ... 21
4.1 Research Goals and Dataset 21
4.2 Estimation 24
4.2.1 OLS 25
4.2.2 PRM VS NBRM 26
5. Results ... 31
5.1 Comparing Subsystems of Higher Education
32
5.2 Measuring the impact of educators
33
5.3 The fabric of the student population and its relationship with dropout
34
5.4 The effect of prospective income on the decision to drop out
35
5.5 Gender and dropout
36
6. Conclusion ... 38
7. Bibliography ... 42
1
1. Introduction
Higher education is fundamental for economic development and citizenship. Sovereign states, such as Portugal, benefit greatly from investments in tertiary education, as the system produces more skilled and educated individuals, leading to higher tax revenue and less public spending on social welfare programs (OECD, 2017). Additionally, higher education yields benefits at an individual le vel. When compared with secondary education graduates, college graduates are less likely to be unemployed (12% vs 8% for Portugal in 2015), enjoy higher job stability (50% vs 60% in terms of full time jobs within the OECD in 2014) and receive higher wages (70% higher for college graduates in Portugal) (Figueiredo et al., 2017).
Thus, it is not surprising that the European Union strategically targets the reduction of inequality in access and completion of higher education, aiming to raise the number of young people with higher education degrees (Contini, Cugnata, & Scagni, 2017). Reducing the number of dropouts from higher education plays an important role in achieving the objectives set by the European Commission, as seen in the “Europe 2020” strategy. This program specifies two major goals for Portugal in terms of education: reducing the rate of early abandonment in education and training to 10%, and raising the rate of higher education degree attainment for individuals between the ages of 30 and 34 to 40% (PORDATA, 2018a).
Historically, Portugal has struggled with a significant skill gap (Figueiredo et al., 2017) that lasts to this day, despite 30 years of measures to increase attainment. For instance, tertiary degree attainment for individuals between the ages of 30 and 34 diminished during the nineties (15,1% in 1992 vs 11,1% in 1999), but has significantly increased in more recent years, reaching 18,3% in 2006 and 34,6% in 2016 (PORDATA, 2018b). Still, despite these results, the country continues to lag behind the OECD average. (OECD, 2016)
Of the Portuguese population between 18 and 25, 53,6% of individuals are students, either full or part time. This is slightly higher than the OECD average of 52,5% students versus 47,5% non-students. Enrollment in tertiary education is at 26% for 18-year-olds, 35% for 19-year-olds and 39% regarding 20 year old individuals, values which are aligned with the OECD average(17%, 33% and 39%) (OECD, 2017). As for young adults above 20, the OECD states that 37% of 20 to
2 24-year-olds are students. Comparatively, within the OECD this figure is at the 42% mark, which suggests that Portuguese individuals in this age group are less inclined towards education at all levels, including tertiary education (OECD, 2017).
One of the most significant problems that the Portuguese education system struggles with is early abandonment. The rate of early abandonment in education and training, i.e. the percentage of the population between the ages of 18 and 24 who have not obtained a secondary education degree, has shown a decreasing trend, from 50% in 1992, to 44,8% in 1999, down to 38,5% in 2006, and finally to only 12,6% of the population in 2017 (PORDATA, 2018c). Despite this downward tendency, the end results are lackluster when compared with other developed nations (OECD, 2018). This segment of the population is also of interest to the work at hand, as 91% of first time entrants in tertiary education are younger than 25 years old, with the average age of entry being 20 years old for the entire system (OECD, 2017), and the typical age of entry gap being between 18 to 23 for master degree programs. (OECD, 2017).
Thus, considering the country’s situation and the problems highlighted in the previous paragraphs, it is important to understand success in higher education. Despite the efforts of the European Commission and the Portuguese government to promote the pursuit of higher education, not many scientific works have been written on the subject of dropout behavior in Portugal. Except for the regular reports published by DGES (Direção Geral do Ensino Superior), DGEEC and entities related to the European Commission, such as Eurydice, not much has been written concerning this problem in the country. Furthermore, government policy should be theory and evidence based. Policy is more efficiently drafted and implemented if based on an understanding as to why students from a certain group are more likely to dropout (Johnes & McNabb, 2004). With all these different factors in mind, the present dissertation concerns itself with a better understanding of dropout in the context of Portuguese higher education in general, while highlighting the specificities pertaining to master’s degrees.
The focus on master’s degrees has been motivated by recent reports that show an interesting dichotomy regarding master’s degrees and the students that are part of them: although the percentage of students who achieve this degree is rising - increasing more than fivefold between 2006 and 2012 according to DGEEC
3 (Conselho Nacional de Educação, 2015), abandonment in the first year of the course is more frequent for Portuguese master’s degree students, than for their first cycle counterparts (Conselho Nacional de Educação, 2014). These figures, together with the aforementioned focus of the EU on higher education goals, justify the choice of 2nd cycle degrees as worthy of a certain focus. We will also analyze master’s
degrees in Economics separately, in an attempt to see the effect of dropout i n a more homogenous backdrop. Master’s degrees can be obtained in a plethora of different subject matters, which differ in terms of entry requirements, teaching staff, pool of course units offered or the degree of freedom when deciding on the former. Therefore, examining the field of Economics individually will allow us to somewhat eliminate the influence of these differences on dropout, by tackling a more standardized database which only includes one field of study.
Lastly, an important disclaimer must be made. This study does not attempt to offer solutions that would reduce the problem of higher education abandonment in Portugal; instead, it aims to help better understand this problem, by studying how it impacts the country’s institutions of higher education.
The next section will concern itself with the existing literature regar ding the subject of higher education dropout. We will also present the past and present of Portuguese higher education, as well as its possible path towards the future. Next, we will cover the methodology employ, specifying the details regarding our dependent and independent variables, database and estimation method. We will also formulate a set of research questions, which will be then answered as we, finally, interpret the estimations calculated and present our conclusion based on them.
4
2. Existing Research on Dropout
The complexity of the college experience allows for the study of dropout from a multitude of perspectives. In this section, we cover some of the main results put forward in the literature. First, we show that the definition of dropout is not straightforward. Next, we cover the sociological approach to the study of dropout, primarily through the contributions of Tinto (1975) and Spady (1970). Afterwards, we study the impact of the costs of attending higher education and the ways to finance them on students’ decisions to abandon their studies. Finally, we discuss other aspects of the provision of higher education, such as enrollment and performance, on their influence on dropout behavior.
2.1 Defining Dropout
Clarifying the definition of college dropout is vital for this study. According to Spady (1970), there are two definitions of dropouts. The first, and most traditional, takes a dropout to be any student that leaves the institution of higher education without a degree. This is a definition close to that found in most official reports, which take dropouts to be students that enrolled in a particular academic year, but neither graduated nor are enrolled in the following year (European Commission/EACEA/Eurydice, 2014). The second definition requires that the student never obtain a degree from any institution (Spady, 1970).
These definitions, however, do not distinguish between dropout and what Stratton et all (2008) call stopout. This phenomenon occurs when a student abandons studies temporarily, usually with a one-year mark as the threshold that differentiates dropouts from stopouts. These authors found that the factors typically associated with dropout need not affect temporary withdrawal, or at least not in the same way. Since 40% of student abandonment in the first year of college is temporary (Stratton, O’Toole, & Wetzel, 2008), the distinction seems important. That said, the two phenomena are not independent, as stopout is a predictor of dropout behavior (S. L. DesJardins, Ahlburg, & McCall, 2006).
Unfortunately, the distinction is not easy to make given available data. For the purposes of the work at hand, the first definition of dropout will be utilized, since it is observable giving extant databases, and more aligned with the official definition.
5 2.2 Sociological Approaches to Dropout
Spady (1970) and Tinto (1975), two often cited authors that have had a “formative influence on subsequent research” (Georg, 2009) regarding dropout, were inspired by Durkheim’s theory of suicide, which argues that individuals who are insufficiently integrated into the society surrounding them are more likely to commit suicide (Tinto, 1975).
The basis for the model proposed by Spady is that the decision to drop out of higher education is a response to the interactions between the student and the college environment. These interactions take shape in the way the student’s individual attributes relate with the influences, expectations and demands of the entities that make up the higher education institution’s fabric. These interactions and particularly their outcome, produce different levels of success, which in turn might influence the student’s decision to drop out. For instance, the degree of success regarding the academic system takes the form of both grades and, although more subjective, intellectual development. Meanwhile, in what pertains to the social system, success is obtained via “normative congruence” – compatibility with the surrounding environment – or through friendship support. Thus, the model suggests that grade performance, intellectual development, normative congruence and friendship support directly influence a fifth concept, social integration. This concept in turn has a direct impact on student’s satisfaction and consequently on their decision to dropout (Spady, 1970).
Similarly, Tinto (1975) argues that the causes for dropout are twofold, also focusing on the social and academic aspects of higher education. On the one hand, low integration into the collegial social system may be to blame, following the reasoning that a reduced level of commitment towards that social system might lead students to pursue activities other than higher education. On the other hand, insufficient academic performance or improper social/academic behavior might also play an important role in the abandonment decision. Both cases can ultimately culminate in voluntary withdrawal or academic dismissal.
It is important to expend a few words on these two concepts, since they refer to different types of dropout behavior. In fact, according to Tinto, “because of the failure to make such distinctions, past research has often produced findings contradictory in character and/or misleading in implication”. Acade mic dismissal,
6 for instance, is closely associated with grade performance, more specifically to failure to meet the demands determined by the institution of higher education. In respect to voluntary withdrawal, it seems to befall individuals whose beliefs are not in harmony with the intellectual climate of the institutions they are a part of , or their social system, e.g. “social isolates” or “deviants”. This concept is intriguing to the work at hand, since one can assume that the dimension of an institution can affect the decision of a student to withdraw from college (Tinto, 1975). Unfortunately, as with these case of dropout vs stopout, the available data does not allow us to discern between academic dismissal and voluntary withdrawal. However, given the nature of the Portuguese higher education system, particularly in terms of the Master’s Degree, it seems plausible that academical dismissal does not play a significant role.
2.3 Costs, Financing and Dropout Behavior
Besides the social/psychological based theories provided by Tinto and Spady, other authors have approached university abandonment problem from alternative angles. An extensive number of studies have attempted to dissect the relation between dropout and costs of attending higher education. Indeed, attending higher education is a costly endeavor, especially for low-income students, not only due to tuition fees, but also to the general expenses that the experience demands. Not only do dropout rates vary between different income groups (R. Chen & St John, 2011; S. DesJardins & Chen, 2008; Melguizo, Sanchez, & Velasco, 2016), but there is also a wide gap between students of different opposing economic backgrounds, particularly in terms of enrollment and persistence in higher education (Alon, 2011).
Individuals from a well-off background can rely on their family’s wealth to cover these costs associate with college, while low-income students often have to find alternative ways to fund their education, which may lead to mixed results. A significant percentage of this group manage to cope with their financial burden by working while in college. This decision, counterintuitively, is not necessarily detrimental to academic success, as time spent working per se does not affect students’ outcome. (Glocker, 2011). In fact, recipients of “Work-Study Aid” 1 in the
7 United States of America have been found to have a lower risk of dropout during their freshman year (S. DesJardins & Chen, 2008). However, given that academic success depends on the time a student chooses to devote to study, the risk of dropout may increase if the students spends less time studying as a consequence of being employed (Glocker, 2011).
Reducing disparities between students with different financial means has been a focus of higher education policies and the relation between dropout and the mean by which students finance their studies has been the focus of many studies. One way in which this goal can be achieved is by proving financial aid to students. This type of aid can be awarded either by need or merit, and generally takes the form of grants, loans, tuition remission and scholarships (M. Ganem & Manasse, 2011).
When the objective of policy makers is to reduce inequality, need-based financial aid seems to be their first choice, given that it mitigates the inverse correlation between parental income and dropout. (S. DesJardins & Chen, 2008). These types of programs reduce the pressure imposed by tuition, helping students focus on academic activities (Alon, 2011), and allowing low-income students to cover the costs associated with the degree, thus permitting more time to be devoted to leisure and study (Glocker, 2011). Evidence of the positive effect of financial aid can be found in Chen and St. John’s national study of American college student’s persistence. The authors illustrate this point by calculating a ratio between each state’s financial aid and public tuitions, and subsequently analyzing its impact regarding student abandonment. Their findings show that a one percent increase in said ratio translates into a 2% rise in the odds of persistence. Furthermore, the results obtained also emphasize the importance of coordination between the value of the grants attributed and the tuitions these are meant to cover (R. Chen & St John, 2011).
Loans are another means by which students may finance higher education. In some regards, their influence is similar to financial aid, providing students with the same freedom to focus on their studies by reducing the pressure to work (McKinney & Burridge, 2015). Yet, although loans have been shown to influence the persistence of low-income students, they are more strongly correlated with these individual s’ enrollment in higher education (Melguizo et al., 2016). Furthermore, the results found in the existing literature on loans vis a vis dropout/persistence have been
8 mixed. In other words, while there is evidence that this alternative does reduce college dropout (Melguizo et al., 2016), some authors find that loans may contribute to abandonment (Dowd & Coury, 2006; McKinney & Burridge, 2015). This is especially true when it comes to low-income students, who are typically less inclined to contract debt, due to their higher risk of loan default (Chen, 2008; Dowd & Coury, 2006)
2.4 Other Factors
On what concerns the academic part of the experience, we turn to Stinebrickner and Stinebrickner (2012), who found that the decision to drop out at a certain point in time is linked both with the student’s current grade point average and her expectation of its evolution. The work produced by these authors suggests that at enrolment most students underestimate the probability of not succeeding academically. As such, the “temptation” to drop out increases as students become better informed about their academic ability, in the form of the grades they receive. The authors estimate that dropout would be reduced by 41% if students did not learn about their academic performance, as they would not review their initial overoptimistic expectations regarding their grade achievements (Stinebrickner & Stinebrickner, 2012).
Information also plays an important role in student’s decisions in terms of expected earnings and costs. When building their college application, students try to maximize their chances of enrolling in a degree of their liking, be it in terms of financial characteristics (low costs or high returns on the labor market), interest on the program’s courses, travel expenses, among others (Hastings, Neilson, Ramirez, & Zimmerman, 2016). Research has found that, in general, the benefits of higher education in terms of expected earnings greatly surpasses the cost of obtaining a degree and the salaries that would be received during the years dedicated to obtaining the degree (Figueiredo et al., 2017), but even still, students pay close attention to the costs and benefits of their desired degree when drawing up their applications.
When considering their application, students overestimate the income of past graduates of their preferred degree program and predict their own future earnings based on this error. These miscalculations in terms of earnings are greater for both
9 students from the lower social strata and students with lower scores and are less likely to occur for students who make their enrollment decision based on the labor market. Interestingly, students who overrate their expected earnings tend to enroll in degree programs with lower earnings, while the opposite is true for students who correctly predict their future income. In terms of costs, students with higher estimates are less likely to enter college or even their preferred degree program. Students have more accurate understanding of the costs involved with higher education than past graduates’ earnings (Hastings et al., 2016).
This cost/benefit analysis can have some impact in the decision to drop out. Once students have enrolled in their chosen program, they are able to get a better understanding about it, possibly dissipating any leftover uncertainties, thus leading to dropout. And although it is difficult to assert how the miscalculations about earnings impacts the higher education journey of individual, the fact remains that students who overestimate the returns of graduation tend to enroll in programs where students graduated less. Also, and quite surprisingly, students who overestimate the costs associated with higher learning are more likely to drop out than students who underestimate these costs. This phenomenon may come from the fact that cost expectations are not immediately updated after enrollment (Hastings et al., 2016).
10
3. Overview of the Portuguese Higher Education
Landscape
3.1 PastSince the aim of this paper is to study dropout, it is vital to understand th e current landscape of higher education, not only within the selected institution, but also, and perhaps more importantly, in Portugal in general. To do so, the following paragraphs aim to explain the recent history of higher education in Portugal , in order to better understand the current state of the field.
Currently, Portugal has a binary system of higher education, with polytechnics and universities. The binary divide has its roots in the early 1970s with the “Veiga Simão Reform”. At the time, obtaining a higher education degree was largely uncommon, with only 3% of the population in the early 20s - i.e. between 20 and 24 years old – attending a higher education institution (Amaral, 2012). In its genesis this binary system was devised with the objective of achieving a broader student body, focusing on attracting individuals from different social and educational backgrounds to achieve this goal. Thus, this system included both a short -cycle and long-cycle approach to higher education. The former focused on students of less wealthy families, by being predominantly vocational and prioritizing the transition of students into the labor maker, while the latter held on to the classic university approach, more theoretic than its counterpart and more consistent with the preferences of well-off students (Amaral, 2012).
Another measure taken with the goal of expanding higher education to a wider part of the population was the decentralization of its supply, by making it available to students outside the three cities where higher education institutions were previously concentrated (Coimbra, Lisbon and Oporto). And although the Revolution of 1974 hampered the efforts of the “Veiga Simão Reform”, it still paved the way for the binary system present in today’s educational structure. Short cycle education lives on through a network of polytechnic institutes, initially created between 1974 and 1983 as a means to provide students with vocational training (Amaral, 2012) and through programs such as the Cursos Técnicos Superiores
11 study options that could attract individuals who had not enrolled in tertiary education previously (D. G. P. L. S. R. T. W. OECD, 2018).
Regarding the 1974 Revolution, the event shaped higher education in the country, due in part to the hope for social equality through education that rose from it (Magalhães, Amaral, & Tavares, 2009). This sentiment took form in the increased number of students registering in higher education institutions (Nunes, 1968). To relieve the pressure created by the large number of applications, a numerus clausus was created in 1976-1977, thereby restricting the number of places available and placing students into institutions in order of grades obtained (Amaral, 2012). Not only did this intensify grade competition in secondary education but it also caused competition between higher education establishments in order to attract the best students. This supply /demand asymmetry has since become a staple of Portuguese higher education, with the older and more prestigious universities thriving and the polytechnic system falling behind (Amaral, 2012). Still, thanks to broadening student recruitment, diversifying the courses offered and increasing the supply of higher education throughout the country (Figueiredo et al., 2017), the number of applicants continually expanded in the following decades (Amaral, 2012). The number of students enrolled in higher education grew from merely 60 000 in 1974, to breaking the 100 000 barrier in 1985, closing in on 300 000 in 1995 and finally reaching 400 000 in the early 21st century (Figueiredo et al., 2017). This growth
allowed the private sector of higher education (relatively small in scale until the early 1980s) to gain traction, skyrocketing from 9% of total students enrolled in 1980 to 36% in 1996 (Amaral, 2012).
At the turn of the century, roughly 6% of the population had a higher education degree. Ten years later this percentage was around 10%. The more recent number from 2017 estimate that approximately 20% of the Portuguese population has a degree in higher education, with the number being even higher when only considering younger individuals. The evolution of the Portuguese education system described in the paragraphs above is enough to explain why the number of degree recipients drops as we move further up the age ladder. But the inequalities of the system are far from being only attributed to age, with region and sex also assuming an important role in the existing discrepancies. Region inequalities for instance, materialize in the form of the distinctions in terms of college graduates when we
12 compare the urban or coastal communities to the rural or inland based population. Finally, in recent years the numbers show a higher completion rate for female students when compared to their male counterparts (1 in 7 for men vs 1 in 5 women, in 2017) (Figueiredo et al., 2017).
3.2 Present
Moving to the present, the following subsections aim to reveal the current state of Portuguese higher education. Such is done by first offering the raw figures concerning both institutions and students, then looking into DGEEC’s review of the path students take towards attaining a degree.
3.2.1 Students and Institutions in numbers
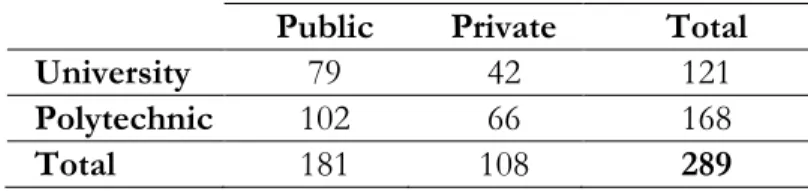
The most recent figures for the current curricular year of 2017/2018 show a total of 289 tertiary education units, across the entire spectrum of the Portuguese higher education system. These units can be Public or Private, Universities or Polytechnics2 (Table 1).
Table 1: Number of Organic Units by Type Public Private Total
University 79 42 121
Polytechnic 102 66 168
Total 181 108 289
Based on: (DGES, 2017)
In terms of the number of units, there is a greater number of public institutions, and of polytechnics. However, since institutions of higher learning provide a wide array of degrees in numerous fields, in order to get a better idea of how the offering of higher education programs is distributed, we turn to Table 2.
2 The 5 existing military and police higher education institutions are not considered, given that they are
structured differently from other programs (P. E. J. O. B. DGEEC, 2018) and as such are dismissible to the work at hand.
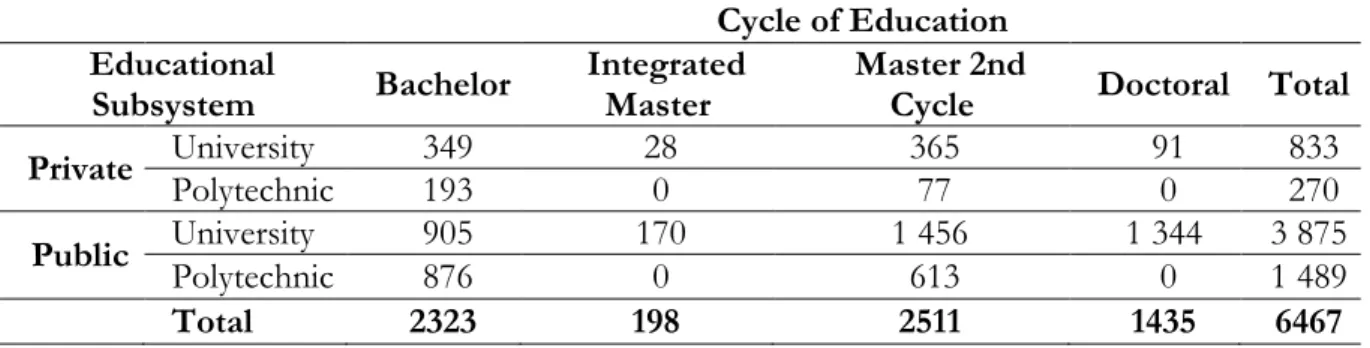
13 Table 2: Number of Degrees by Cycle of Education
Cycle of Education Educational
Subsystem Bachelor Integrated Master Master 2nd Cycle Doctoral Total
Private University 349 28 365 91 833
Polytechnic 193 0 77 0 270
Public University 905 170 1 456 1 344 3 875
Polytechnic 876 0 613 0 1 489
Total 2323 198 2511 1435 6467
Based on: (DGEEC, 2017)
Out of the total 6467 degrees that are divided amongst the 4 levels of education highlighted, the majority belong to the public system. Private universities and polytechnics, despite making up more than a third of the total number of institutions, only offer roughly a fifth of the total number of programs. Also noteworthy is the fact that polytechnics offer less than a third of the total number of degrees, despite being more numerous than their counterparts.
But more important than the number of existing facilities and degrees is the actual number of students that attend them. Table 3 contains the figures the total number of students who attend each different subsystem, while also illustrating how each gender is represented.
Table 3: Enrollments by Gender Gender
Educational subsystem Men Women Both Public University 87 777 99 301 187 078
Polytechnic 52 199 57 953 110 152
Private University 18 858 25 190 44 048
Polytechnic 7 287 10 354 17 641
Total 166121 192798 358919 Source: (DGEEC, 2018a)
The fact that the majority of students is enrolled in the public system is unsurprising, given that public universities and polytechnics offer a far higher number of degrees than their private counterparts. The number of female students is higher both in total and regarding each subsystem specifically.
It is also relevant to understand how students are distributed geographically, as Portuguese higher education is often thought to be concentrated in the country’s
14 two major urban areas, those of Oporto and Lisbon. Table 4 illustrates how students are divided regionally, by NUTS II.
Table 4: Enrollments by NUTS II NUTS II Educational
subsystem North Center
Lisbon Metropolitan
Area Alentejo Algarve Madeira Azores Total
Public University 52 227 37 879 82 413 6 159 3 685 2 400 2 315 187 078
Polytechnic 35 991 38 273 23 082 8 386 3 735 258 427 110 152
Private University 19 054 1 644 23 063 0 287 0 0 44 048
Polytechnic 9 691 589 6 468 318 113 462 0 17 641
Total 116963 78385 135026 14863 7820 3120 2742 358919
Source: (DGEEC, 2018a)
As we can see, there is a high concentration of students in the Lisbon Metropolitan Area and in the North. At the other end of the spectrum, the lowest number of enrollments correspond to the island territories of the country. Public polytechnic students are more evenly distributed throughout the country, when compared with the other subsystems. This emanates from the previously mentioned decentralization efforts made in 1980’s, which resulted in the public polytechnic institutes being more evenly divided over the country, when compared to public universities (Sá, Amado Tavares, Justino, & Amaral, 2011).
Finally, we turn to Table 5 in order to understand students’ choices in terms of their preferred education and training area.
Table 5: Enrollments by CNAEF Educational
subsystem
Public Private
University Polytechnic University Polytechnic Total
Education and Training Area (CNAEF) Agriculture, Silviculture, Fishery and Veterinary Sciences 4 186 3 156 716 0 8 058 Arts and Humanities 22 149 9 796 3 869 1 592 37 406 Corporate, Administrative
and Law Sciences 28 269 28 213 16 264 4 663 77 409
15 Table 6: Enrollments by CNAEF (continuation)
Educational subsystem
Public Private
University Polytechnic University Polytechnic Total
Education and Training Area (CNAEF) Engineering, Transforming Industries and Construction 46 831 25 682 3 033 493 76 039 Health and Social Protection 21 494 23 060 4 922 6 355 55 831 Information and Communication Technologies 3 977 3 802 595 1 020 9 394 Natural, Mathematical and Statistical Sciences 19 935 738 654 102 21 429 Services 6 307 9 929 3 572 2 305 22 113 Social Sciences, Journalism and Information 27 210 1 795 9 595 38 38 638 Miscellaneous 253 0 43 0 296 Total 187078 110152 44048 17641 358919 Source: (DGEEC, 2018a)
Within the fields listed, the “Engineering, Transforming Industries and Construction” and “Corporate, Administrative and Law Sciences” areas stand out, with their combined total adding up to roughly 42% of the student population. “Health and Social Protection” also deserves special mention, attracting approximately 15% of all students.
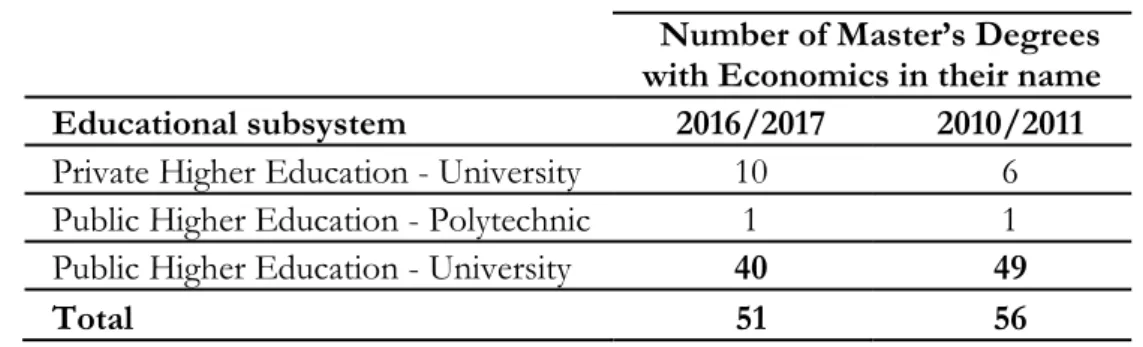
A student who wants to pursue a second degree in the field of Economics has a plethora of options to choose from. The bulk of the programs made available are part of the public university system, but there are also a significant number of private universities that offer second degrees in this field. There is even an option for those who wish to enroll in polytechnic education.
16 Table 7: Degrees in Economics
with Economics in their name Number of Master’s Degrees
Educational subsystem 2016/2017 2010/2011
Private Higher Education - University 10 6 Public Higher Education - Polytechnic 1 1 Public Higher Education - University 40 49
Total 51 56
Source: (DGEEC, 2011, 2017)
Despite the significant range of programs offered, the total number of second degrees in the field has diminished slightly since 2010/2011, due entirely to a scaling back in the public offering. The number of private programs made available has increased since 2010/2011, but not enough to counterbalance the contraction in the public system.
Table 8: Enrollments in the Field of Economics
2016/2017 2010/2011
Educational subsystem Men Women Both Men Women Both
Private Higher Education –
University 60 63 123 30 41 71
Public Higher Education –
Polytechnic 5 25 30 0 11 11
Public Higher Education -
University 778 776 1554 779 899 1678
Total 843 864 1707 809 951 1760
Source: (DGEEC, 2011, 2017)
Regarding enrollments, the total number of students in the field has remained similar to 2010/2011. While the public university system seems to have slowed down, mostly due to the lower number of women enrolled, the other systems seem to have experienced some degree of growth. This seems to mirror the transformation felt in terms of supply, with fewer Public University degrees available and more Private programs in their place, as seen above. Regarding gender specifically, the trend of more female students studying Economics seen in 2010/2011 is still noticeable to this day, although this discrepancy is at a lower level currently.
3.2.2 Attainment
To further understand students’ success, we turn to DGEEC’s study on higher education attainment in 2017, which garnered numerous headlines and significant
17 media coverage, given its depiction of the current state of the Portuguese educational system and recommendations towards attaining the goals of the Europe 2020 strategy (Gonçalves, 2018; Inácio, 2018; Silva, 2018b). The study focused on students who enlisted in 3-year first degree programs, after 4 years have passed since their entry in the higher education system, stating that only 46% of them had concluded their degree after this period, while a significant percentage remained in the higher education system, either in the same program (14%), or in a different program to the one in which they first enrolled (11%). Finally, and most notably, 29% of students did not attain a diploma and were not registered in any institution of higher learning, having effectively dropped out of tertiary education.
Despite only covering first degrees, the study reaches many conclusions that can be of interest to our work. For instance, although the percentage of graduates does not shift significantly for all subsystem of higher education, there is a large difference in terms of dropout among them, with the phenomenon being more likely to occur for polytechnic students than for university students and for students enrolled in private institutions when compared with those in the public system (P. E. J. O. B. DGEEC, 2018). The report also confirms the positive effect of a student enrolling in his most preferred program, as well as an inverse relation between the rate of abandonment and the student’s grade of entry. Also mentioned is the negative correlation between parental education attainment and dropout. Finally, the study touches upon gender disparities, concluding that female students achieve better results across all fields of study than their male counterparts, both in terms of timely attainment and abandonment (P. E. J. O. B. DGEEC, 2018).
Regarding timely attainment, and taking into account all educational subsystems (polytechnic and university, private and public), the most recent figures provided by DGEEC report a total of 65 391 students graduated from either the first, second or third cycles of tertiary education in the 2015/2016 curricular year (DGEEC, 2018b). Table 9 provides a closer look at graduates from all master degrees in the system.
18 Table 9: Number of Graduates and Average Number of Enrolments
2015/2016
Educational Subsystem Graduates Number of Average Enrollments
Private Higher Education - Polytechnic 33 2,40 Private Higher Education - University 145 2,60 Public Higher Education - Polytechnic 278 2,52 Public Higher Education - University 529 2,45
Total 985 2,48
Based on: (DGEEC, 2018b)
These figures are not of much use to us by themselves, but together with Table 10, allow for better understanding of how 2nd degrees with Economics in their name
fair within their subsystem.
Table 10: Number of Graduates and Average Number of Enrolments in Economics 2015/2016
Educational Subsystem Graduates Number of Average Enrolments
Private Higher Education - University 180 2,80 Public Higher Education - Polytechnic 5 2,60 Public Higher Education - University 1563 2,65
Total 1748 2,67
Based on: (DGEEC, 2018b)
At first glance we can see that, on average, students in the field of Economics do not finish their second degree in a timely fashion. Despite this being also the case for the system as a whole, Economics students on average take longer to graduate. Furthermore, public institution students fair quite well compared to their colleagues from the private subsystem, a trend that is only seen for University students in the complete sample.
3.3 Future
Since we have covered the past history of the Portuguese higher education system and painted a portrait of the current state of affairs, it is only logical to take a glimpse into the future, bearing in mind the important goals set by the Europe 2020 program. In July of 2016, DGEEC published their projections for the evolution of the rate of higher education degree attainment for individual between the ages of
19 30 and 34 until the deadline of the Europa 2020 program. The study estimates four possible outcomes regarding this index, with the “base”, “optimist” and “pessimist” scenarios projected all falling short of the 40% mark desired for the year 2020 (the numbers predicted are 31,3%, 33,6% and 31,1% respectively). Only in the “convergence” scenario does the Portuguese education system accomplish the desired objective, but only if the system experiences a substantial increase in the number of graduates between the age of 26 and 32. These would have to come from short-cycle degrees, returning dropouts/stopouts or from outside the country, either in the form of returning nationals or foreign graduates (DGEEC, 2016). As a side note, according to a recent report by Eurostat, the actual value for this index in 2017 was 33,5% (LUSA, 2018). At first glance this number seems encouraging, since it actually exceeds DGEEC’s “base”, “optimist” and “pessimist” projections for the year (31,4%, 32,1% and 31,2% respectively). Unfortunately, it still falls short of the 34,4% projected by the “convergence” scenario, which is a setback to the hopes of achieving the 40% mark in 2020 (DGEEC, 2016).
But what of the road towards these goals and the future of Portuguese higher education in general? The Portuguese Natural Reform Plan mentions stimulating student R&D initiatives in order to reduce dropout and promote academic success. Additionally, it specifies closely monitoring the actions of the institutions that focus on the promotion of academic success. Presently, the Portuguese educational system is in the midst of a slight restructuring, with policies such as the reduction of available vacancies in Oporto and Lisbon (with the goal of reducing discrepancies between these cities and the rest of the country)(Jornal de Notícias, 2018b), the end of integrated master degrees (Jornal de Notícias, 2018a) and the possibility for polytechnic institutes to offer doctoral degrees (Silva, 2018a), among others, being implemented.
These adjustments were conceived in response to the OECD’s “Review of TERI in Portugal”, published in February of this year. This report not only contains an assessment of the Portuguese tertiary education, research and innovation system, but also identifies key opportunities for improvement and suggests interesting policies for the Portuguese State to achieve it (D. G. P. L. S. R. T. W. OECD, 2018). Commissioned by the Government of Portugal, this review is of crucial importance
20 to our work, particularly in what pertains to the tertiary education portion of the report.
Among the numerous criticisms put forward by the OECD is the lack of an overarching national strategy regarding tertiary education. Such a strategy is necessary to guide the organizations responsible for higher education, research and innovation. Also touched upon are the sub-par tertiary attainment rates and the limited flexibility in terms of degree program offering. As noticed, Portugal’s tertiary education attainment rate remain lower than the OECD average and fall s short of the goals determined by the EU or the country itself. As a response, the OECD suggests widening access to tertiary education, and providing more diversity to the educational offer, thus broadening the spectrum of students recruited. To the OECD, the entry process into higher education also needs some fine tuning, as the Regime Geral de Acesso (RGA) neglects students from the vocational upper secondary education, who mostly from the lower socio-economic spectrum of Portuguese society. Finally, there is a need to complete the unfinished student-level data system, regarding enrolment, completion and labor market outcomes. This information not only allows students to make more informed decisions, but can also be used to improve the upper secondary education system, raising its quality and strengthening its coordination with tertiary education (D. G. P. L. S. R. T. W. OECD, 2018). The recommendations put forward by the OECD clearly center more on increasing attainment rates by widening access to higher education (D. G. P. L. S. R. T. W. OECD, 2018), than on targeting dropout and effectively reducing it. However, some of the suggestions put forward, such as the increase in the diversity and relevance of the degrees offered, may in fact reduce the occurrence of the problem.
21
4. Methodology
4.1 Research Goals and Dataset
In an attempt to produce streamlined and relevant results and conclusions, we defined a set of questions we wish to answer. This section will concern itself with presenting the questions selected, in no particular order, as well as the variables that will contribute towards the corresponding answers.
Since we are concerned with dropouts, we need a measure of the relevant phenomenon. Our dataset includes the total number of enrollments in 2016 and 2017, the most recent available, of first-time enrolments in 2017, and of graduates in 2016, for every pair of organic unit and course. We chose the most recent years with reliable data available. Our source is DGEEC.
With these variables, we calculated an indicator for the magnitude of dropout behavior in 2016 (𝐷16):
Equation 1: Calculating the Number of Dropouts 𝐷16= 𝐸16− (𝐸17− 𝐸𝑠𝑡17) − 𝐺16
Here, 𝐸16 refers to enrollments in 2016, 𝐸17 to enrollments in 2017, 𝐸𝑠𝑡17 to first time enrollments in 2017 and 𝐺16 to 2016 graduates. The thought process behind Equation 1 is to subtract the students that either graduated or continued their studies from the group of students enrolled in 2016, thus obtaining an indicator of the magnitude of dropouts for that year. While simple, this method does not yield the actual number of dropouts, as it does not account for transfers across organic units, or cases of students that graduate without enrolling. Indeed, the indicator is negative in almost 10% of pairs. For this reason, we emphasize that this indicator is a measure of dropout behavior. Fortunately, there is no reason to expect those unobserved phenomena to be correlated with any variable of interest. Still, we apply several estimation strategies to ensure robustness.
All pairs of organic units and courses are included, except for those belonging to the University of Azores and a few other units in institutions that underwent
22 administrative restructuring during the years we focus on3. Military schools were
also eliminated.
Besides the variables used to calculate the measure of dropout, courses were also characterized by name, official code, degree level, field of study, institution, organic unit, their corresponding subsystems (public or private, university or polytechnic), as well as regional location (NUTS II, NUTS III, district and municipality) . A measure of employability was also included, given by the number of graduates enrolled in an employment center in 2016 divided by the number of graduates between 1984 and 2015.
The role of teachers in education is self-explanatory and their influence on students is unquestionable. With this in mind, we included in our dataset the number of permanent and guest teachers employed in each organic unit. While the impact of educators and their methods on student’s decisions is hard to measure, we can infer their importance through two selected ratios: the number of teachers per enrolled student and the percentage of guest teachers employed. The former provides us with a proxy for class size, while the latter allows us to measure the impact of teacher motivation/commitment. We are aware that measuring the influence of teachers using only their numbers is flawed, as the quality of their craft is not quantifiably measured. Still, it stands to reason that the performance of a teacher is constrained by the number of students under his care and that student performance suffers in classes excessive pupils (Matta, Guzman, Stockly, & Widner, 2015).
Quite a few authors relate the decision to abandon higher education with social integration, while others choose to focus on monetary constraints in order to better understand dropout. Regardless of which of the two approaches is more adequate or relevant, it is clearly vital to describe the student population beyond the total number of enrollments. With this in mind, we aim to find patterns between specific features of students and dropout. To achieve this, we collected data on the student-body enrolled in each course, namely the number of grant recipients, of workers and part time students, both in total and for each gender. All of these will be calculated as ratios in our estimation, in relation to the the total number of students.
3Higher School of Industrial Studies and Management, D. Afonso III Superior Institute, Institute of Art,
23 Finally, as covered previously, Portugal suffers from a notorious skill gap, consistent with the country’s low average level of education. In this context, obtaining a higher education degree enables individuals to collect highe r wages when entering the workforce, that should compensate the financial effort associated with their studies. If students expect this not to be the case, the temptation to drop out will grow larger and their motivation to complete the degree might waver. Given this dynamic, we deemed vital to obtain a grasp of how the labor market influences persistence and abandonment in the context of higher education.
Thus, the average monthly wage disparity, i.e. the dispersion in wages among individuals with different levels of education, was included, in hope of illustrating the reward for obtaining higher education. Likewise, the average income received in the institution’s municipality was also included, to represent the choice tertiary education students face between receiving a salary corresponding to a secondary education diploma (by dropping out and entering the workforce), or enduring the present-day costs associated with their degree, in order to obtain higher wages post-graduation.
With this data, we wish to answer the following Research Questions: RQ 1: What is the impact of wages on dropout behavior?
RQ 2: Do observed determinants of dropout behavior have a different impact on programs leading to a Bachelor degree or a Master’s degree?
RQ 2.1.: What is the impact of the several determinants of dropout behavior on programs leading to a Masters degree?
RQ 3: Do observed determinants of dropout behavior have a different impact on courses in different fields of study?
RQ 3.1.: What is the differential impact of the several determinants of dropout behavior on Masters in Economics?
RQ 4: Do observed determinants of dropout behavior have a different impact on programs depending on the subsystem of the organic unit?
RQ 5: What is the impact of teaching personnel on dropout behavior?
RQ 6: Do the determinants of dropout behavior have a different impact on each gender?
24 4.2 Estimation
Since dropouts are a number of students per year, our estimation employs count models. Count data reports the number of incidences that occur in a given period, which in our case is the number of individuals that decided to drop out of higher education in the 2016/2017 curricular year. This section will concern itself with estimating three different regression models, namely, Ordinary Least Squares (OLS), Poisson and Negative Binomial.
The OLS regression is a staple of econometric studies, and as such will be used as a tool to assess the data at hand and its characteristics. In particular, it will serve to bolster our belief that our dependent variable is a good measure of dropout behavior. However, while it is theoretically possible to apply this model to count data (Greene, 2012), the model suffers from numerous shortcomings in such scenarios (Winkelmann, 2008). In cases such as ours, multiple linear regression tends to generate inaccurate or inefficient results, due to the discrete nature of the values and the predominance low values present in the database (Greene, 2012). Therefore, the OLS model will serve merely as a tool for exploratory purposes. Next, we will employ maximum likelihood methods to estimate the Poisson Regression Model (PRM), the most important count data model (Winkelmann, 2008), and its most common alternative (Greene, 2012), the Negative Binomial Regression Model (NBRM). If the density function does not follow a Poisson distribution, the Poisson Regression is still able to produce consistent results, provided that the conditional expectation is correctly specified – in which case the estimation is obtained through pseudo-maximum likelihood (Winkelmann, 2008). These estimation methods generally provide the best results for count data, but our database needs a bit of fine-tuning in order to utilize them, given that these models only include non-negative integer values (Greene, 2012). As the negative values in our database are a product of flaws in sampling, we will consider two scenarios: in the first, we will assume that the negative values are equal to zero, and in the second we will simply disregard them and remove them from the database. Both models will be tested for each of these situations, allowing us to decide which options produces the more robust results. The OLS model will also be tested under these last two scenarios, as it may provide clues towards a more enlighten decision.
25 4.2.1 OLS
We will begin by analyzing and comparing the results obtained by using an OLS regression in each of the three possible scenarios. The multiple linear regression model being utilized is as follows:
Equation 2: OLS Model 𝑦𝑖 = 𝑥𝑖1𝛽1+ 𝑥𝑖2𝛽2+ ⋯ + 𝑥𝑖𝑘𝛽𝑘+ 𝜀𝑖
Three separate estimations were calculated using the OLS regression: the first with the database in the original state, another with the negatives figures being equal to zero and, lastly, with the negatives values being disregarded. These estimations were done with robust standard errors, to account for heteroskedasticity and other phenomena that might invalidate inference. The results obtained can be found in an appendix.
First and foremost, the OLS model has some explanatory power for all iterations of the database, given that the p-value for each F test indicates that all three estimations are statistically significant for all confidence levels. As such, to determine which estimation produces the best results, we will consider each coefficient of determination, or R-squared. This coefficient expresses how well the regression fits the data, as it measures the percentage of the variation in the dependent variable that is explained by variations on the regressors (Greene, 2012). The OLS estimation regarding the database that disregards the negative values seems to be superior, as % of the variation in Dropout is explained by the independent variables selected.
As for the coefficients produced, their estimated value is similar across the three scenarios. This justifies our decision to tackle the negative values in our database, as their treatment does not seem to affect the outcome of the estimation. The same conclusion can be drawn from observing the R-squared statistic, as it also remains similar for all iterations of the OLS estimation.
We will spend no more words on the product of this estimation (which can be found in the attachments of this dissertation), as it is not the most effective way to approach the task at hand. The next section will concern itself with models that are tailored towards count data and, thus, are worthier of our time and attention.
26 4.2.2 PRM VS NBRM
The more adequate alternatives to tackle count data are the Poisson regression and the Negative Binomial Regression (Greene, 2012). According to the Poisson model, the probability of the dependent variable Y assuming a certain value y is :
Equation 3: Poisson Probability Function 𝑃(𝑌 = 𝑦|𝑥𝑖) =
𝑒−𝜇𝑖𝜇
𝑖𝑦𝑖 𝑦𝑖!
, 𝑦𝑖 = 0, 1, 2, … The most common formulation for 𝜇𝑖 is the loglinear model:
Equation 4: Formulation for 𝜇𝑖
ln 𝜇𝑖 = 𝑥𝑖 ,𝛽
This formulation for 𝜇 is appropriate to the model, as it ensures that the parameter remains positive regardless of the estimation’s remaining values. As for the expected number of events it is express as:
Equation 5: Expected Number of Events 𝜕𝐸[𝑦𝑖|𝑥𝑖]
𝜕𝑥𝑖
= 𝜇𝑖𝛽
As the dependent variable is a count variable, the Poisson regression models the dependent variable as the log of the expected count. Consequently, the coefficients obtained can be interpreted as semi-elasticities, i.e. the variation in the log of expected counts generated by a one-unit increase/decrease in the corresponding independent variable. In other words, if the independent variable increases by 1, the dependent variable increases by 𝛽%, and vice-versa.
The benefit of the Poisson regression is that it acknowledges the non-negative integer properties of Y (Winkelmann, 2008). The model assumes a distribution with the parameter 𝜇, which is a positive value equal to the mean and variance. This leads to one of the main characteristics of the model, equidispersion, i.e. the fact that the mean and variance are identical (Winkelmann, 2008). The restrictiveness of this property can be problematic, as the model does not hold up if the variance of the distribution is higher than its mean (overdispersion) (Greene, 2012). However, the regression is still robust, even without the presence of equidispersion, i.e. when the variance takes a value different than the mean (Winkelmann, 2008).
27 In such situations, the Negative Binomial Model might be more appropriate. The Negative Binomial Regression model is similar to the Poisson model, but with the addition of a more flexible variance function. This is done by adding 𝛿 as a representation for unobserved error (which follows a gamma distribution of E(𝛿𝑖)=1) to the probability function.
Equation 6: Negative Binomial Distribution 𝑋~𝑁𝑒𝑔𝑏𝑖𝑛(𝛼, 𝛿), 𝛼 ≥ 0 ∩ 𝛿 ≥ 0 Equation 7: Negative Binomial Probability Function 𝑃(𝑌 = 𝑦|𝑥𝑖) = 𝛤(𝛼 + 𝑦𝑖) 𝛤(𝑦𝑖+ 1)𝛤(𝛼)𝑟𝑖 𝑦𝑖(1 − 𝑟 𝑖)𝛼, ln 𝜇𝑖 = 𝑥𝑖′𝛽 , 𝑟𝑖 = 𝜇𝑖 (𝛼 + 𝜇𝑖)
The model can be interpreted as particular form of a Poisson model that attributes a value to the randomness of 𝜇 (Winkelmann, 2008). Just as in the case of the Poisson regression, the model computes the dependent variable as the log of the expected count. The coefficients generated can be interpreted as the variation in the log of expected counts of y generated by a one unit increase in xi. The mean and
variance of the model are:
𝐸(𝑋) = 𝛼𝛿 𝑉𝑎𝑟(𝑋) = 𝐸(𝑋)(1 + 𝛿)
These specifications almost guarantee that the variance of the distribution is higher than its mean, making the Negative Binomial Model capable of fulfilling the flaws of the Poisson Model in what concerns overdispersion. Thus, the model is substantially more flexible than its counterpart, particularly in terms of the variance (Winkelmann, 2008).
With these specification in mind, we set out to decide which of the two models can better accommodate the necessities of our intended estimation, in each of the two scenarios considered. Considering the database, it seems more likely that it would follow a Negative Binomial Distribution, with the individual Bernoulli tests representing each student’s decision to abandon higher education. Furthermore, the finite number of individuals in the sample provides a “ceiling” that might be incompatible with the specifications of the Poisson distribution.
We begin by estimating each model using the two alternatives for correcting the negative values regarding the dependent variable. Table 11 provides the resulting
28 coefficients and standard errors. Most importantly, these estimates show that, whatever the selected strategy for dealing with the negative values, the results are similar within each model.
Table 11: PRM and NBRM coefficients
Neg=zero No neg
PRM NBRM PRM NBRM
Monthly Wage Disparity -0.00873 -0.0129** -0.00395 -0.00726 (0.00590) (0.00578) (0.00564) (0.00543) Average Monthly Wage 0.000323*** 0.000190* 0.000274*** 0.000157 (0.000109) (0.000109) (0.000106) (0.000102) Log of Enrolments 2016 0.667*** 0.680*** 0.639*** 0.637*** (0.0174) (0.0147) (0.0172) (0.0139) Enrolments 2016 – Student Workers 0.831*** 0.854*** 0.837*** 0.837*** (0.129) (0.114) (0.122) (0.107) Enrolments 2016 – Scholarship -0.799*** -0.697*** -0.800*** -0.655*** (0.122) (0.114) (0.121) (0.107) Enrolments 2016 – Part-Time -0.253 -0.503*** -0.251 -0.523*** (0.186) (0.182) (0.179) (0.176) Teacher-Student Ratio -0.00170** -0.00208*** -0.000980 0.00164*** -(0.000687) (0.000583) (0.000604) (0.000498) Percentage of Guest Teachers -0.133 0.0791 -0.127 0.0633
(0.130) (0.0878) (0.129) (0.0847) Education Subsystem – Public 0.192*** 0.229*** 0.181*** 0.223***
(0.0568) (0.0431) (0.0556) (0.0411) Type of Institution - University 0.117*** 0.137*** 0.122*** 0.142***
(0.0446) (0.0406) (0.0437) (0.0387) Cons -0.631*** -0.503*** -0.538*** -0.392***
(0.143) (0.128) (0.139) (0.120)
Note: *** p<0.01, ** p<0.05, * p<0.01
To compare between the Poisson and the NBR, we employed Stata’s “countfit” command. We will first instruct the software to change the negative values to zero and then run “countfit”, which generates two noteworthy outputs that can aid our decision. The first, displayed in Figure 1, compares the residual values of each of the estimation models, while the second, presented in Table 12, indicates which is more adequate through the three fit measures: the Bayesian Information Criterion (BIC), Akaike’s Information Criterion (AIC) and The Likelihood.Ratio Chi -Square (LRX2).
29 Figure 1: Deviations for PRM and NBRM models
Both estimations seem to generate higher residuals for lower values, with the zero count being that at which they are least effective, which is unsurprising. Besides that, the Negative Binomial Regression Model seems to perform better overall, generating residuals closer to null.
Table 12: PRM vs NBRM
PRM BIC=33118.117 AIC= 33051.052 Prefer Over Evidence Vs NBRM BIC= 20283.281 dif= 12834.836 NBRM PRM Very strong
AIC= 20210.119 dif= 12840.933 NBRM PRM LRX2=12842.933 prob= 0.000 NBRM PRM p=0.000
Across the board, each of the fit measures utilized give the advantage to Negative Binomial Regression Model over its counterpart, with a very strong statistical significance. This evidence supports the finding provided by Figure 1, leading us to believe that the Negative Binomial Regression is the most adequate model for the task at hand.
Let us now instruct Stata to consider only the non-negative values in our database and run the “countfit” command.