138
LOSSES IN WHEAT CROP AS A FUNCTION OF THE WATER CONTENT OF THE GRAINS AT HARVEST
Fernando Shintate Galindo1, João Luis Zocoler1, Marcelo Carvalho Minhoto Teixeira Filho1, Salatiér Buzetti1, José Mateus Kondo Santini1, Cleiton José Alves1, Mariana Gaioto Ziolkowski Ludkiewicz1
1Universidade Estadual Paulista ''Júlio de Mesquita”. Faculdade de Engenharia de Ilha Solteira, Ilha Solteira -SP. E-mail:
[email protected]; [email protected]; [email protected]; [email protected]; [email protected]; [email protected]; [email protected]
ABSTRACT
The objective of this research was to evaluate the harvest point for the wheat crop, associated maximum grain yield and productive components with different harvest moisture and losses on natural drying in the field with different water levels in grain. The treatments consisted of the following crop moisture levels (on wet basis) of the grains: 27.9 (point of full physiological maturity), 22.6; 19.9; 18.1; 15; and 12.9%, evaluating the number of spikelets per spike, number of void grains, number of grains per spike and per spikelet, percentage of lodging, thousand grain mass, number of ears per meter, hectoliter mass, and yield. The largest wheat yield was obtained with the grain harvest at physiological maturity point, decreasing linearly until natural drying to 13% (on a wet basis).
Keywords: Triticum aestivum, grains productivity, components production
PERDAS OCORRIDAS NA CULTURA DO TRIGO EM FUNÇÃO DO TEOR DE ÁGUA DOS GRÃOS NA COLHEITA
RESUMO
Objetivou-se avaliar o ponto de colheita ideal para a cultura do trigo, associado à máxima produtividade de grãos e componentes produtivos, bem como as perdas com a secagem natural em campo com diferentes teores de água no grão, em ocasião de colheita. Os tratamentos consistiram na colheita nos seguintes níveis de umidade (à base úmida) dos grãos: 27,9 (ponto de maturidade fisiológica plena), 22,6; 19,9; 18,1; 15 e 12,9%, avaliando-se o número de espiguetas por espiga, de grãos chochos, de grãos por espiga e de grãos por espigueta, porcentagem de acamamento, massa de mil grãos, número de espigas
139 por metro, massa hectolítrica e produtividade. A maior produtividade de trigo foi obtida com a colheita de grãos no ponto de maturidade fisiológica, decrescendo linearmente até a secagem natural a 13% (à base úmida).
Palavras-chave: Triticum aestivum, produtividade de grãos, componentes de produção
INTRODUCTION
Of the total grain produced in the world, about 30% corresponds to wheat, which is the crop with the largest cultivated area (223.5 million ha-1) and the second largest production (689.9 million tons). It is considered a cereal of extreme importance for human food through its derivatives (FIGUEIREDO et al., 2013). China is the world's largest wheat producer with about 14.5% of the total, followed by the European Union, India and the United States (OCDE-FAO, 2015).
In the 2015 harvest, the Brazilian area planted with wheat was about 2.0 million hectares, with production of 5.6 million tons and average productivity of 2.89 t ha-1, with the southern region accounting
for approximately 90% of national production (CONAB, 2016). In this context, the Cerrado region of Central Brazil has great potential for the expansion of the wheat crop, as it offers optimum climate and soil conditions, a strategic market position and industrialization capacity, as well as being able to be harvested in the off-season harvest of South Brazil and Argentina and, with superior characteristics of industrial quality for baking (TEIXEIRA FILHO et al., 2011).
The quality of the wheat grain can be defined as a result of the interaction that the crop undergoes in the field, the effect of the soil conditions, the crop management, the cultivar, as well as the harvesting, storage and milling operations (GORJI et al., 2010). In addition, it is important to note that wheat production may be affected by changes in the physical, chemical, and rheological properties of the wheat, thus reducing the commercial value of the flour (ELIAS et al., 2009).
The period between physiological maturity and grain harvest is critical because the grains remain attached to the plant and exposed to the action of biotic and abiotic factors. The losses begin before harvesting due to natural dehiscence, pests, fruit drop and plant tipping, being more accentuated the longer the harvest delay and the lower the grain water content (TEFERA et al., 2011). In order to obtain a harvest with reduced qualitative and quantitative losses, it is necessary for the producer to be attentive in order to identify, quantify and correct the possible sources of losses before and during the harvest (BAUER & GONZATTI, 2007; CÂMARA et al., 2007, and FERREIRA et al., 2007).
140
In the literature there is some disagreement between the authors as to the ideal point to perform the harvest of the crop and at the same time to minimize the quantitative losses. According to Marques et. al. (2011), Schuh et al. (2011) and Di Domenico et al. (2015), the physiological maturity point would be the ideal time for harvesting, because it is at this phenological stage that the cereal grains present the highest quality, the maximum accumulation of dry mass and the low incidence of pathogens that cause deterioration of grains. For Figueiredo et al. (2013), the ideal value to start harvesting is 16 to 15% humidity. According to Portella (2002), the ideal harvest point should start between 18 and 16% and finish with 14 to 13% water content in the grains, due to the decrease of water in the grains as the culture, facilitating the cleaning and degrana of the material.
Based on the above, the objective was to evaluate the ideal harvesting point for wheat crop, associated with maximum yield and productive components, as well as the losses with natural drying in the field with different water contents in the grain, at harvest time.
MATERIAL AND METHODS
The experiment was conducted in the experimental area belonging to the Faculty of Engineering - UNESP, located in Selvíria, State of Mato Grosso do Sul, Brazil, (altitude of 335 m). Soil of the experimental area was classified as a Oxisol, with clay texture, according to EMBRAPA classification (2013), which was cultivated by annual crops for more than 27 years, the last 10 years being in a no-tillage system and the crop before sowing of wheat was corn, preceded by oats. Rainfall during the crop cycle was 152.3 mm, while mean temperature and relative humidity were 22.9 oC and 67.4%, respectively. The rainfall, air relative humidity, minimum, average and maximum temperatures during the experiment were registered (Figure 1). The climatic type in the region is Aw, according to Köppen characterized as tropical humid with rainy season in summer and dry in winter.
The experimental design was a randomized complete block design with six treatments and four replications. The treatments consisted of harvesting at the following levels of grain water content: 27.9 (full physiological maturity point), 22.6; 19.9; 18.1; 15 and 12.9% wet basis (w.b.). The harvest of each treatment occurred, respectively, on 08/28/2014, 09/02/2014, 09/04/2014, 09/09/2014, 09/08/2014 and 09/12/2014, the equivalent of 98, 103, 105, 107, 109 and 113 days after emergence of wheat. Harvesting was done manually with a cutlass, and the grains were harvested immediately after harvesting, simulating the mechanized harvesting effect. The experimental plots were 6 m long with 12 rows of wheat plants spaced 0.17 m, with plot area the 6 central lines, excluding 0.5 m from the extremities.
141
Figure 1. Rainfall, average and minimum temperatures obtained from the weather station located in the
Education and Research Farm of FE / UNESP during the cultivation from May/2014 to September/2014
The chemical attributes of the soil in the arable layer determined before the installation of the experiment, according to methodology proposed by Raij et al. (2001), presented the following results: 13 mg dm-3 of P (resin); 6 mg dm-3 of S-SO
4; 23 g dm-3 M.O .; 4.8 pH (CaCl2); K, Ca, Mg, H + Al = 2.6;
13.0; 8.0 and 42.0 mmolc dm-3, respectively; Cu, Fe, Mn, Zn (DTPA) = 5.9; 30.0; 93.9 and 1.0 mg dm-3,
respectively; 0.24 mg dm-3 B (hot water) and 36% base saturation.
Based on the soil analysis and with the intention of increasing the saturation by bases to 70%, as recommended by Cantarella et al. (1997), 2.5 t ha-1 of dolomitic limestone (PRNT = 88%) was applied, 65 days before sowing of corn, a crop predecessor to wheat. In the fertilization of wheat sowing 400 kg ha-1 of 08-28-16 was given, which equates to 32 kg ha-1 of N, 112 kg ha-1 P2O5 and 64 kg ha-1 of K2O for
all treatments, based on soil analysis and wheat crop requirement.
Coverage nitrogen fertilization was performed on 06/26/2014, 35 d.a.e., using 100 kg ha-1 of N, with urea (45% N) as source. The application was done manually, distributing the fertilizer on the soil surface (without incorporation), to the side and approximately 5 cm of the rows, in order to avoid the contact of the fertilizer with the plants. After the cover fertilization the area was irrigated by spraying (blade approximately 13 mm) to minimize N losses by volatilizing the ammonia.
The experiment was conducted in a no-tillage system, the cultivar used was CD 116. Mechanical sowing was performed on 05/16/14, with 80 seeds per meter being sown and seedling emergence six
0 5 10 15 20 25 30 35 40 0 10 20 30 40 50 60 70 80 09/05/2014 09/06/2014 09/07/2014 09/08/2014 09/09/2014 R a in fa ll (m m ) M a xi m um , a v er a ge a n d m in im um te m pe ra tur es ( oC)
Precipitação T. Média T. Máxima T. Mínima
Seeding
142
days after sowing on day 22 / 05/2014. The area was irrigated by a central pivot type sprinkler system, with a mean water depth of 13 mm and a watering time of approximately 36 hours, when necessary.
The following evaluations were carried out: i) Number of ears per meter, determined by counting spikes at a point of 1 m row in the useful area of each plot at the time of harvest, using a 1 meter graduated ruler. Ten ears of wheat were collected at the time of harvesting of each treatment to count: (ii) Number of spigots per spike, (iii) Number of failed grains, (iv) Number of grains per spigot, (v) thousand grains mass, determined by counting the number of one hundred grains and extrapolated to one thousand, later weighed in a precision scale of 0.01 g, converted to 13% of humidity (bu ), (Viii) hectoliter mass, obtained on a scale of 0.25 L, corrected at 13% moisture and subsequently converted into kg 100 L-1, and (ix) grain yield determined by collecting the plants contained in the 6 principal lines, each parcel. After the mechanical track, performed according to the water content in the grains recommended for each treatment, the grains were quantified and the data transformed in kg ha-1 to 13% moisture (wet basis).
The SISVAR program was used for statistical analysis. The data were submitted to analysis of variance (test F) and linear regression for the different water contents of the wheat crop.
RESULTS AND DISCUSSION
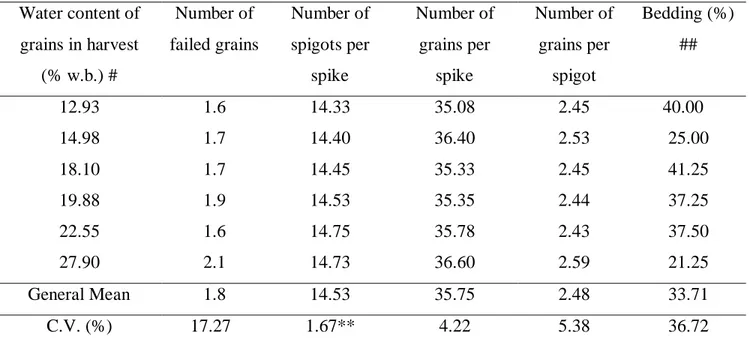
Table 1 registers the results for the number of failed grains, spigots per spike, grain per spike and grain per spigot and percentage of bedding according to the moisture content in the grains at harvest time
(Table 1).
The number of grains per spike, fail grains and grain per spigot were not influenced by the water content in the grains, a result corroborated by Lopes et al. (2007), who state that the relationships between the ear characteristics are dependent on the genotypes. According to Franceschi et al. (2009), the predominant factors, and that directly affect the technological quality of the wheat crop, with a reflection on crop productivity are genetic factors, meteorological factors, soil fertility and crop rotation.
The percentage of bedding, as well as the other parameters evaluated (Table 1) were not influenced by the water content in the grains at harvest time, although numerically the harvest delay, due to the reduction of the water content in the grains, and consequent drying in higher bedding values.
The number of spigots per spike was influenced by the water content in the grains. The anticipation of the harvest at the time when the crop reached the physiological maturity point (27.9% water content in the grains) provided a higher number of spigots per spike, adjusting to the increasing linear function (Figure 2).
143
Table 1. Number of failed grains, spigots per spike, grains per spike, grains per spigot and bedding of
wheat in function of water content of grains in harvest
# 27, 23, 20, 18, 15 and 13% moisture (wet basis) refer respectively to the wheat harvest at 98, 103, 105, 107, 109 and 113 days after emergence of wheat
## Corrected data following equation (x + 0.5) 0.5 Actual average data presented
Figure 2. Number of spigot per spike in function of water content of grains in harvest - NEE: Number
of spigot per spike; Ta: water content of grains
The anticipation of harvest in higher moisture could possibly mitigate the environmental effect incident to the number of spigots per spike, due to the smaller but numerical percentage of bedding, as
NEE = 13.9490 + 0.0299Ta (R² = 0.86) 14.30 14.40 14.50 14.60 14.70 14.80 14.90 12 14 16 18 20 22 24 26 28 N oo f spi g o t pe r spi ke
Water content of grains in harvest (%w.b.)
Water content of grains in harvest (% w.b.) # Number of failed grains Number of spigots per spike Number of grains per spike Number of grains per spigot Bedding (%) ## 12.93 1.6 14.33 35.08 2.45 40.00 14.98 1.7 14.40 36.40 2.53 25.00 18.10 1.7 14.45 35.33 2.45 41.25 19.88 1.9 14.53 35.35 2.44 37.25 22.55 1.6 14.75 35.78 2.43 37.50 27.90 2.1 14.73 36.60 2.59 21.25 General Mean 1.8 14.53 35.75 2.48 33.71 C.V. (%) 17.27 1.67** 4.22 5.38 36.72
144
well as losses of spikes and spigots caused by feeding by wild animals (rodents and birds) and degrane and natural senescence of the culture.
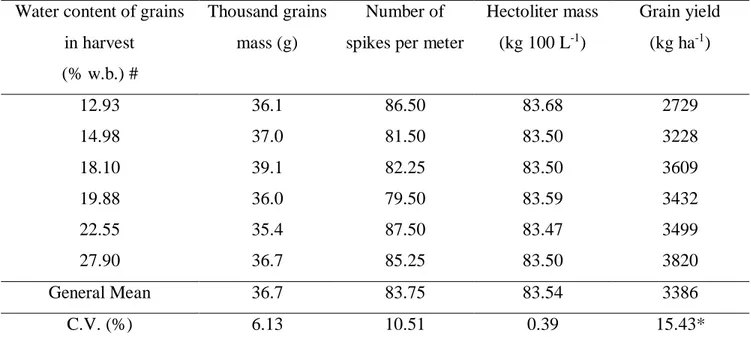
The thousand grains mass, number of spikes per meter and hectoliter mass were not influenced by the moisture of the grains when the wheat was harvested (Table 2).
Table 2. Thousand grains mass, number of spikes per meter, hectoliter mass and wheat grain yield in
function of water content of grains in harvest
* = Significant at 5% probability by F test; # 27, 23, 20, 18, 15 and 13% moisture (wet basis) refer respectively to the wheat harvest at 98, 103, 105, 107, 109 and 113 days after emergence of wheat
Figure 3. Wheat grain yield in function of water content of grains in harvest - Yield: Wheat grain yield;
Wc: Water content in grains
Yield = 2223.6216 + 59.9164Wc (R² = 0.74) 2500 2750 3000 3250 3500 3750 4000 12 14 16 18 20 22 24 26 28 G ra in Y ie ld (kg ha -1)
Water content of grains in harvest (%w.b.)
Water content of grains in harvest (% w.b.) #
Thousand grains mass (g)
Number of spikes per meter
Hectoliter mass (kg 100 L-1) Grain yield (kg ha-1) 12.93 36.1 86.50 83.68 2729 14.98 37.0 81.50 83.50 3228 18.10 39.1 82.25 83.50 3609 19.88 36.0 79.50 83.59 3432 22.55 35.4 87.50 83.47 3499 27.90 36.7 85.25 83.50 3820 General Mean 36.7 83.75 83.54 3386 C.V. (%) 6.13 10.51 0.39 15.43*
145 Carneiro et al. (2005), studying harvest, drying and storage times of wheat cultivars, also verified that the hectoliter mass was not influenced by the anticipation of the harvest and subsequent drying. Differently, Elias et al. (2009) found higher values of the hectoliter mass in the grains harvested with 18% of water in grains; in contrast, the lowest value was obtained with the grains harvested at 14% of water content and drying in the plant. According to the authors, the reduction of this variable, due to the delay in harvest, can be attributed to the metabolic processes of the grains and associated organisms, which cause consumption of their nutritional reserves during storage.
With regard to grain mass, according to Gutkoski et al. (2008), the variable can be significantly affected by any type of stress, of a biotic or abiotic nature, in which the plant is submitted after flowering. According to Schimildt (2011), most of the quantitative traits, such as productivity, are polygenic in nature and strongly influenced by the environment, so genotype x environment interaction exerts a great influence on the expression of these quantitative traits, however, it was not observed difference in grain mass as a function of the water content in the grains at the time of harvest in the present work.
The difference in size also influences the amount of water absorbed, since the small grains absorb more water in relation to the large grains during the stage of wheat condition (GUTKOSKI et al., 2008), however they are little influenced by the content of water in grains. It is noteworthy that in the present study only one cultivar was used, which would also minimize the effect of size variation of harvested grains.
According to Guarienti et al. (2005), climate-related factors such as rainfall, soil water excess and relative humidity affect negatively the hectoliter mass, thousand grains mass and grain yield, with the relative moisture of air being less influential comparing to other variables, thus raising the question that the variables mass, grain mass and grain yield can be negatively affected by incidental climatic factors, due to the delay in the harvest of wheat grains, that is, the permanence in field, with the natural drying and reduction in the water content in the wheat grains can negatively influence the productivity and quality of harvested wheat, as verified in Table 2, with the reduction of the grain yield as a function of the delay in harvest after the physiological maturity (27.9% water content in the grains).
The wheat grain yield was affected by the water content in grains at the time of harvest, adjusting to the increasing linear function (Figure 3), that is, the anticipation of harvest with highest water contents in grains, close to the point of physiological maturity (27.9%) was more advantageous. These results can be explained by the similar response obtained for the number of spigots per spike and the trend of higher bedding percentage of the plants due to the reduction of water content in grains at harvest.
146
Portella (2002), in an experiment with wheat crop, showed that the pre-harvest losses are directly related to the water content in the grains, showing a tendency to increase losses as the grain loses water. These losses are provided by the greater susceptibility of the plants to natural threshing of the spikes, bedding of plants, attack of biotic and abiotic agents of deterioration. Although the author mentions that the losses from the mechanized track are reduced when the grains are harvested drier, reaching the point of minimum loss with 16% water in the grains. Differently, Figueiredo et al. (2013) (13.2, 16.3, 18.4, 20.5, 23.4% wb), found that the losses in the wheat crop, as a function of the water contents at harvest time, varied as the water content in the grains changed, where the lowest losses were noticed in the crop when the grains had a water content of approximately 18%.
CONCLUSIONS
The number of grains, grain per spike and grain per spigot, percentage of bedding, thousand grains mass, number of spikes per meter and hectoliter mass were not influenced by the water content of the grains at the time of harvest.
The highest wheat yield was obtained by harvesting grains with water content of 27.9% (wet basis), decreasing linearly until natural drying at 13% (wet basis).
It is possible to anticipate wheat harvest near the physiological maturity point of the crop, minimizing losses in productivity due to field drying.
REFERENCES
BAUER, F. C.; GONZATTI, G. C. 2007. Efeito da umidade das sementes sobre as perdas quantitativas de soja (Glycine max (L.) Merrill) no processo de colheita mecanizada. Acta Scientiarum.
Agronomy, Maringá, v.29, n.4, p.503-506.
CÂMARA, F. T. da; SILVA, R. P. da; LOPES, A.; FURLANI, C. E. A.; GROTTA, D. C. C.; REIS, G. N. dos. 2007. Influência da área de amostragem na determinação de perdas totais na clheita de soja.
Ciência e Agrotecnologia, Lavras, v.31, n.3, p.909-913.
CANTARELLA, H.; RAIJ, B. Van; CAMARGO, C. E. O. Cereais. In: RAIJ, B. Van; CANTARELLA, H.; QUAGGIO, J. A.; FURLANI, A. M. C. Recomendações de calagem e adubação para o Estado de São Paulo. Campinas: Instituto Agronômico de Campinas, 1997, 285p. (Boletim técnico, 100). CARNEIRO, L. M. T. A.; BIAGI, J. D.; FREITAS, J. G. de; CARNEIRO, M. C.; FELÍCIO, J. C.2005.
Diferentes épocas de colheita, secagem e armazenamento na qualidade de grãos de trigo comum e duro. Bragantia, Campinas, v.64, n.1, p.127-137.
CONAB - COMPANHIA NACIONAL DE ABASTECIMENTO- Avaliação da safra agrícola
2016/2017: Décimo levantamento – Julho/2017. Brasília: CONAB, 2017. Disponible
in:<http://www.conab.gov.br/OlalaCMS/uploads/arquivos/17_07_11_17_20_26_boletim_graos_ju lho_2017.pdf>. Acess in 11 Jul. 2017.
147 DI DOMENICO, A. S.; DANNER, M. A.; BUSSO, C.; CHRIST, D.; COELHO, S. R. M. 2015. Análise de trilha da contaminação por aflatoxinas em grãos de milho armazenados. Pesquisa Agropecuária
Brasileira, Brasília, v.50, n.6, p.441-449.
ELIAS, M. C.; LOPES, V.; GUTKOSKI, L. C.; OLIVEIRA, M.; MAZZUTTI, S; DIAS, A. R. G.2009. Umidade de colheita, métodos de secagem e tempo de armazenamento na qualidade tecnológica de grãos de trigo (cv. ‘Embrapa 16’). Ciência Rural, Santa Maria, v.39, n.1, p.25-30.
EMBRAPA - EMPRESA BRASILEIRA DE PESQUISA AGROPECUÁRIA- Centro Nacional de Pesquisa de Solos. 2013. Sistema Brasileiro de Classificação de Solos. 3.ed. Brasília: EMBRAPA, 353p.
FERREIRA, I. C.; SILVA, R. P.; LOPES, A.; FURLANI, C. E. A. 2007. Perdas quantitativas na colheita de soja em função da velocidade de deslocamento e regulagens no sistema de trilha. Engenharia na
Agricultura, Viçosa, v.15, n.2, p.141-150.
FIGUEIREDO, A. S. T.; RESENDE, J. T. V. de; MORALES, R. G. F.; DIEGO, L. M.; RIZZARDI, A.2013. Influência da umidade de grãos de trigo sobre as perdas qualitativas e quantitativas durante a colheita mecanizada. Ambiência, Guarapuava, v.9, n.2, p.349-357.
FRANCESCHI, L. de; BENIN, G.; GUARIENTI, E.; MARCHIORO, V. S.; MARTIN, T. N. 2009. Fatores pré-colheita que afetam a qualidade tecnológica de trigo. Ciência Rural, Santa Maria, v.39, n.5, p.1624-1631.
GORJI, A.; RAJABIPOUR, A.; TAVAKOLI, H. 2010. Fracture resistance of wheat grain as a function of moisture content, loading rate and grain orientation. Australian Journal of Crop Science, Melbourne, v.4, n.6, p.448-452.
GUARIENTI, E. M.; CIACCO, C. F.; CUNHA, G. R. da; DEL DUCA, L. J. A.; CAMARGO, C. M. O. 2005. Efeitos da precipitação pluvial, da umidade relativa do ar e de excesso e déficit hídrico do solo no peso do hectolitro, no peso de mil grãos e no rendimento de grãos de trigo. Ciência e Tecnologia
de Alimentos, Campinas, v.25, n.3, p.412-418.
GUTKOSKI, L. C.; DURIGON, A.; MAZZUTTI, S.; SILVA, A. C. T da; ELIAS, M. C. 2008. Efeito do período de maturação de grãos nas propriedades físicas e reológicas de trigo. Ciência e Tecnologia
de Alimentos, Campinas, v.28, n.4, p.888-894.
KALKAN, F.; KARA, M. 2011. Handling, frictional and technological properties of wheat as affected by moisture content and cultivar. Powder Technology, Beijing, v.213, n.1-3, p.116-122.
LOPES, S. J.; LÚCIO, A. D.; STORCK, L.; DAMO, H. P.; BRUM, B.; SANTOS, V. J. 2007.Relações de causa e efeito em espigas de milho relacionadas ao tipo de híbrido. Ciência Rural, Santa Maria, v. 37, n.6, p.1536-1542.
MARQUES, O. J; DALPASQUALE, V. A; VIDIGAL FILHO, P. S; SCAPIM, C. A; RECHE, D. L. 2011. Danos mecânicos em grãos de híbridos comerciais de milho em função da umidade de colheita.
Semina: Ciências Agrárias, Londrina, v.32, n.2, p.565-576.
Organização das Nações Unidas para Alimentação e Agricultura OCDE/FAO. 2015. Perspectivas Agrícolas no Brasil: desafios da agricultura Brasileira 2015-2024. Disponible in:<http://www.fao.org.br/download/PA20142015CB.pdf> Acess in 11 Jul. 2017.
PORTELLA, J. A. 2002.Influência do ponto de colheita nas perdas de grãos de trigo. Passo Fundo: EMBRAPA Trigo, p.17. Circular técnica, 7
RAIJ, B. Van.; ANDRADE, J.C.; CANTARELLA, H.; QUAGGIO, J.A. 2001.Análise química para
avaliação da fertilidade de solos tropicais. Campinas: IAC. 285p.
SCHIMILDT, E. R.; NASCIMENTO, A. L.; CRUZ, C. D.; OLIVEIRA, J. A. R. 2011. Avaliação de metodologias de adaptabilidade e estabilidade de cultivares milho. Acta Scientiarum. Agronomy, Maringá, v.33, n.1, p.51-58.
148
SCHUH, G.; GOTTARDI, R.; FERRARI FILHO, E.; ANTUNES, L. E. G.; DIONELLO, R. G. 2011. Efeitos de dois métodos de secagem sobre a qualidade físico-química de grãos de milho safrinhaarmazenados por 6 meses. Semina: Ciências Agrárias, Londrina, v.32, n.1, p.235-244. TEFERA, T.; KANAMPIU, F.; DE GROOTE, H.; HELLIN, J.; MUGO, S.; KIMENJU, S.; BEYENE,
Y.; BODDUPALLI, P. M.; SHIFERAW, B.; BANZIGER, M. 2011. The metal silo: An effective grain storage technology for reducing post-harvest insect and pathogen losses in maize while improving smallholder farmers’ food security in developing countries. Crop Protection, London, v.30, n.3, p.240-245.
TEIXEIRA FILHO, M. C. M.; BUZETTI, S.; ANDREOTTI, M.; ARF, O.; SÁ, M. E. de.2011. Application times, sources and doses of nitrogen on wheat cultivars under no-till in the Cerrado region. Ciência Rural, Santa Maria, v.41, n.8, p.1375-1382.
Received in: September 06, 2016 Accepted in: April 12, 2018