DISRUPTION OF A HAPLIC CAMBISOL
Relação entre energia de gotas de chuva e energia ultra-sônica na desagregação de um Cambissolo Háplico
Bruno Teixeira Ribeiro2, José Maria de Lima3, Carlos Rogério de Mello4, Marcos Aurélio Carolino de Sá5, Geraldo César de Oliveira6
ABSTRACT
The aim of this work was to compare aggregate disruption of undisturbed soil samples by ultrasonic energy to aggregate disruption caused by the energy of simulated raindrops, to provide equations that can describe this relationship, and to evaluate whether aggregate stability, expressed by sonication method, may be used to estimate the effect that raindrops have on undisturbed soil samples. Undisturbed soil samples from A, Bi and C horizons of a Cambisol were submitted to different levels of ultrasonic energy and simulated raindrops. Sieved samples (aggregates) were also submitted to different levels of ultrasonic energy so that both disturbed and undisturbed conditions of samples could be compared. The results showed that the method using ultrasonic energy on undisturbed soil samples can simulate the amount of aggregate disruption of soil due to raindrop impact. Dispersion curves of disturbed samples may not be used to estimate the effect of raindrops on undisturbed soil samples.
Index terms: Aggregation, soil structure, ultrasound.
RESUMO
Objetivou-se neste trabalho comparar a desagregação de amostras de solo indeformadas pela energia ultra-sônica com a desagregação causada pela energia cinética de gotas de chuva simulada, estabelecer equações para descrever essa relação e avaliar se a estabilidade de agregados determinada pelas curvas de desagregação por ultra-som pode ser usada para estimar o efeito que as gotas de chuva têm sobre amostras indeformadas. Amostras indeformadas dos horizontes A, Bi e C de um Cambissolo Háplico foram submetidas a diferentes níveis de energia ultra-sônica e gotas de chuva simulada. Amostras peneiradas (agregados) também foram submetidas a diferentes níveis de energia ultra-sônica para obtenção de curvas de desagregação. Os resultados mostraram que a quantidade de solo desagregado pelo impacto das gotas de chuva pode ser simulada pela aplicação de energia ultra-sônica sobre amostras indeformadas de solo. Curvas de desagregação de amostras deformadas não podem ser usadas para estimar o efeito das gotas de chuva sobre amostras indeformadas de solo.
Termos para indexação: Agregação, estrutura do solo, ultra-som.
(Received in October 15, 2007 and approved in June 2, 2008)
INTRODUCTION
The impact of the raindrops on the soil constitutes the initial and most important phase of the erosive process. Several methods have been proposed for the evaluation of soil erosion, involving field work using natural or simulated rain (CARVALHO et al., 2007) and laboratory analyses based on soil attributes, especially, the stability of aggregates (COSTA et al., 2008). The laboratory methods present the advantage of being faster and of lower cost.
1Part of Master’s Dissertation of the first author presented to the Universidade Federal de Lavras/UFLA.
2Agronomist, Doctoral Student – Departamento de Ciência do Solo/DCS – Universidade Federal de Lavras/UFLA – Cx. P. 3037 – 37200-000 – Lavras
MG – [email protected]
3Agronomist, Ph.D., Professor – Departamento de Ciência do Solo/DCS – Universidade Federal de Lavras/UFLA – Cx. P. 3037 – 37200-000 – Lavras,
MG – [email protected] – CNPq Scholarship.
4Agricultural Engineer, Doctor, Professor – Departamento de Engenharia – Universidade Federal de Lavras/UFLA – Cx. P. 3037 – 37200-000 – Lavras,
MG – [email protected] – CNPq Scholarship.
5Agronomist, Doctor, Researcher – Embrapa Cerrados – Cx. P. 08223 – 73301-970 – Planaltina, DF – [email protected]
6Agricultural Engineer, Doctor, Professor – Departamento de Ciência do Solo/DCS – Universidade Federal de Lavras/UFLA – Cx. P. 3037 – 37200-000 –
Lavras, MG – [email protected]
Sá et al. (2000b), comparing aggregate stability evaluation methods, found that it does not just depend on the soil attributes, but also on the methodology used in the analysis.
Relationship between raindrops and ultrasonic... 815
and land use (RAINE & SO, 1993; SÁ et al., 1999, 2002). Such methodology also has been used with the objective of estimating soil erodibility (SÁ et al., 2004). However, that methodology has still not been tested as to possible results related to the energy of rain drops, in the production of soil erosion sediments.
The principle of the use of ultrasound is the phenomenon of cavitation, in other words, a physical phenomenon in which the formation, growth and implosion of micro air-bubbles occurs in a liquid medium irradiated with ultrasound (LEIGHTON, 1995; STEPHANIS et al., 1997). The phenomenon of cavitation occurring on the surface of the aggregates and in their rifts and lines of weakness is responsible for the breakup and dispersion of the primary soil particles (FRISTENSKY & GRISMER, 2008).
The analysis of soil structural stability uses aggregates separated by sieving, not taking into account the structural natural of the soil in which the union among aggregates is also important to their stability. That relationship has great influence on soil erosion susceptibility. As an example, Latosols with high gibbsite contents present a highly stable granular structure (FERREIRA et al., 1999). However, that granular structure represents lower coherence among the aggregates, facilitating the splash of the soil by rain (SILVA et al., 1995), which does not happen in other soil classes, with a block structure for instance. The use of undisturbed soil samples allows better expression of the soil response in relation to the energy imposed on the sample surface.
Therefore, the objective of this work was: i) to evaluate the disaggregation of undisturbed samples of a typical Dystrophic Tb Haplic Cambisol (CXbd), resultant from the application of ultrasonic energy compared to the aggregate disruption that is caused by the kinetic energy of simulated raindrops; ii) to obtain a mathematical equation to express the relationship between the ultrasonic energy and kinetic energy of simulated raindrops; iii) to compare the results of disaggregation curves, obtained with application of ultrasonic energy, of samples with deformed structure (sieved) and samples with undisturbed structure confined in coring cylinders.
MATERIAL AND METHODS
Undisturbed samples were collected confined in coring cylinders with a 6.35 cm diameter and 2.5 cm height, at three depths: surface, at 40 and 100 cm, representative, respectively, of the A, Bi and C horizons of a typical Dystrophic Tb Haplic Cambisol (CXbd), located on the campus of the Federal University of Lavras (21°13’42"S –
44°59’ W), Lavras, MG. The characterization of the samples involved the granulometric analysis by the pipette method (fast agitation in a cocktail shaker type agitator + NaOH 1 M) and determination of the organic matter content, according to Embrapa (1997) methodology.
The undisturbed samples were saturated with distilled water by capillarity for 48 hours and later submitted to aggregate disruption by application of ultrasonic energy and by the kinetic energy of simulated raindrops. In both disaggregation assays the treatments followed a 5x3 factorial outline, corresponding to five energy levels (ultrasonic or kinetic energy of raindrops) and three collection depths (horizons A, Bi and C), in a completely randomized design, with three repetitions.
The samples were then submitted to the sonication times of 1, 5, 10, 20 and 30 s, corresponding to the energy (Ea) levels of 0.13; 0.66; 1.32; 2.63 and 3.95 J mL-1, calculated according to equation 1 (SÁ et al., 1999, 2002).
(1)
In which Ea is the applied energy (J mL-1); P
c is equipment power (Watts); tsis the sonication time (s); V is the volume of water utilized (mL).
The sonications were carried out in a Misonix, model XL2020 equipment, operating at 20 kHz, in stage 9 of the display (Figure 1), with a potency of 78.91 Watts, calculated from the standard procedure, based on calorimetric techniques, described by Sá et al. (2000a, 2001).
The samples were put on a suspended aluminum base and immersed in an 800 mL beaker, containing 600 mL of water, this arrangement being inserted in a calorimeter, that consisted of a plastic pot with a cover internally lined with styrofoam and aluminum foil (Figure 1). The tip of the ultrasound probe, 17.5 cm in length and 1.9 cm in diameter, was inserted through an opening in the cover of the calorimeter, 2 cm being immersed in the water and 2 cm away from the sample surface.
In the disaggregation assays for the kinetic energy of simulated raindrops, the undisturbed samples were submitted to the impact of 2.45 mm diameter drops, falling from a height of 3.31 m in a minisimulator built under laboratory conditions. Rain of 150 mm h-1 intensity was applied, during 5, 8, 11, 16 and 21 minutes, corresponding to the return times of 5, 10, 20, 50 and 100 years, for the Lavras, MG region (MELLO et al., 2001). Based on the intensity and duration of the precipitation and on the characteristics of the simulated rain (drop size, fall height, fall time and drop terminal velocity), for each rain duration
V
t
P
E
c sFigure 1 – Ultrasound equipment. (A) Generator; (B) Acoustic insulation box; (C) Convertor and ultrasound probe; (D) Sample base; (E) Probe tip to sample distance detail; (F) Detail of the sample immersed in water; (G) Calorimeter used for sonication of samples; (H) Thermocouple for temperature monitoring.
time, the corresponding kinetic energy was calculated, resulting in the following values: 2.37; 3.79; 5.21; 7.58 and 9.95 MJ ha-1. The calculations of the rain kinetic energy can be found, in full detail, in Silva (1994), and the
construction and dimensions of the raindrop minisimulator, in Ribeiro (2006).
Relationship between raindrops and ultrasonic... 817
was dried in an oven for 48 hours at 105 ºC. The mass of disaggregated dry soil was related to the area of the sample and expressed as Mg ha-1. The data were submitted to variance analysis, tests of averages and linear regression adjustment (y = a + bx), relating the amount of disaggregated material and energy levels (ultrasonic or drop kinetic energy), using the Sisvar (FERREIRA, 2000) software.
The first step for the establishment of a relationship between the ultrasonic energy levels (J mL-1) and the kinetic energy levels of rain (MJ ha-1), was the establishment of linear regression curves (y = a + bx) relating those two forms of energy with the amount of disaggregated material, starting from undisturbed samples. Soon afterwards, the transformation of the data into the logarithmic form proceeded, obtaining logarithmized linear regression equations relating the amount of disaggregated material with the two forms of energy. Based on the best model (chosen in function of highest R2), values of ultrasonic energy or kinetic energy of rain were substituted, thus making a relationship between those two forms of energy possible. Starting from that relationship, kinetic energy values were attributed, that were substituted in the equations that relate the kinetic energy of rain and ultrasonic energy, for the estimate of the latter. A verification of the methodology was also carried out, estimating the amount of disaggregated material by the respective linear models, comparing the results through the error estimate. The stability analysis of the aggregates (4.76 to 7.96 mm diameter) with application of ultrasonic energy was carried out according to the methodology proposed by Sá et al. (2002), with modifications. 5 g samples of air dried aggregate, the mass of which was corrected for oven dried, in triplicate, were pre-moistened and transferred to a 250 mL beaker, completing the volume to 200 mL with distilled water (soil:water ratio 1:40). The samples were submitted to sonication times of 0, 15, 30, 60, 120, 180, 240 and 300 s, corresponding, respectively, to the specific energies of 0; 4.7; 9.4; 18.8; 37.6; 56.4; 75.2 and 94.0 J mL-1, in agreement with equation 1. After each sonication, the samples were sieved at a screen mesh of 0.053 mm. The soil material retained in the sieve was dried in an oven for 24 hours at 105 ºC and weighed. Zero time of sonication was made up of simply putting the aggregates in the beaker, completing the volume with distilled water and sieving, just representing the aggregate disruption caused by the handling of the sample.
For each level of specific energy applied, the disaggregation indices (DI) (equation 2) were calculated, which represents the effect of the aggregate stability plus the granulometry of the sample, and the normalized
disaggregation index (NDI) (equation 3), just representing the effect of the aggregate stability (SÁ et al., 1999).
silt clay DI
sample
(2)
In which DI is the disaggregation index (adimentional), related to the quantity of silt + clay dispersed in a given energy level (obtained by the difference between the mass of aggregates before the sonication and the soil material retained in the sieve), with the mass of aggregates before the sonication (g).
max
DI NDI
DI imum
(3)
In which NDI is the normalized disaggregation index; DI is the disaggregation index obtained by equation 2, for each ultrasonic energy level applied; DImaximum is the highest disaggregation index found.
The data were submitted to variance analysis and average test (Scott-Knott), the horizons being compared in each level of energy applied, at 5% of probability, using the Sisvar (FERREIRA, 2000) software, and the obtained normalized disaggregation curves, according to Sá et al. (1999), plotting the applied energy on the abscissa axis (X) and the disaggregation index on the ordinate axis (Y), adjusting the models of the type Y = X/(a + bX).
RESULTS AND DISCUSSION
The undisturbed samples originating from the A, Bi and C horizons presented the same behavior when submitted to the ultrasonic energy and kinetic energy of the rain, horizon C being more susceptible to aggregate disruption than the horizons A and Bi, which did not differ between themselves (Figure 2 A and B). Imeson & Vis (1984) found a consistent and reproducible relationship between the drop kinetic energy and ultrasonic energy in the aggregate disruption of soil samples, working however, with disturbed samples (aggregates).
RIBEIRO, B. T. et al. 818
Figure 2 – Effect of kinetic energy of rain (A) and ultrasonic energy (B) in the aggregate disruption of undisturbed samples coming from horizons A, Bi and C, where the letters compare horizons in each energy level (Scott-Knott; p < 0.05).
Table 1 – Granulometry and organic matter (OM) of typical Dystrophic Tb Haplic Cambisol (CXbd) from the Lavras,
MG region.
Granulometric analysis according to Embrapa (1997) criteria (fast dispersion in a cocktail shaker type agitator + NaOH 1 M).
When the aggregate stability analysis took place, with application of ultrasonic energy, it was observed that horizon Bi presented behavior similar to horizon C; reaching high disaggregation indices, normalized or not, soon in the first levels of ultrasonic energy, compared with horizon A (Table 2). The disaggregation index (DI) represents the effect of the aggregate stability plus the granulometry (SÁ et al., 1999), and it will have its maximum value limited by the amounts of silt + clay, present in the sample. As an example, maximum DI values of 0.51, 0.67 and 0.65 were obtained for the horizons A, Bi and C, respectively. Those values are equal to the contents of 510, 670 and 650 g kg-1 of silt + clay dispersed with application of ultrasonic energy, while the silt + clay content (Table 1) obtained by the traditional granulometric analysis (EMBRAPA, 1997) were of 519, 654 and 551 g kg-1 for the horizons A, Bi and C. With exception of horizon A, the application of ultrasonic energy was shown to be more efficient in the dispersion of the soil materials.
The normalized disaggregation indices (NDI) presented in Table 2 just represent the effect of the stability
of aggregates (SÁ et al., 1999), in other words, NDI values close to zero indicate minimum dispersion and values close to one, indicate the total dispersion of the aggregates into primary particles (sand, silt and clay). It is observed that, in merely handling the sample (zero energy level), the horizon C presented NDI value equal to 0.32, in other words, 32% of its total dispersion. The horizon A presented lower NDI values in all of the energy levels applied, compared with horizons Bi and C, which did not differ among themselves. Except in the highest energy level (94 J mL-1) in which there is already total aggregate dispersion (NDI values close to one) differences were not observed among the soil materials studied. For the horizon Bi and C samples, NDI values of 0.96 and 0.94, were found respectively, starting at 9.4 J mL-1, and reaching a plateau (total dispersion), as can be observed by Figure 3, characterized by small variations in the disaggregation indices. Ultrasonic energy levels inferior to 9.4 J mL-1 would be necessary to point out differences as to the aggregation energy among those materials (horizons Bi and C). Vieira
Horizon Clay Silt Clay + Silt Sand OM
---g kg-1
---A 405 114 519 481 33
Bi 457 197 654 346 9
C 195 356 551 449 2
Kinetic energy of rain (MJ ha-1)
2.37 3.79 5.21 7.58 9.95
D
is
ag
gr
eg
at
ed
m
at
er
ia
l (
M
g
ha
-1 ) 0 10 20 30 40 50 60
B
B B B BB BB
B B
A A
A
A A
(A)
Ultrasonic energy (J mL-1)
0.13 0.66 2.32 2.63 3.95 0
20 40 60 80 100 120
B
B BB BB BB BB
A
A A
A A (B)
Relationship between raindrops and ultrasonic... 819
Table 2 – Disaggregation index obtained for each level of specific energy applied on the disturbed samples (aggregates) coming from horizons A, Bi and C of a typical Dystrophic Tb Haplic Cambisol (CXbd) from the Lavras, MG region.
Values of the disaggregation index (DI) or of normalized disaggregation index (NDI) followed by the same letter, in the same column, do not differ statistically among themselves by the Scott-Knott (5%) test.
(2005) considered values near to 8 J mL-1 as being the most appropriate to point out differences as to the stability of aggregates for the deeper layers, soils with lower organic matter levels and material from incipient B horizon. For the aggregates of horizon A, the behavior was linear up to 94 J mL-1, reaching the NDI value of 0.98. In samples of aggregates of the superficial layer of a Latosol under different uses, the curves tended to plateau starting from 90 J mL-1, the interval from 30 to 90 J mL-1 being considered the most sensitive and associated to lower coefficient variations to point out differences in the aggregate stability (SÁ et al., 2002). The level of ultrasonic energy necessary for total dispersion of the soil into primary particles showed to be appropriate for the study of the stability of aggregates of Brazilian tropical and subtropical soils, having wide amplitude in the appraised samples mainly in function of the organic carbon content and the mineralogy of the clay fraction (INDA JÚNIOR et al., 2007).
Based on the results of the aggregate stability analysis with application of ultrasonic energy it is observed that the aggregates of the horizons Bi and C presented low aggregation energy (Figure 3 and Table 2), a reflection of their lower organic matter levels, compared with horizon A. The organic matter of the soil has been considered the attribute better related to stability of aggregates submitted to ultrasonic energy (INDA JÚNIOR et al., 2007; SÁ et al., 2000b), besides the mineralogy of the clay fraction, mainly, the low crystalline iron oxides and gibbsite (INDA JÚNIOR et al., 2007; VITORINO et al., 2003).
When the undisturbed samples were submitted to the impact of raindrops, the Bi horizon presented resistance similar to horizon A (Figure 2A), giving evidence for the importance of the natural structure of the soil in the prediction of its susceptibility to erosion. At the same time, the application of ultrasonic energy on the surface of undisturbed samples was capable of reproducing the same results (Figure 2B).
In Figure 4, linear regression curves are presented relating the amount of disaggregated material produced by the kinetic energy of the simulated rain and by the ultrasonic energy, for the undisturbed samples coming from horizons A, Bi and C. Adjustments were obtained with R2 above 0.90, except for the horizons A and Bi, where the application of ultrasonic energy provided adjustments with R2 of 0.82 and 0.83, respectively.
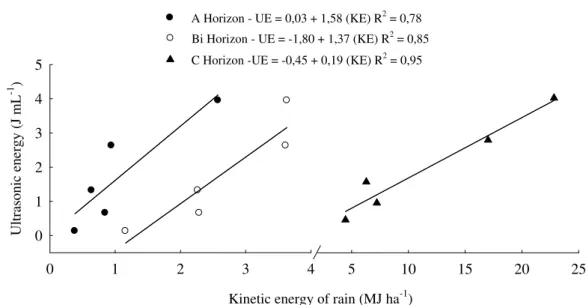
In Figure 5, the linear regression curves are presented relating the kinetic energy of rain and ultrasonic energy, representing equivalent levels of these two forms of energy that provided the same amount of disaggregated material starting from undisturbed samples. Based on the equations, a simulation was carried out, attributing kinetic energy values of the rain and finding the corresponding ultrasonic energy (Table 3). It is observed that the estimated values of disaggregated material for the ultrasound were close to those obtained by the kinetic energy of rain, presenting an error of estimate inferior to 10% for the horizons A and Bi and inferior to 24% for horizon C. It Level of specific energy applied
0.0 4.7 9.4 18.8 37.6 56.4 75.2 94.0
---(J mL-1)---
Horizon
DI
A 0.00 b 0.02 b 0.06 b 0.13 c 0.18 c 0.35 c 0.47 b 0.51 b
Bi 0.03 b 0.59 a 0.62 a 0.66 a 0.67 a 0.67 a 0.66 a 0.64 a
C 0.21 a 0.59 a 0.65 a 0.63 b 0.61 b 0.64 b 0.65 a 0.65 a
NDI
A 0.00 b 0.04 b 0.10 b 0.25 b 0.35 b 0.68 b 0.91 b 0.98 a
Bi 0.05 b 0.85 a 0.96 a 0.97 a 0.98 a 0.99 a 0.97 a 0.94 a
RIBEIRO, B. T. et al. 820
Figure 3 –Disaggregation curves of disturbed samples (aggregates) coming from horizons A, Bi and C of a typical Dystrophic Tb Haplic Cambisol (CXbd) from the Lavras, MG region, submitted to increasing levels of ultrasonic energy (UE). Error bars indicate the standard deviation of the average (n = 3).
Figure 4 – Linear regression curves (y = a + bx) between the quantity of disaggregated material (DM) and kinetic energy
(KE) of rain (A) and ultrasonic energy (UE) (B)in the undisturbed samples coming from horizons A, Bi and C of a typical Dystrophic Tb Haplic Cambisol (CXbd) from the Lavras, MG region.
stands out, however, that that estimate is based on the soil sample attributes and on the methodology used, but that it gives evidence for the potential use of ultrasound to simulate the phenomenon of aggregate disruption and soil loss caused by simulated rain. It is an initial study that should be repeated in other soil classes, but with a possibility to simulate the effects of different kinetic energy
values of rain in the aggregate disruption of the soil with the use of ultrasound, in a fast and low cost way, when compared to field assays. As an example, the effect of the kinetic energy of sprinkler drops and rain simulators on soil disaggregation can be verified, by exposing undisturbed samples to the ultrasonic energy corresponding to the energy of the rain.
Ultrasonic energy (J mL-1)
0 20 40 60 80 100
N
or
m
al
iz
ed
di
sa
gg
re
ga
tio
n
in
de
x
(N
D
I)
0.0 0.2 0.4 0.6 0.8 1.0
Bi Horizon
NDI = UE/(0.606 + 1.014UE) R2 = 0.99
A Horizon
NDI = 0,004 + 0,011UE R2 = 0,97
C Horizon
NDI = UE/(0.417 + 1.029UE) R2 = 0.69
Adjusted models:
Kinetic energy of rain (MJ ha-1)
2 4 6 8 10
D
is
ag
gr
eg
at
ed
m
at
er
ia
l (
M
g
ha
-1 )
0 10 20 30 40 50 60
A Horizon - DM = 3,14 + 0,74 (KE) R2 = 0,96
Bi Horizon - DM = 0,95 + 1,13 (KE) R2 = 0,96
C Horizon - DM = 6,46 + 4,47 (KE) R2 = 0,96
(A)
Ultrasonic energy (J mL-1)
0 1 2 3 4
0 1 2 3 4 5 6 20 40 60 80 100
A Horizon - DM = 1,55 + 0,70 (UE) R2 = 0,82 Bi Horizon - DM = 2,78 + 0,76 (UE) R2 = 0,83
C Horizon - DM = 23,28 + 19,20 (UE) R2 = 0,95
Relationship between raindrops and ultrasonic... 821
Figure 5 – Linear regression curves (y = a + bx) relating the kinetic energy of rain (KE) and ultrasonic energy (UE) that
provided the same amount of disaggregated material starting from undisturbed samples.
Table 3 – Simulation of kinetic energy values of the rain, estimated ultrasonic energy and quantity of disaggregated material produced by the kinetic energy of simulated rain and ultrasonic energy on the undisturbed samples coming from horizons A, Bi and C of a typical Dystrophic Tb Haplic Cambisol (CXbd) from the Lavras, MG region.
Predicted values Kinetic energy of
rain Estimated ultrasonic
energy Disaggregated material - rain Disaggregated material ultrasound - estimated
Error of the estimate ---(MJ ha-1)--- ---(J mL-1)--- ---(Mg ha-1)--- ---(%)---
Horizon A
3 4.77 5.36 4.89 8.77
4 6.35 6.10 6.00 1.64
5 7.93 6.84 7.10 3.80
6 9.51 7.58 8.21 8.31
Horizon Bi
3 2.31 4.34 4.53 4.38
4 3.68 5.47 5.58 2.01
5 5.05 6.60 6.62 0.30
6 6.42 7.73 7.66 0.91
Horizon C
3 0.12 20.68 25.58 23.69
4 0.31 25.42 29.23 14.99
5 0.50 30.16 32.88 9.02
6 0.69 34.90 36.53 4.67
CONCLUSIONS
The action of the ultrasonic energy in undisturbed samples of a Haplic Cambisol appropriately described the
phenomenon of the aggregate disruption of soil caused by the simulated rain drops.
The relationship between ultrasonic energy and kinetic energy of simulated rain drops allows to simulate
Kinetic energy of rain (MJ ha-1)
0 1 2 3 4
U
ltr
as
on
ic
en
er
gy
(J
m
L
-1 )
0 1 2 3 4 5
5 10 15 20 25
A Horizon - UE = 0,03 + 1,58 (KE) R2 = 0,78 Bi Horizon - UE = -1,80 + 1,37 (KE) R2 = 0,85
different kinetic energy values of rain with the use of the ultrasound.
Disaggregation curves of disturbed (aggregates) samples of this soil cannot be used to estimate the effect of raindrops on their undisturbed samples.
REFERENCES
CARVALHO, R.; SILVA, M.L.N.; AVANZI, J.C.; CURI, N.; SOUZA, F.S. Erosão hídrica em Latossolo Vermelho sob diversos sistemas de manejo do cafeeiro no sul de Minas Gerais. Ciência e Agrotecnologia, Lavras, v.31, n.6, p.1679-1687, nov./dez. 2007.
COSTA, A.M.; RIBEIRO, B.T.; SILVA, A.A.; BORGES, E.N. Estabilidade de agregados de um Latossolo Vermelho tratado com cama de peru. Ciência e Agrotecnologia, Lavras, v.32, n.1, p.73-79, jan./fev. 2008.
EMPRESA BRASILEIRA DE PESQUISA
AGROPECUÁRIA. Manual de métodos de análise de solo. 2. ed. Rio de Janeiro: CNPS, 1997. 212 p.
FERREIRA, D. F. Análises estatísticas por meio do Sisvar para Windows versão 4.0. In: REUNIÃO ANUAL DA REGIÃO BRASILEIRA DA SOCIEDADE
INTERNACIONAL DE BIOMETRIA, 45., 2000, São Carlos. Anais... São Carlos: UFSCar, 2000. p. 255-258. FERREIRA, M. M.; FERNANDES, B.; CURI, N. Mineralogia da fração argila e estrutura de latossolos da região sudeste do Brasil. Revista Brasileira de Ciência do Solo, Viçosa, v. 23, n. 3, p. 507-514, jul./set. 1999.
FRISTENSKY, A.; GRISMER, M.E. A simultaneous model for ultrasonic aggregate stability assessment. Catena, v.74, p.153-164, 2008.
IMESON, A. C.; VIS, M. Assessing soil aggregate stability by water-drop impact and ultrasonic dispersion.
Geoderma, Amsterdam, v. 34, p. 185-200, 1984. INDA JÚNIOR, A. V.; BAYER, C.; CONCEIÇÃO, P. C.; BOENI, M.; SALTON, J. C.; TONIN, A. T. Variáveis relacionadas à estabilidade de complexos organo-minerais em solos tropicais e subtropicais brasileiros.
Ciência Rural, Santa Maria, v. 37, n. 5, p. 1301-1307, set./
out. 2007.
LEIGHTON, T. G. Bubble population phenomena in acoustic cavitation. Ultrasonic Sonochemistry, v. 2, n. 2, p. 123-136, 1995.
MELLO, C. R.; FERREIRA, D. F.; SILVA, A. M.; LIMA, J. M. Análise de modelos matemáticos aplicados ao estudo de chuvas intensas. Revista Brasileira de Ciência do Solo, Viçosa, v. 25, n. 3, p. 693-698, jul./set. 2001. MORAIS, F.; BACELLAR, L. A. P.; SOBREIRA, F. G. Análise da erodibilidade de saprólitos de gnaisse.
Revista Brasileira de Ciência do Solo, Viçosa, v. 28, n. 6, p. 1055-1062, nov./dez. 2004.
RAINE, S. R.; SO, B. An energy based parameter for the assessment of aggregate bond energy. Journal of Soil Science, Oxford, v. 44, n. 2, p. 249-259, Jun. 1993.
RESENDE, M.; CURI, N.; SANTANA, P. D. Pedologia e fertilidade do solo: interações e aplicações.Brasília, DF:
MEC; ESAL; Potafos, 1988. 83 p.
RIBEIRO, B. T. Energia cinética de gotas de chuva simulada e energia ultra-sônica na desagregação de um Cambissolo. 2006. 65 p. Dissertação (Mestrado em Solos
e Nutrição de Plantas) - Universidade Federal de Lavras, Lavras, 2006.
SÁ, M. A. C.; LAGE, G.; LIMA, J. M. Calibração da potência emitida pelo sonificador para uso em análises de solo. Lavras: UFLA, 2001. 17 p. (Boletim
agropecuário, 41).
SÁ, M. A. C.; LIMA, J. M.; CURI, N.; MASSAROTO, J. A.; MARQUES, J. J. G. S. M. Estimativa da
erodibilidade pela desagregação por ultra-som e atributos de solos com horizonte B textural. Pesquisa Agropecuária Brasileira, Brasília, v. 39, n. 7, p. 691-699, jul. 2004.
SÁ, M. A. C.; LIMA, J. M.; LAGE, G. Procedimento-padrão para medida da potência liberada pelo aparelho de ultra-som. Ciência e Agrotecnologia, Lavras, v. 24, n. 1, p. 300-306, jan./mar. 2000a.
SÁ, M. A. C.; LIMA, J. M.; MELLO, C. R. Níveis de energia ultra-sônica para estudo da estabilidade de agregados de um Latossolo sob diferentes usos.
Pesquisa Agropecuária Brasileira, Brasília, v. 37, n. 11,
Relationship between raindrops and ultrasonic... 823
SÁ, M. A. C.; LIMA, J. M.; SILVA, M. L. N.; DIAS JUNIOR, M. S. Índices de desagregação do solo baseado em energia ultra-sônica. Revista Brasileira de Ciência do Solo, Viçosa, v. 23, n. 3, p. 525-531, jul./set. 1999.
SÁ, M. A. C.; LIMA, J. M.; SILVA, M. L. N.; DIAS JÚNIOR, M. S. Comparação entre métodos para o estudo da estabilidade de agregados em solos. Pesquisa Agropecuária Brasileira, Brasília, v. 35, n. 9, p. 1825-1834, set. 2000b.
SILVA, M. L. N. Erodibilidade e impacto das gotas de chuva simulada sobre a superfície de Latossolos sob cerrado. 1994. 98 f. Dissertação (Mestrado em Solos e Nutrição de Plantas) – Universidade Federal de Lavras, Lavras, 1994.
SILVA, M. L. N.; CURI, N.; MARQUES, J. J. G. S. M.; LIMA, L. A.; FERREIRA, M. M.; LIMA, J. M.
Resistência ao salpico provocado por impacto de gotas
de chuva simulada em Latossolos e sua relação com características químicas e mineralógicas. Ciência e Prática, Lavras, v. 19, n. 2, p. 176-182, abr./jun. 1995. STEPHANIS, C. G.; HATIRIS, J. G.; MOURMOURAS, D. E. The process (mechanism) of erosion of soluble brittle materials caused by cavitation. Ultrasonic
Sonochemistry, v. 4, p. 269-271, 1997.
VIEIRA, V. A. S. Variabilidade espacial da estabilidade de agregados do solo em uma microbacia hidrográfica. 2005. 100 p. Dissertação (Mestrado em Solos e Nutrição de Plantas) – Universidade Federal de Lavras, Lavras, 2005.
VITORINO, A. C. T.; FERREIRA, M. M.; CURI, N.; LIMA, J. M.; SILVA, M. L. N.; MOTTA, P. E. F. Mineralogia, química e estabilidade de agregados do tamanho silte de solos da Região Sudeste do Brasil.
Pesquisa Agropecuária Brasileira, Brasília, v. 38, n. 1, p.