Printed version ISSN 0001-3765 / Online version ISSN 1678-2690 http://dx.doi.org/10.1590/0001-3765201620150004
www.scielo.br/aabc
Objective measurement of
Akodon budini
dorsal coloration: methodological concerns
MARÍA L. SANDOVAL SALINAS1,2
, JOSÉ D. SANDOVAL1,3
and ELISA M. COLOMBO1,3
1
Instituto de Investigación en Luz, Ambiente y Visión/ILAV, Universidad Nacional de Tucumán/UNT-Consejo Nacional de Investigaciones Científi cas y Técnicas/CONICET, Av. Independencia, 1800, PC4000, Tucumán, Argentina
2
Programa de Investigaciones de Biodiversidad Argentina/PIDBA, Facultad de Ciencias Naturales e Instituto Miguel Lillo, UNT, Miguel Lillo 205, PC4000, Tucumán, Argentina
3
Departamento de Luminotecnia, Luz y Visión/DLLyV, Facultad de Ciencias Exactas y Tecnología, UNT, Av. Independencia, 1800, PC4000, Tucumán, Argentina
Manuscript received on January 8, 2015; accepted for publication on March 13, 2015
ABSTRACT
The role of color in taxonomic and systematic studies of several taxa is central. Color data are more valuable if they permit comparisons. We aimed to provide pelage objective color measurements of a series of Akodon budini and to use those color data to test and to quantitatively analyze the infl uence of both the lighting source and the measuring point, in the determination of pelage color of museum skins. We used a spectroradiometer to measure the pelage color at fi ve points over the dorsal midline of 54 Akodon budini museum skins. PCAs and ANOVAs were conducted over the color data. The characteristics of the studied series also allowed us to include and assess the potential effects of some main sources of intra-specifi c variation. Determinations of fur color strongly depend on the lighting source, and therefore it is essential that lighting conditions are controlled during color measurements and then made explicit when communicating the color characterization of particular taxonomic units. Furthermore, color determinations strongly depend on the measuring point, even on the same body area, and therefore it is critical that the color characterization of a taxon includes the variation between different points of the different body parts of the studied specimens.
Key words: chromatic coordinates, CIELab color space, lighting source, measuring points, spectroradiometer.
Correspondence to: María Leonor Sandoval Salinas E-mail: [email protected]
INTRODUCTION
Evaluating the variation in the color of mammal
pelage forms the basis for a broad range of
research questions. Accordingly, color itself is
often the primary target of museum-based studies.
Pelage color usually varies to some degree across
individuals in many species (Davis and Castleberry
2010) and can vary subtly or dramatically between individuals of different species. Description of color
is one of the most crucial tasks in taxa descriptions. The role of color in taxonomic and systematic
studies of several taxa is central, as it constitutes a major tangible feature. Therefore, pelage color can be studied for documenting coloration patterns
of a particular species or group of species and for relating this information to several biological,
to assess the degree of intra- and/or inter-specifi c color variation of the studied taxonomic units. Small mammal intra-specifi c color variation has been related to sex (e.g., Davis and Castleberry 2010, Rios and Álvarez-Castañeda 2012), age (e.g., Rios and Álvarez-Castañeda 2012), habitat (e.g., Heth et al. 1988, Carraway and Verts 2002, Lai et al. 2008, Rios and Álvarez-Castañeda 2012), and season (e.g., Camargo et al. 2006), among others factors. Regarding inter-specific color variation, pelage color is considered a valuable taxonomic feature in several cases, in which the color variation range related to specifi c identity is a diagnostic marker of the mammal species (or subspecies). On taxonomic and systematic studies, coat color is considered a diagnostic feature to identify several species of mammals (Caro 2005). Many descriptions of original species and subspecies relied heavily on coloration to separate groups, and some very recent works deal with color variation associated with different taxonomic units (e.g., Kamilar and Bradley 2011, Singaravelan et al. 2013). Consequently, pelage coloration has received a lot of scientifi c attention for the purpose of grouping taxa.
Therefore, considering the variety of questions that can be answered by studying pelage color, it is important to consider some methodological issues related to the collection and subsequent interpretation of the color data. This means that only a correct description of color could provide useful information. For example, Davis and Castleberry (2010) and Davis et al. (2013) have stated that storage time needs to be considered in studies of pelage color. Regarding color data collection, data are more valuable if they permit comparisons between those obtained by different researchers, or by the same researcher but in different temporal (e.g., different days, months or even years) or spatial (e.g., different museums or even different rooms in a museum) conditions, but this issue has not been suffi ciently studied. The studies that
address methodological issues concerning the measurement of coat color are very few (but see, for example, the notable study of Sumner and Mollon 2003). Particularly, the lighting source (i.e., the light under which pelage is observed) and the measuring point (at which specifi c location color is measured) may have a great infl uence in color data but this has not been empirically assessed. These issues, even in very recent, inclusive, and rigorous studies of pelage color (such as the study of Linnen et al. 2013), are almost never adequately assessed. In contrast, in other fi elds of Biological Sciences, the importance of these issues has already been acknowledged (e.g., Ruiz and Pereira 2014).
In recent years, the development of improved devices that measure specifi c properties of refl ected light (such as colorimeters, imagers devices, and spectroradiometers) (Lozano 1978, Schanda 1997, Capilla et al. 2002) allows recording the specifi c characteristics of the light directly from the object under study (Grill and Rush 2000). These devices have increasingly been used to quantify tiny variation in integument color across many animal species (Kilner 1997, Goda and Fujii 1998, Villafuerte and Negro 1998, Gerald et al. 2001, Losey 2003, Davis et al. 2007, Davis and Grayson 2007, Stevens et al. 2007, Kause et al. 2008, Sezer and Tekelioglu 2009) largely because quantitative output values enable the realization of detailed statistical analyses (Patten and Unitt 2002).
The main goal of this study was to improve the currently used methodologies for the collection of color data from small mammal museum skins. Specifi cally, we intend:
1. To provide pelage objective color measure-ments of a series of Akodon budini.
2. To use those color data to test and to quantita-tively analyze the infl uence of:
a- The use of different lighting sources.
Since spectroradiometry is considered a very objective and reliable method for measuring color (Zuk and Decruyenaere 1994), we used a spectroradiometer to measure the pelage color of
Akodon budini museum skins. The features of the
studied series allowed us to include and assess the potential effects of the main sources of intra-specifi c variation (i.e., geographical origin, sex, season, sample antiquity, etc.). Because this is the first attempt at using these techniques on this species, a secondary goal of this study was to evaluate the adequacy of this methodology for future research.
MATERIALS AND METHODS
HYPOTHESES
Basically, this study includes two questions: 1. How do obtained results vary when measuring
with different lighting sources the pelage color in specimens of one species of small mammal,
Akodon budini?
2. How do obtained results vary when measuring at different points the pelage color in specimens
of Akodon budini, even within the same body
area of a specimen?
The general hypotheses guiding the study are as follows:
1. Results of measuring coat color in specimens of small mammals heavily rely on the illuminant. 2. Results of measuring coat color in specimens
of small mammals strongly depend on the measuring point, even within the same body area of a specimen.
MATERIALS
We selected the species to be studied based on the following criteria: It had to be represented by males and females specimens (to allow the incorporation of one of the major known sources of intra-specifi c variation of coloration, i.e., sex, as a variable under study); it should be a widely distributed species and it had to be represented by a quantity of
specimens from a small geographic area (to allow the incorporation of another of the major known sources of intra-specifi c variation of coloration, i.e., habitat or geographical origin); and, it had to be represented by specimens collected on different seasons (to allow the incorporation of yet another of the major known sources of intra-specific variation of coloration; i.e., collection season, as a variable under study). Furthermore, the species had to be represented by specimens that had all been prepared and stored in generally the same fashion and it had to be represented by series of specimens that have been collected more or less regularly for at least the last 25 years (to allow the incorporation of sample antiquity as a variable under study).
The species that met all the detailed criteria in the Colección Mamíferos Lillo (CML, Facultad de Ciencias Naturales e Instituto Miguel Lillo, Universidad Nacional de Tucumán, Argentina)
was Akodon budini (Cricetidae: Sigmodontinae),
a rodent species that inhabits the Yungas forests of North-western Argentina and South-central Bolivia.
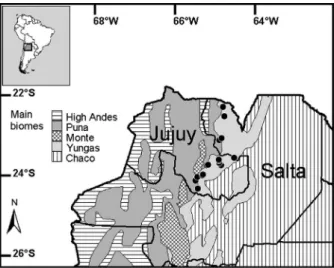
For analyses we used 54 complete (skin and skull) museum specimens collected between November and February (~summer), between May and August (~winter), and in March-April or September-October (~midseason) (Appendix). This series includes specimens from all the known distributional range of the species in Argentina, which is a latitudinal, longitudinal, and altitudinal restricted distributional range (Fig. 1). All specimens were adults that were identifi ed by molars being fully erupted and exhibiting wear, and all skull sutures being completely fused. We measured all available dry adult specimens because none of them were visibly molting nor were worn, dirty or grossly damaged. We did not avoid specimens that appeared to be faded.
collection localities and dates (month and year) of the specimens, indicated on specimen tags. Collection year ranged from 1970 to 2008. All this information were later matched to specimen color data.
METHODS
We measured the color data of the studied skins using a Photo Research PR715 spectroradiometer (measuring the spectral power distribution between 380 nm and 1068 nm) calibrated against a white diffuse standard (Ocean Optics Refl ectance Standard WS-1, a pressed PTFE housed in aluminum, with refl ectivity > 98% in the range of 250-1500 nm) and a diffuse illumination cabin constructed at DLLyV-ILAV (rectangular diffusing white box 60x60x90 cm, illuminated by four halogen lamps 12 V DC 50 WW), using SpectraWin 2 software. The spectroradiometer was mounted on a tripod, which maintained the instrument at a fi xed distance (~1.5 m) from, and perpendicular to, the specimen dorsal midline. This instrument measures the spectral refl ectance (the amount of incident light refl ected or transmitted by an object in the different wave-bands of a specifi c region of the spectrum; Ruiz and
Pereira 2014) and yields a curve, i.e., refl ectance values for every spectral band. These refl ectance values can be used in the form of tri-stimulus values (Schanda 2007), which may be defined according to different systems (e.g. Munsell, CIE Yxy, CIE Lab, CIE LCH; Schanda 1997). Calculation of these values implies and imposes the use of standard conditions for observation, e.g., different illuminants. An illuminant is a light that has been defi ned by its spectral power distribution, and its curve can be used to numerically test how a certain colored object would be seen when viewed under it. A standard illuminant is a theoretical source of visible light with a known curve. Using standard illuminants allows for comparing object colors. The CIE (Commission Internationale de L’Eclairages, or International Commission on Illumination) has defi ned several types of standard illuminants. Two of them are particularly useful for this article purposes: the CIE standard illuminant A (which is intended to represent typical, domestic, tungsten-fi lament lighting), and the CIE standard illuminant D65 (which is intended to represent average daylight).
Finally, the instrument provides the color data in the CIE Lab color system. In the CIE Lab color space, “L*” denotes how light or dark the color is (level of lightness), while “a*” and “b*” together, indicate chromaticity. An increase in a* indicates more red, while a decrease indicates a movement to green; meanwhile, an increase in b* indicates more yellow, while a decrease indicates a movement to blue. CIE Lab color space (Schanda 2007) is the main reference color space because it is based on the human visual model and therefore includes all of the colors perceived by humans (Ruiz and Pereira 2014). In addition, this color space was selected because it is more appropriate for the biological aims of this study (Singaravelan et al. 2013).
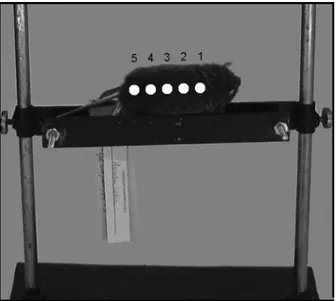
We measured the color data of fi ve points over the dorsal body region, namely the neck, upper back, middle back, lower back, and rump of each Figure 1 - Map of Northwestern Argentina showing the
specimen (Fig. 2). Pelage color was repeatedly measured at these five different points of the dorsal pelage for each individual specimen under simulation of the two lighting conditions. Therefore, we recorded 10 measurements per every individual specimen (fi ve dorsal midline points x two lighting sources, IA and ID65), which represents 30 color values (fi ve dorsal midline points x two lighting sources x three color variables, L*, a*, and b*)
these dependent variables (the color variables, L*, a*, and b*), the independent variables (lighting sources and measuring points, and secondarily, sex, geographical origin, collection season, and sample antiquity), and each of the observations. Since we have only three dependent variables, PCA was not conducted in order to reduce the number of color variables (Montgomerie 2006). As a result of PCA, the variation in color data will be described by three principal components (PC) that are by defi nition independent (orthogonal) (Cuthill et al. 1999). In PCA, the first PC is the linear combination of the original variables that show the highest variance. PC2 is defi ned as the axis with the next highest variance, subject to the constraint that it is orthogonal to PC1, PC3 is defi ned as the axis with the next highest variance, subject to the constraint that it is orthogonal to PC2, and so on (Sokal and Rohlf 1981, Otto 1999, Malinowski 2002). To describe the association between the color variables (L*, a*, and b*) and lighting sources, we used all the observations (n=1620), which are L*, a*, and b* values obtained from the 54 specimens for the fi ve measuring points for both lighting sources (IA and ID65). Then, to describe the association between the color variables (L*, a*, and b*) and measuring points, by eliminating the infl uence of the lighting source, we used only half of the observations (n=810), which are L*, a*, and b* values obtained from the 54 specimens for the fi ve measuring points for one of the lighting sources, IA.
We then used general linear models of Analysis of Variance (ANOVAs) to examine relationships between color data, illuminants, and measuring points, and to explore the relationships between color data and sex, geographical origin, collection season, and sample antiquity. L*, a*, or b* were included as the dependent variable in each analysis, and the illuminant, measuring point, sex, geographical origin, collection season, and sample antiquity were included as independent variables Figure 2 - Photograph of a specimen of Akodon budini placed
within the diffuse illumination cabin showing the fi ve points over the dorsal body region, namely the neck, upper back, middle back, lower back, and rump, where we measured the pelage color (see Materials and Methods).
-Statistical analyses- Color data were handled
and analyzed using two software packages: (1) The spreadsheet Microsoft Excel (version 2003) to enter and handle coordinates color data, and to make some graphs; and (2) the computer statistical package INFOSTAT (version 2013) to conduct all statistical analyses and to make other graphs for the display of results.
(all as categorical variables). Specimen identity was included as a random effect. All interaction terms were also included in this analysis. We then used model simplifi cation procedures by removing each non-signifi cant (p>0.05) interaction term. We used as post hoc test the Fisher’ LSD statistic with Bonferroni correction. Signifi cance was accepted when p<0.05. We report results from a final analysis that include those parameters that explain substantial variation in each response variable as determined by model fi tting.
RESULTS
PCAS
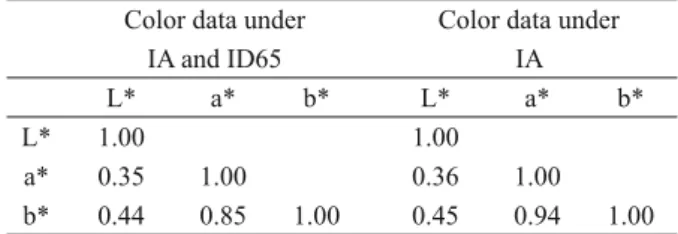
We found that only the color variables a* and b* show a high correlation between them (Table I).
-Lighting sources- The first PCA included
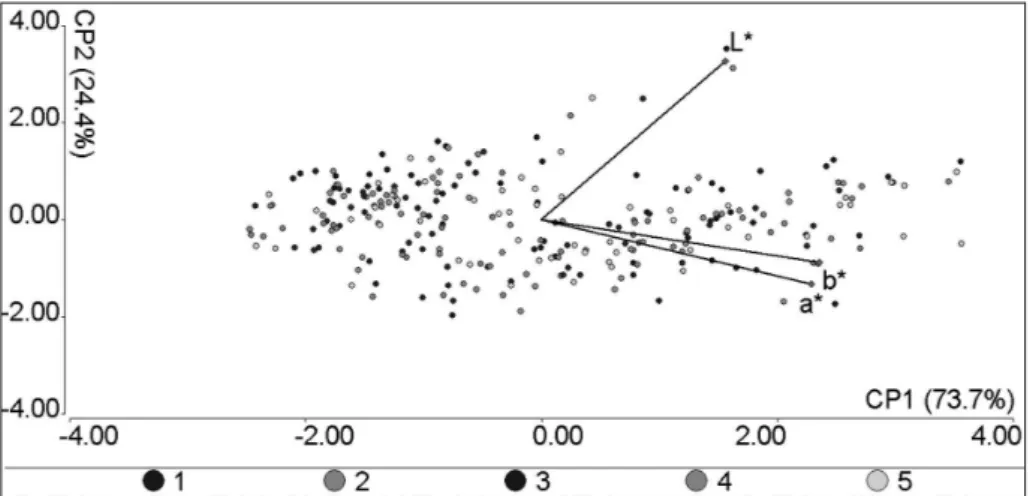
1620 L*, a*, and b* values (obtained from 54 specimens for the fi ve measuring points for both lighting sources). In studying the relationship of point clouds corresponding to each of the lighting sources (IA and ID65) in the graph (Fig. 3), we observed that both clouds have almost the same arrangement of points, i.e., the distances and the relative positions of points to each other, are almost the same when the color data were obtained with
respect to different lighting sources. However, with respect to axis 1, it is clear that the point cloud corresponding to IA is shifted toward the right, i.e., in the direction of increasing values of a* and b*, and to a lesser extent of L*. Whereas, with respect to axis 2, the displacement of the point cloud corresponding to IA is negligible; the points corresponding to this illuminant present slightly higher values of a* and b* and slightly lower values of L* than the equivalent points for the ID65.
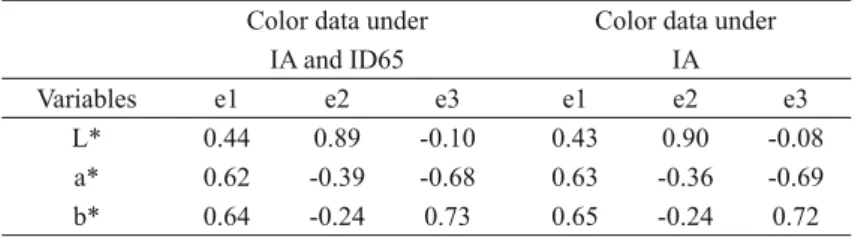
The first Principal Component (PC1) has higher positive loads for b* and a*, PC2 shows strong positive loads for L*, and PC3 has higher positive loads for b* and negative loads for a* (Table II). Hence, PC1 and PC3 are more related
Figure 3 - Results of the fi rst PCA, which included L*, a*, and b* values obtained for the fi ve measuring points from 54 specimens, for both illuminants as parameters (see Materials and Methods and Results).
TABLE I
Correlation matrix of L*, a*, and b* correlation coeffi cients based on the color data of 54 Akodon budini
specimens housed in the CML, obtained under two different lighting sources, IA and ID65, or under one
lighting source, IA (see Materials and Methods). Color data under
IA and ID65
Color data under IA
L* a* b* L* a* b*
L* 1.00 1.00
a* 0.35 1.00 0.36 1.00
to the chromaticity while PC2 is more related to lightness. The PC1 explained 71%, PC2 24%, and PC3 5% of the variance in fur coloration displayed on the Akodon budini specimens under study (Table III).
-Points- The second PCA included 810 L*, a*,
and b* values (obtained from 54 specimens for the
fi ve measuring points for one of the illuminants, IA). In studying the relationship of point clouds corresponding to each of the points in the graph (Fig. 4), it seems that there is no trend of measuring points with respect to color variables. However, when associating each individual with its points, a tendency for most individuals becomes evident (Fig. 5). In Fig. 5, we have highlighted the points belonging to male specimens collected in winter in the 70s. With respect to axis 1, the points belonging to most specimens show the same trend: the values of the variables a* and b* decrease in a neck-rump direction; for example, CML1776 points clearly show this trend, CML1789, CML1790,
and CML1793 show this trend in their neck to lower back points (with the exception of point 5), CML1794, CML1798, and CML1807 show this trend in their neck to middle back points (with the exception of points 4 and 5); while, CML1791 and CML1797 show the opposite trend, and CML1792 shows no evident trend.
The fi rst Principal Component (PC1) has higher positive loads for b* and a*, PC2 shows strong positive loads for L*, and PC3 has higher positive loads for b* and negative loads for a* (Table II). Hence, PC1 and PC3 are more related to the chro-maticity while PC2 is more related to lightness. The PC1 explained 74%, PC2 24%, and PC3 2% of the variance in fur coloration displayed on the Akodon
budini specimens under study (Table III).
ANOVAS
There is a signifi cant effect of the illuminant on the three color variables L*, a*, and b* and of the measuring point on L* and a*.
TABLE II
Principal Component Analysis (PCA) of color variables of the 54 Akodon budini specimens housed in the CML obtained under two different lighting sources, IA and ID65, or under one lighting source, IA (see
Materials and Methods): eigenvectors. Color data under
IA and ID65
Color data under IA
Variables e1 e2 e3 e1 e2 e3
L* 0.44 0.89 -0.10 0.43 0.90 -0.08
a* 0.62 -0.39 -0.68 0.63 -0.36 -0.69
b* 0.64 -0.24 0.73 0.65 -0.24 0.72
TABLE III
Principal Component Analysis (PCA) of color variables of the 54 Akodon budini specimens housed in the CML calculated under two different illuminants, IA and
ID65 (see Materials and Methods): eigenvalues. Color data under
IA and ID65
Color data under IA
Lambda Value Proportion Cum Prop Value Proportion Cum Prop
1 2.13 0.71 0.71 2.21 0.74 0.74
2 0.73 0.24 0.95 0.73 0.24 0.98
Color data calculated under both lighting sources, IA and ID65, are signifi cantly different (Table IV). This result was found for the three color variables, being the lighting source the main responsible for the observed variation (Table IV).
With regard to the infl uence of the measuring point on color data, measured color at different points even on the same body area can result in signifi cantly different colorimetric values (Table IV). The measuring point is the second main factor Figure 5 - Results of the second PCA, which included L*, a*, and b* values obtained for the fi ve measuring
points from 54 specimens, for the illuminant IA as parameter, showing some individual IDs with their points (see Results).
Figure 4 - Results of the second PCA, which included L*, a*, and b* values obtained for the
infl uencing color data for L* and the fourth for a*, being signifi cant in both cases.
We also found signifi cant interactions between lighting source and point (for the three color variables) and between point and geographical origin (for L* and b*), sex (for L* and b*), season (for the three color variables), and sample antiquity
(for the three color variables) (Table IV). All these interactions indicate that color value changes, regarding the lighting source, occurred at different rates in different measuring points. Furthermore, color value changes, regarding the measuring point, occurred at different rates in specimens from different geographical areas, in male or female TABLE IV
Results from three ANOVAs in which the variation in L*, a*, and b* of the dorsal fur color of Akodon budini specimens in relation to Illuminants (IA and ID65) and points (one to four) are analyzed (results related to season, sex, and sample antiquity are not showed or discussed in this paper). Separate analyses were performed with L*, a*, or b* as the dependent variable.
Specimen identity was included as random factor in each model.
num DF den DF F-value P-value
L* Illuminant 1 339 790.57 <0.0001
Point 3 339 25.14 <0.0001
Geographical origin 1 45 3.76 0.0589
Sex 1 45 0.06 0.8012
Season 2 45 13.31 <0.0001
Sample antiquity 2 45 0.60 0.5529
Illuminant x point 3 339 0.97 0.4067
Point x geographical origin 3 339 3.02 0.0300
Point x sex 3 339 0.51 0.6754
Point x season 6 339 2.59 0.0182
Point x sample antiquity 6 339 0.45 0.8473
a* Illuminant 1 345 1801.24 <0.0001
Point 3 345 9.53 <0.0001
Season 2 47 54.15 <0.0001
Sample antiquity 2 47 35.06 <0.0001
Illuminant x point 3 345 213.52 <0.0001
Point x season 6 345 10.30 <0.0001
Point x sample antiquity 6 345 6.65 <0.0001
b* Illuminant 1 339 2439.18 <0.0001
Geographical origin 1 45 0.66 0.4207
Sex 1 45 0.16 0.6885
Season 2 45 4.76 0.0133
Sample antiquity 2 45 43.83 <0.0001
Illuminant x point 6 339 12.03 <0.0001
Point x geographical origin 3 339 3.55 0.0147
Point x sex 3 339 3.09 0.0274
Point x season 6 339 2.97 0.0077
specimens, in specimens with winter or summer coat, and in specimens of different storage antiquity.
DISCUSSION
As expected, and in accordance to Schmitz-Ornés (2004), we found that the color variables a* and b* (the chromaticity variables) show a high positive correlation between them (Table I); on the other hand, the level of lightness is not highly correlated with chromaticity. This means that a* and b* values change in such a way that when the value of one variable increases or decreases so does the value of the other variable. Meanwhile, L* has a more independent behavior. On the other hand, in a PCA, del Val et al. (2009) found that each of the three axis obtained represented one of the color variables provided by the instrument they used: PC2 had higher loads for lightness; while, PC1 and PC3 had higher loads for the variables related to chromaticity, each component being related to one variable (del Val et al. 2009). Our results are different than those of del Val et al. (2009): in our two PCAs we found that PC1 and PC3 both had higher loads for a* and for b* and PC2 showed strong loads for lightness (Table II). According to our results, both chromaticity variables were invariably related, either directly or indirectly, whereas the brightness variable had a more independent behavior.
The importance of animal pelage colors in adap-tive functions has long been scientifi cally acknow-ledged, but there have been surprisingly few studies on this topic in the fi eld of Mammalogy. Moreover, many of the studies that have been conducted are not rigorous regarding the methodology for color determination. Clearly, fi nding the best technique to analyze hair color is still a challenge (Vaughn et al. 2008), specially, due to the fact that the object to be measured presents the chromatic complexity that characterize mammalian fur. In the measurement of the color of an animal there may be a number of diffi culties because the determination of color varies, for example, according to different lighting
conditions, to precise area or point that is being measured, to measuring angle, to measuring device sensitivity, and across time, among others (Endler 1990, Senar 2004, Bergman and Beehner 2008). Here, we demonstrate that lighting conditions and the precise measuring point are variables that must be controlled so as to not affect the results of color determinations.
The chosen lighting source is particularly important, since a common color phenomenon called metamerism may appear when objects are viewed under different light sources (Wyszecki and Stiles 1982, Rich and Jalijali 1995). Two objects may appear with the same color when they are viewed under the light emitted by a certain source but may appear with completely different colors under the light emitted by another source. So, in all papers dealing with the study of fur color of mammal specimens, whether the study of color is the main objective of the paper or just a tool to achieve other purposes, and whether the color determinations are made subjectively or objectively, authors should pay special attention to the lighting source used to make such color determinations, they should also standardize the use of the chosen illuminant, and be explicit about the choice that was made.
impact of other factors (habitat, age, sex, season, etc.) in the color of different species of animals, etc.
For different purposes, a color classifi cation based directly upon the chromatic coordinates (or the reflectance spectra) rather than human perception is a better starting point in studies of animal color patterns (Endler 1990). Particularly, in this study we used chromatic coordinates data (L* a* b* data) to test and to quantitatively analyze the infl uence of (a) the use of different lighting conditions and (b) the measurement at different measuring points, even on the same body area. We can conclude that:
1. Given that the determination of fur color strongly depends on the lighting sources, it is essential that the lighting is made explicit in communicating the color characterization of a particular taxonomic unit. Ideally, light conditions used for color determinations for taxonomic or other biological purposes should be standardized. But for now, it would be enough that in the papers in which fur color is a feature of interest under study, the type of lighting source is made explicit, so the reported color determinations are repeatable by other researchers in the same (lighting) conditions. 2. Given that the determination of fur color
strongly depends on the measuring point, even on the same body area, it is critical that the color characterization of a particular taxon includes the variation between different points of the different parts of the fur of the studied specimens.
TAXONOMIC IMPLICATIONS
As Paxton (2009) highlighted, with the advent of molecular genetic techniques, the use of skin coloration and other morphological traits for taxonomy has diminished (Avise 1994), and this trend may be accentuated if phenotypic characteristics are not studied with the rigor and
the accuracy required in taxonomic and systematic studies, and in sciences in general. Often confl icting taxonomic groupings derived from morphology-based versus molecular-morphology-based approaches are obtained, and those derived from morphological bases are criticized mainly for their qualitative nature and their diffi culty in replication.
We are developing several studies on pelage color in specimens of small mammals by objective methods and we are convinced that morphological traits are not only very useful but also fundamental evidence in taxonomic designations. However, such traits in general, and pelage color in particular, should be studied considering the recent advent of sophisticated electronic tools, as for instance, to quantify color, making it possible to more rigorously and reliably define skin coloration differences. This has already become a common practice in the fi eld of ornithology (Paxton 2009, and references therein), but it is not common in studies of mammals.
Additionally, quantifying differences in pelage coloration among morphologically similar species and subspecies can be exploited to identify taxonomic groups rapidly in the fi eld, without the additional cost related to time and materials required by genetic testing (Paxton 2009). However, to fully evaluate the utility of fur coloration in taxonomic studies, an understanding of the sources of variation in coat coloration and the range of intra- and inter-specifi c color variation are required (M.L. Sandoval Salinas et al., unpublished data).
CONCLUSIONS
reproducible, objective and precise, but would also enable the color to be treated as a quantitative trait that could be used along with other biological characteristics of the studied specimens, as morphometric measurements, in an analysis that includes multiple sources of evidence.
ACKNOWLEDGMENTS
We appreciate the anonymous English reviewer of the Anais da Academia Brasileira de Ciências Journal. We thank Elena Bru (Centro de Referencia para Lactobacilos -CERELA-, CONICET, Argen-tina) for her help with statistical analyses. MLSS is grateful to the Consejo Nacional de Investigaciones Científicas y Técnicas (CONICET, Argentina) for providing her doctoral and postdoctoral fellowships. Finally, we want to emphasize the enormous value of the Biological Collections housed in the Natural History Museums. Although their use depends on many factors (preservation methods, preservation quality, etc.), their mere existence allows researchers to study, among other things, the variations among individuals, among age groups, between sexes, seasonal variation, geographical variation, etc. The present paper and other numerous studies would not had been possible if there were no public Biological Collections available for study.
RESUMO
O papel da cor em estudos taxonômicos e sistemáticos de vários táxons é central. Dados de cores são mais valiosos se permitirem comparações. Nosso objetivo foi proporcionar medições objetivas de cor de pelagem de um grupo de Akodon budini e usar esses dados de cor para testar e analisar quantitativamente a infl uência da fonte de iluminação e do ponto de medição na determinação da cor de pelagem de peles de museu. Nós utilizamos um espectroradiômetro para mensurar a cor da pelagem em cinco pontos sobre a linha média dorsal de 54 peles de museu de Akodon budini. PCAs e ANOVAs foram realizadas sobre os dados de cor. As características do grupo estudado também nos permitiu incluir e avaliar
os potenciais efeitos de algumas das principais fontes de variação intraespecífi ca. Determinações da cor de pele dependem fortemente da fonte de iluminação e, portanto, é essencial que as condições de iluminação sejam controladas durante as medições de cor e, em seguida, explicitadas ao descrever a caracterização de cores de determinadas unidades taxonômicas. Além disso, as determinações de cor dependem fortemente do ponto de medição, mesmo na mesma área corporal e, por conseguinte, é fundamental que a caracterização de cor de um táxon inclua a variação entre os diferentes pontos das diferentes partes do corpo das amostras estudadas.
Palavras-chave: coordenadas cromáticas, espaço de cor CIELab, fonte de iluminação, pontos de medição, espectroradiômetro.
REFERENCES
AVISE JC. 1994. Molecular markers, natural history and evolution. New York: Chapman and Hall, 511 p.
BERGMAN TJ AND BEEHNER JC. 2008. A simple method for measuring color in wild animals: validation and use on chest patch color in geladas (Theropithecus gelada). Biol J Linn Soc 94: 231-240.
CAMARGO CR, COLARES E AND CASTRUCCI AML. 2006. Seasonal pelage color change: news based on a South American Rodent. An Acad Bras Cienc 78: 77-86. CAPILLA P, ARTIGAS JM AND PUJOL J. 2002. Fundamentos
de Colorimetría. Valencia: Universidad de Valencia, 232 p. CARO T. 2005. The adaptive significance of coloration in
mammals. BioScience 55: 125-136.
CARRAWAY LN AND VERTS BJ. 2002. Geographic variation in pelage color of piñon mice Peromyscus truei in the northern great basin and environs. West N Am Naturalist 62: 458-465.
CUTHILL IC, BENNETT ATD, PARTRIDGE JC AND MAIER EJ. 1999. Plumage reflectance and the objective assessment of avian sexual dichromatism. Am Nat 160: 183-200. DAVIS AK AND CASTLEBERRY SB. 2010. Pelage color of red
bats Lasiurus borealis varies with body size: an image analysis of museum specimens. Curr Zoo 56: 401-405. DAVIS AK, COPE N, SMITH A AND SOLENSKY MJ. 2007.
Wing color predicts future mating success in male monarch butterflies. Ann Entomol Soc Am 100: 339-344.
DAVIS AK AND GRAYSON KL. 2007. Improving natural history research with image analysis: the relationship between skin color, sex, size and stage in adult red-spotted newts Notophthalmus viridescens viridescens. Herpetol Conserv Biol 2: 67-72.
museum specimens of mammals: reddish-brown species get redder with storage time. Int J Zool 2013: 6.
DEL VAL E, BORRÀS A, CABRERA J AND SENAR JC. 2009. Plumage color of male Common Crossbills Loxia curvirostra: visual assessment validated by colorimetry. Rev Catalana Ornitol 25: 19-25.
ENDLER JA. 1990. On the measurement and classification of color in studies of animal color patterns. Biol J Linn Soc 41: 315-352.
GERALD M, BERNSTEIN J, HINKSON R AND FOSBURY R. 2001. Formal method for objective assessment of primate color. Am J Primatol 53: 79-85.
GODA M AND FUJII R. 1998. The blue coloration of the common surgeonfish, Paracanthurus hepatus - II. Color revelation and color changes. Zool Sci 15: 323-333. GRILL CP AND RUSH VN. 2000. Analysing spectral data:
compa rison and application of two techniques. Biol J Linn Soc 69: 121-138.
HETH G, BEILES A AND NEVO E. 1988. Adaptive variation of pelage color within and between species of the subterra-nean mole rat Spalax ehrenbergi in Israel. Oecologia 74: 617-622.
KAMILAR JM AND BRADLEY BJ. 2011. Interspecific variation in primate coat color supports Gloger’s rule. J Biogeogr 38: 2270-2277.
KAUSE A, STIEN LH, RUNGRUANGSAK-TORRISSEN K, RITOLA O, RUOHONEN K AND KIESSLING A. 2008. Image analysis as a tool to facilitate selective breeding of quality traits in rainbow trout. Livest Sci 114: 315-324. KILNER R. 1997. Mouth color is a reliable signal of need in
begging canary nestlings. P Roy Soc Lond B Bio 264: 963-968.
LAI Y-C, SHIROISHI T, MORIWAKI K, MOTOKAWA M AND YU H-T. 2008. Variation of coat color in house mice throughout Asia. J Zool 274: 270-276.
LINNEN CR, POH Y-P, PETERSON BK, BARRETT RDH, LARSON JG, JENSEN JD AND HOEKSTRA HE. 2013. Adaptive evolution of multiple traits through multiple mutations at a single gene. Science 339: 1312-1316. LOSEY G. 2003. Crypsis and communication functions of
UV-visible coloration in two coral reef damselfish, Dascyllus aruanus and D. reticulatus. Anim Behav 66: 299-307. LOZANO RD. 1978. El color y su medición. Buenos Aires:
América Lee, 640 p.
MALINOWSKI ER. 2002. Factor analysis in Chemistry. 3rd ed., New York: Wiley-Interscience, 432 p.
MONTGOMERIE R. 2006. Analyzing colors. In: Hill GE and Mcgraw KJ (Eds), Bird coloration volume 1, Cambridge: Harvard University Press, p. 90-147.
OTTO M. 1999. Chemometrics. Statistics and computer application in analytical chemistry. New York: J Wiley & Sons, 350 p.
PATTEN MA AND UNITT P. 2002. Diagnosability versus mean difference of sage sparrow subspecies. Auk 119: 26-35.
PAXTON EH. 2009. The utility of plumage coloration for taxo-nomic and ecological studies. Open Ornithol J 2: 17-23. RICH DC AND JALIJALI J. 1995. Effects of observer
meta-merism in the determination of human color-matching functions. Color Res Appl 20: 29-35.
RIOS E AND ÁLVAREZ-CASTAÑEDA ST. 2012. Pelage color variation in pocket gophers (Rodentia: Geomyidae) in relation to sex, age and differences in habitat. Mamm Biol 77: 160-165.
RUIZ JF AND PEREIRA J. 2014. The colours of rock art. Analysis of colour recording and communication systems in rock art research. J Archaeol Sci 50: 338-349.
SCHANDA JD. 1997. Colorimetry, Chapter 9. In: Decusatis C (Ed), Handbook of Applied Photometry, Woodbury: AIP Press, p. 327-412.
SCHANDA J (Ed). 2007. Colorimetry. Understanding the CIE System. New Jersey: J Wiley & Sons, Inc.
SCHMITZ-ORNÉS A. 2004. A new methodology to use color spectral data for taxonomic, phylogenetic, and biogeographic studies. An example with three genera of lowland hummingbirds: Topaza, Anthracothorax, and
Eulampis. PhD thesis, Rheinischen Friedrich-Wilhelms-Universität Bonn.
SENAR JC. 2004. Mucho más que plumas. Barcelona: Monografies del Museu de Ciències Naturals 2, 191 p. SEZER M AND TEKELIOGLU O. 2009. Quantification of
Japanese quail eggshell color by image analysis. Biol Res 42: 99-105.
SINGARAVELAN N, RAZ S, TZUR S, BELIFANTE S, PAVLICEK T, BEILES A, ITO S, WAKAMATSU K AND NEVO E. 2013. Adaptation of pelage color and pigment variations in Israeli subterranean blind mole rats, Spalax ehrenbergi. PLoS ONE 8(7): e69346.
SOKAL RR AND ROHLF FJ. 1981. Biometry. The principles and practice of statistics in biological research. 2nd
ed., New York: W.H. Freeman and Company.
STEVENS M, PÁRRAGA C, CUTHILL I, PARTRIDGE J AND TROSCIANKO T. 2007. Using digital photography to study animal coloration. Biol J Linn Soc 90: 211-237.
SUMNER P AND MOLLON JD. 2003. Colors of primate pelage and skin: objective assessment of conspicuousness. Am J Primatol 59: 67-91.
VAUGHN M, VAN OORSCHOT R AND BAINDUR-HUDSON S. 2008. Hair color measurement and variation. Am J Phys Anthropol 137: 91-96.
VILLAFUERTE R AND NEGRO J. 1998. Digital imaging for color measurement in ecological research. Ecol Lett 1: 151-154.
WYSZECKI G AND STILES WS. 1982. Color science: concepts and methods, quantitative data and formulae. 2nd
ed., New York: J Wiley & Sons, 950 p.
APPENDIX
Examined specimens of the species included in this study. Specimens are individualized by the acronym of the collection or collector and the number that corresponds to them in the collection or collector catalog. CML is the acronym of the Colección
Mamíferos Lillo -CML- (Facultad de Ciencias
Naturales and Instituto Miguel Lillo, Universidad
Nacional de Tucumán, Argentina), and LIF and
LT-RMB are collector acronyms. Specimens are arranged according to their geographical origin (political province), sex, collection season and sample antiquity.
Akodon budini
JUJUY: Males:
Winter 70s (n=10)
CML 1776, CML 1789, CML 1790, CML 1791, CML 1792, CML 1793, CML 1794, CML 1797, CML 1798, CML 1807 Summer: 70s (n=10)
CML 1738, CML 1739, CML 1740, CML 1741, CML 1743, CML 1747, CML 1748, CML 1749, CML 1750, CML 1751 Females:
Winter: 70s (n=4)
CML 1799, CML 1800, CML 1801, CML 1806
Summer: 70s (n=3)
CML 1744, CML 1745, CML 1746 Males:
Winter: 90s (n=5)
CML 4603, CML 4604, CML 4608, CML 4611, CML 4612
Midseason: 90s (n=1) CML 4613 Females:
Winter: 90s (n=3)
CML 4605, CML 4606, CML 4607 Males:
Midseason: 2000s (n=5)
LIF 743, LIF 749, LIF 750, LT-RMB 114, LT-RMB 120
Females:
Winter: 2000s (n=2) CML 8978, CML 8980 Midseason: 2000s (n=4)
LIF 744, RMB 112, RMB 113, LT-RMB 119
SALTA: Males:
Midseason: 90s (n=2) CML 5524, CML 5526 Indeterminate sex:
Midseason: 90s (n=1) CML 5529 Males:
Winter: 2000s (n=4)