Open Government Data (OGD) driven decision aid: a predictive
model to monitor COVID-19 and support decisions in a
Brazilian State
7The objective of this research is to build a forecasting model for the evolution of COVID-19 in the state to assist governmental decision-making. This study adopts the Continuous Intelligent Pandemic Monitoring (CIPM) methodology to evaluate the COVID-19 situation in the state of Santa Catarina, Brazil. By examining data from the state of Santa Catarina, this research examines the reasonableness of current epidemic numbers by using different exogenous variables, determines the severity level of the pandemic in the cities, and simulates its impacts to guide the government in terms of adequate public policy enforcement. The results reveal that the model helps to understand the importance of open data, and highlights the relevance and social contribution of the availability of data in real-time. Additionally, the prediction model contributes to governmental and societal decision making, as it helps to understand the effects of the pandemic on society through the analysis of exogenous variables (Demographic density; Industrial jobs; Percentage of urban population; Territorial extension of the municipality; List of municipalities by region; GDP/Per capita).
Keywords: COVID-19, Open Government Data, Predictive Capacity, Analytic Methodologies, Decision Aid
7DOI: https://doi.org/10.21874/rsp.v71i0.5009 ISSN: 0034-9240 | E-ISSN: 2357-8017 Submitted: August 18, 2020. Published: September 1th, 2020.
REVISTA DO SERVIÇO PÚBLICO | Brasília 71(special) 140–164 set. 2020
Huijue Kelly Duan1
Hanxin Hu1
Miklos Vasarhelyi2
Fabricia Silva Rosa3
Mauricio Vasconcellos Leão Lyrio4 1Rutgers, the State University of New Jersey, USA 2State University of New Jersey, USA 3Federal University fos Santa Catarina (UFSC), Brazil 4Santa Catarina's State Government, Brazil
Apoio à decisão orientada por Dados Abertos Governamentais (DAG): proposta de modelo preditivo para monitorar COVID-19 e subsidiar decisões em um estado brasileiro
O objetivo desta pesquisa é construir um modelo de previsão da evolução do COVID-19 no estado para auxiliar na tomada de decisões governamentais. Este estudo adota a metodologia Continuous Intelligent Pandemic Monitoring (CIPM) para avaliar a situação do COVID-19 no Estado de Santa Catarina, Brasil. Ao examinar os dados do Estado de Santa Catarina, esta pesquisa examina a razoabilidade dos números atuais da epidemia por meio de diferentes variáveis exógenas, determina o nível de gravidade da pandemia nas cidades e simula seus impactos para orientar o governo em termos de público adequado para a aplicação de políticas públicas. Os resultados revelam que o modelo ajuda a compreender a importância dos dados abertos e destaca a relevância e a contribuição social da disponibilização de dados em tempo real. Além disso, o modelo de previsão contribui para a tomada de decisão do governo e da sociedade, pois ajuda a entender os efeitos da pandemia por meio da análise de variáveis exógenas (Densidade demográfica; Empregos industriais; Percentual da população urbana; Extensão territorial do município; Lista de municípios por região; PIB / per capita).
Palavras-chave: COVID-19, Dados de Governo Aberto, Capacidade Preditiva, Metodologias Analíticas, Apoio à Decisão
Apoyo a la decisión orientada por Datos Abiertos Gubernamentales (DAG): proposición de modelo predictivo para monitorear el Covid-19 y subsidiar decisiones en un estado brasileño
El objetivo de esta investigación es construir un modelo de pronóstico para la evolución del COVID-19 en el estado para ayudar en la toma de decisiones gubernamentales. Este estudio adopta la metodología de Continuous Intelligent Pandemic Monitoring (CIPM) para evaluar la situación del COVID-19 en el estado de Santa Catarina, Brasil. Al examinar los datos del estado de Santa Catarina, esta investigación examina la razonabilidad de las cifras de epidemias actuales con el uso de diferentes variables exógenas, determina el nivel de gravedad de la pandemia en las ciudades y simula sus impactos para orientar al gobierno en términos de público adecuado para definición de políticas públicas. Los resultados revelan que el modelo ayuda a comprender la importancia de los datos abiertos y destaca la relevancia y la contribución social de la disponibilidad de datos en tiempo real. Adicionalmente, el modelo de predicción contribuye a la toma de decisiones gubernamentales y sociales, ya que ayuda a comprender los efectos de la pandemia en la sociedad a través del análisis de variables exógenas (Densidad demográfica; Empleos industriales; Porcentaje de población urbana; Extensión territorial del municipio; Listado de municipios por región; PIB / per cápita).
Palabras clave: COVID-19, datos de gobierno abierto, capacidad predictiva, metodologías analíticas, apoyo a la toma de decisiones
Introduction
Covid-19 originated in Wuhan, China, with the first recorded cases in December 2019. On March 11, 2020, it was declared a pandemic by the World Health Organization (DESJARDINS et al., 2020). This is because Covid-19 reached the epidemiological criteria of a pandemic, with more than 100,000 infected people in 100 countries (CALLAWAY, 2020).
The consequences of the Covid-19 being declared a pandemic by the World Health Organization in March 2020, involved measures in many countries around the world and had a profound impact on society, both from a social and economic point of view. It is the role of the state to safeguard universal rights to health and life, through actions related to public health, political and institutional arrangements, hiring, acquisitions, and directing productive resources in an effective and timely manner to confront the pandemic.
Brazil, with the second-highest number of confirmed cases65, has become the second most severe hub after the U.S. In Brazil, from February 26 to August 17, 2020, there have been 3,340,197 confirmed cases, with 107,852 deaths. Federal and state governments are proactively seeking a way to control the spread of the disease, provide guidance to the citizens to prevent the infections, and deploy adequate resources to hospitals and regions to ease the impact of Covid-19.
What is already known about this pandemic is that the risk of transmission is considered uncontrollable so far because there is no cure, and the vaccines may not be available for a few months (Atluri, Manchikanti & Hirsch, 2020), which promotes global panic (CHIOLERO, 2020) and serious already perceived economic consequences (XIANG et al., 2020; CANDEAIS; MORHARD, 2020).
Decision making should be performed using the principle of proportionality, weighing compromising usual standards against the optimization of benefits to the greater society (SOLNICA; BARSKI; JOTKOWITZ, 2020).
With the lack of cure or vaccines in the short term, information becomes the only way to confront Covid-19, providing subsidies for government action, engagement and social control. The data and information made available by the government, in turn, becomes the raw material for generating public value, enabling the analysis of the evolution of the pandemic, the prediction of its behavior, and following public action more proactively and effectively. The use of analytical methodologieseis recognized as capable of providing important information for the governmental
decision-making process in times of considerable uncertainty, such as the current crisis caused by the pandemic (FONG et al, 2020).
This study aims to propose a predictive analytical model to support the Government of
Santa Catarina in decision making regarding Covid-19, and to demonstrate the potential usage of
open government data – OGD – to generate public value. Continuous Intelligent Pandemic
Monitoring– CIPM methodology (Duan; Hu 2020 a,b) and structured data in an open format, made
available by the state of Santa Catarina and other government entities, are used. The CIPM model was implemented using a combination of archival and research data collected from 259 Brazilian municipalities, specifically in the state of Santa Catarina, to validate the related numbers, assess the epidemic severity of the cities and provide guidance to the government to better implement adequate public policies to the regions in need.
Santa Catarina stood out at the beginning of the pandemic for anticipating measures of containment and having a better performance than other Brazilian states in facing the pandemic. In Santa Catarina, Covid-19 has already caused 1,839 deaths, with a lethality of 1.49% in the identified cases. The cases were confirmed in all 295 municipalities in Santa Catarina, with 188 cities registering at least one death (SANTA CATARINA, 17.08.2020).
This study makes significant contributions to current pandemic control in the state of Santa Catarina. It provides an evaluation of the current evolution of the pandemic to the authorities and expands discussions on the use of open data, identifies the risky regions to deploy adequate resources, and guides the authorities to implement different policies at a specific time point and to society for social control. This study applies the CIPM methodology (Duan; Hu 2020 a,b) to the state of Santa Catarina, systematically evaluating the situation in the region. The study not just assesses the reasonableness of the Covid-19 confirmed cases, but also identifies the high-risk cities to better guide the government to deploy the resources and implement preventive actions.
This study is organized as follows. Section 2 discusses the current studies about Covid-19. Section 3 presents the methodology, including data collection and model construction. Section 4 illustrates the results of the evaluation. Section 5 concludes the study and discusses the limitation of this study as well as future research.
2. Literature Review
The risk of transmission of Covid-19 is considered uncontrollable so far because there is no cure, and vaccines may only be available in the next few months (Atluri; Manchikanti; Hirsch, 2020), which promotes global panic (CHIOLERO, 2020). Economic consequences are already
perceived, with the price of oil, the stock market, gold, currencies, and almost all areas of the global market being affected (XIANG et al., 2020). As a consequence, the spread of this pandemic can be considered the "greatest global economic risk" in recent years (CANDEAIS; MORHARD, 2020).
In search for solutions or alleviation of this problem, governments around the world have adopted social isolation as a security measure, following the Chinese case that demonstrated efficiency using the Covid-19 containment quarantine (WHO, 2020). However, social isolation brings an economic impact since companies are unable to produce or provide their services. This causes countries affected by the pandemic to adopt measures to combat the economic effects of the crisis, such as the postponement and exemption from taxes, in addition to social aid (GOPINATH, 2020; KPMG CHINA; LU, 2020; TANNE, 2020).
However, these measures have a paradox that calls into question the fiscal capacity of governments. While there is a reduction in revenue from taxes, at the same time, there is an increase in health and social spending. Besides the reduction of revenue from postponing and decreasing taxes, there is an increase in government spending on many areas including health, since the health system is under pressure from the exponential rise in the number of cases exceeding the installed capacity of the health system. For example, countries have needed to increase the number of ICU beds in hospitals, outpatient testing, hiring health personnel, purchasing materials, and equipment, etc.
Three significant strategies (Rafael et al 2020) have emerged for containing the rising curve of cases and deaths from Covid-19: 1) expansion of testing of suspected cases with quick delivery of results, 2) identification of transmitters of the disease with subsequent and immediate home isolation, 3) investments aimed at protecting health professionals.
The government of the State of Santa Catarina has taken several actions to minimize the social and economic impact of the pandemic, such as: opening data on Covid-19 agility, openness in the public procurement process, expansion of the hospital care network and emergency social assistance.
These strategies should lead to expanding assistance capacity of the health system, displacingt professionals focused on assistance, as well as monitoring, and implementing, community control strategies. The current crisis highlights the need to think about future pandemics from a population-based management approach and apply outside the box critical thinking (GONIEWICZ et al, 2020). Following this understanding, involves, on the one hand, the use of OGD to promote engagement and collaboration between government and citizens in the
pursuit of generating public value. On the other hand, there is an essential need for the use of predictive models to support governmental decision-making.
Open Government is defined as a multilateral, political, and social process, which includes transparent, participatory, and collaborative actions by the government, integrating citizens and social groups with the support of Information and Communication technologies. The principles of open government are (i) transparency to provide information through ICT; (ii) participation in promoting public engagement and social control; and, (iii) collaboration within the government and with citizens, social organizations and the private sector using technology and innovation (WIRTZ; BIRKMEYER 2015)
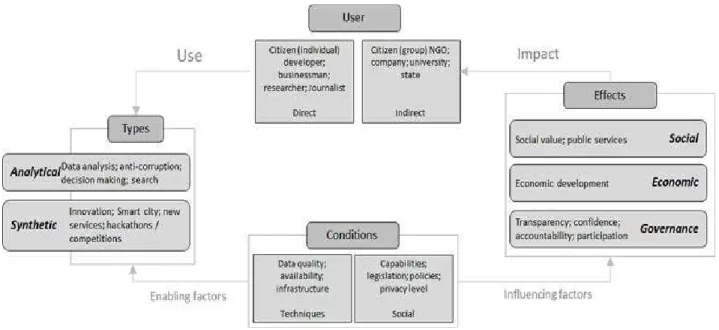
OGD, in turn, is described as data that can be freely used, reused and redistributed by anyone. The opening of data aims to avoid mechanisms of control and restrictions on the data that are published, allowing both individuals and legal entities to explore this data freely (OPEN DEFINITION, 2014). OGD has attracted much attention in recent years, becoming part of the everyday lexicon of transparency activists, NGOs, and public officials (SAFAROV; MEIJER,; GRIMMELIKHUIJSEN 2017). Publishing government data, thereby making it available to the public, could be useful in many ways, such as increasing transparency and accountability in governments, increasing overall efficiency and performance, encouraging public engagement, and achieving trust and reputation (Alzamil and Vasarhelyi 2019). As shown in Figure 1, different users of the information demand different types of use and suffer the effects of opening data. Governments, in turn, need to provide conditions, both technical and social, to enable the use of data and to influence the effects of its use, which incorporate social issues, economics, and governance.
Figure 1: OGD utilization framework
Source:Safarov; Grimmelikhuijsen; Meijer (2017)
The government has a fundamental role in the crisis, either by providing open data to assist decision-making processes of the government itself and for society, or as an agent that defines public policies and directs organizational resources to face the pandemic. For example, the Norwegian government managed to control the pandemic rather quickly by adopting a suppression strategy, followed by a control strategy, based on collaborative and pragmatic decision-making, successful communication with the public, many resources and a high level of citizens' trust in government (CHRISTENSEN; LÆGREID, 2020).
What is known is that the more data disclosed to the public, the more people can construct their perception of reality (LUTHFI; JANSSEN, 2019). In the Covid-19 pandemic, Open Government Data contributes to government and society decision-making, and captures the nuance and variation across restrictions, suspensions, and enforcement mechanisms (Curley and Federman 2020), and makes it available to society assisting in epidemic and economic actions. As more data becomes available, the statistic can be rerun to support timely surveillance of Covid-19 (DESJARDINS; HOHL; DELMELLE 2020).
Open Government Data increases transparency and accountability in governments, enhances the overall efficiency and performance of the government, encourages public engagement and achieves trust and reputation (ALZAMIL; VASARHELYI 2019). The availability of government data promotes the improvement of social participation, the empowerment of
citizens by inspecting the government actions, the enhancement of the information quality, the efficiency of management operations and services offered to the citizens, and the seamless process elaboration and conduction of public policies (FERREIRA-DA-SILVA, VAZ; FONSECA-DOS-SANTOS 2014).
Previous literature on data analytics has long recognized the usefulness and effectiveness of analytical methodologies for expanding predictive capacity and assisting decisions (MANCA; CALDIROLI; STORTI, 2020). It was argued that analytical methodologies provide the necessary information for decision-making during periods of considerable uncertainty, such as the crisis caused by the 2020 pandemic (FONG et al, 2020). However, it is not clear how analytical methodologies can contribute to the government's predictive measures to face the pandemic since the epidemic, and economic uncertainties caused by this pandemic areincomprehensible and unpredictable.
Having this knowledge is essential because the government needs to determine which areas are more susceptible to the disease severity so that the authorities can prioritize equipment and supply distributions and deploy adequate regional resource distribution. Timely access to the supply of medical, PPE, and other equipment is essential to control the pandemic. These resources are an indispensable requirement for medical and non-medical personnel supporting controll pandemic (ENDRAIA, 2020).
Many research studies have examined the current epidemic situation; for example, the traditional epidemic models SIR and SEIR models are widely used by researchers to assess the transmission of the disease (ELLISON 2020; WANGPING et al., 2020; LI; MULDOWNEY; VAN DEN DRIESSCHE, 1999.). Many others are also exploring the use of different machine learning models and time series models. Lima et al. (2020) use an ARIMA time series model to predict the confirmed cases and death cases related to Covid-19. Ribeiro et al. (2020) use ARIMA and several machine learning models to predict the cumulative confirmed cases in ten Brazilian states. Duan and Hu (2020 a, b) propose using the combination of time series models, machine learning algorithms, clustering method, and epidemic models to systematically evaluate the pandemic situation.
Comfort et al (2020) describe implications from this crisis for better decision‐making, with collective cognition, amplified by timely, valid communication and supported by sound planning, trained personnel, appropriate technology, and bold leadership, to enable coordinated action needed to bring a large‐scale global crisis under control.
This section presents information on data collection and treatment, in addition to explaining the basis for the proposed model. It first examines Data Collection and then focuses on Model Construction.
3.1. Data Collection
The data for different epidemic numbers, including confirmed cases, hospitalizations, deaths, suspected cases, etc., are collected from various government portals, including State Health Department66, and the Santa Catarina State Open Data Portal67.
The state of Santa Catarina has a territory of only 95.4 thousand km², making it the smallest state in the south of Brazil. Santa Catarina has 295 municipalities, and its capital is Florianópolis. Santa Catarina is in the geographical center of the regions with the highest economic performance in the country, South and Southeast, and in a strategic position in Mercosur. The state borders Paraná (to the north), Rio Grande do Sul (to the south), Atlantic Ocean (east), and Argentina (west) (SANTA CATARINA, 2020).
Table 1: Characteristics of the municipalities of Santa Catarina
Regions
N.
Munic Size
No. Popul
Greater Florianópolis 21 Small (below 20,000 popul.) 234
North 26 Medium (Between 20,000 to 100,000 popul.) 48
West 118 Large (over 100,000 popul.) 13
Mountain 30 GDP / Per capita
South 46 Small (below R $ 20,000.00 /popul.)
Medium (Between R $ 20,000 / inhab to R $ 100,000 /popul.)
Large (Above R $ 100,000 /popul.)
40 252 3
Itajaí Valley 54
Source: Adapted from Santa Catarina
According to data from the Government of the State of Santa Catarina68, the state has already registered 120,880 confirmed cases of infection with the new coronavirus, of which 108,039 are already recovered, and 11,044 are being monitored. This number was released as of
66 Epidemic related numbers and information is available at:
city=&city_ibge_code=&place_type=&last_available_date=&is_last=&is_repeated=
67 The Santa Catarina State Open Data Portal. Information is available at: http://dados.sc.gov.br/group/covid-19 68 https://www.sc.gov.br/noticias/temas/coronavirus/coronavirus-em-sc-estado-confirma-120-880-casos-108-039-
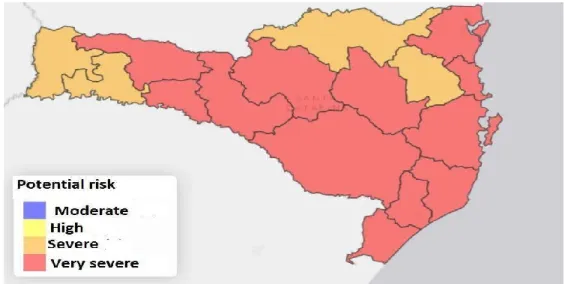
Sunday, August 16, 2020. Covid-19 has already caused 1,797 deaths in the state since the beginning of the pandemic. The current fatality rate is 1.49% of identified cases. Cases have already been confirmed in all 295 municipalities in Santa Catarina, with 188 cities having recorded at least one death. The location with the largest number of people who have contracted Covid-19 is Joinville, with 10,124 cases. Next are Blumenau (7,208), Balneário Camboriú (5,263), Florianópolis (4,965), Chapecó (4,739), Itajaí (4,280), Criciúma (3,898), Brusque (3,660), São José (3,472) and Palhoça (3,310).
Figure 2: Covid-19 in Santa Catarina: Potential risk by region (17.08.2020)
Source: Adapted from Santa Catarina
Exogenous data was obtained from various channels, including Google Trends and the Apple mobility app. Additionally, a set of demographic features for each city in the state of Santa Catarina was collected from the government portal. These features are demographic density, industrial jobs, industrial establishments, percentage of the urban population, territorial extension of the municipality, municipalities by region, and GDP per capita.
3.2. Model Construction
Following the CIPM approach (Duan; Hu 2020), the analysis focuses on three perspectives, as illustrated below: Number Validation; Clustering Approach; and Epidemic Simulation.
This part of the analysis focuses on using a time series model to estimate the evolution of the pandemic by utilizing various exogenous data. This includes the time series model, ARIMA model with a 30-day sliding window approach (Duan; Hu 2020 a,b) to assess the accuracy of the number of current confirmed cases, deaths numbers, the percentage of suspected cases, and the number of suspected cases.
For example, we use data from June 24, 2020, to July 24, 2020, as the training set to predict the respective numbers on July 25, 2020. For the next day evaluation, July 26, 2020, the size of the training set is kept constant, 30 days, which means that the training set is rolling from June 25, 2020, to July 26, 2020.
The model continues iterating this approach for the following days’ predictions. Additionally, several exogenous data, including Google Trends69 and theApple mobility report70 are included in the model to enhance the accuracy of the model performance. New exogenous variables can be added to the model as the information becomes available.
Chart 1: Search variables
DATA 1.Demographic density 2.Industrial jobs 3.Industrial establishments 4.Percentage of urban population
5.Territorial extension of the municipality
6.List of municipalities by region
7.* Volume of passengers carried (SIE) *
8.* Transported cargo flow (DETRAN) * (origin, destination, volume, date)
9.GDP per capita
Source: Adapted from Santa Catarina
69 Google Trends include the searches for COVID-19, Coronavirus, Flu in Brazil. The information can be found at:
https://trends.google.com/trends/?geo=Brazil
70 Apple mobility report can be found at: https://www.apple.com/covid19/mobility
SOURCE
Densidade demográfica: IBGE, Censo Demográfico 2010, Área territorial brasileira. Rio de Janeiro: IBGE, 2011
2010 http://atlasbrasil.org.br/2013/pt/download/base/ Not available
SNIS 2018
Área Territorial: Área territorial brasileira. Rio de Janeiro: IBGE, 2018
https://www.causc.gov.br/wp-Municipios-do-Estado-de-SC-por-Mesorregioes.pdf Not available
Not available
PIB per capita: IBGE, em parceria com os Órgãos Estaduais de Estatística, Secretarias Estaduais de Governo e
3.2.2. Clustering Approach
After developing an understanding of the current epidemic numbers, the next step is to utilize cross-sectional analytics to identify the time-invariant factors that could have a significant impact on the pandemic, as well as to identify the potential high risky cities by using a clustering method. The cities in the state of Santa Catarina are clustered together with their peer groups based on a similar vulnerability to Covid-19, which can also help extrapolate underlying trends and patterns of the epidemic.
3.3. Epidemic Simulation
By using the epidemic model, SEIQHRF71, this step enables the users to simulate the model based on different compartments at a different time interval. The impact and consequences are presented to guide adequate policy enforcement. The compartments used in the SEIQHRF model are explained in Appendix I. Based on current policy enforcement, the model generates an alert if the current policy will not sufficiently prevent the spread of the disease or it requires further actions to limit the impact.
4. Results
In this session, the results are presented: Number Validation Results, Clustering Approach Results, Epidemic Simulation Results.
4.1. Number Validation Results
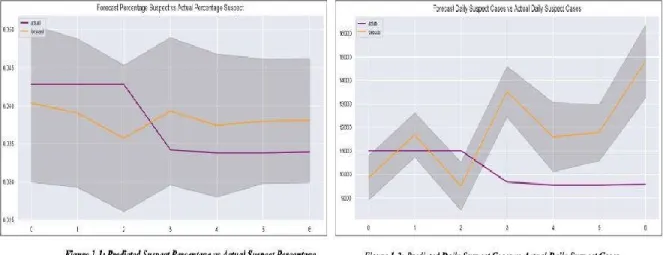
Based on the analysis, the overall recorded epidemic data in Santa Catarina seems unreasonable. As indicated in Figure 3, the forecast trend and the actual development of the percentage of suspect cases, daily confirmed cases, and the daily deaths are reasonably similar within a 95% confidence interval.
However, the fluctuation of recorded data could raise some concerns. From an auditor’s point of view, these numbers seem suspicious and unreasonable, so further investigation is required. For example, the fluctuation of daily confirmed cases and deaths cases seems unreasonably large. Also, the number of suspect cases turns flat towards the end of the predicting period after a downward slope. From an auditor’s point of view, these numbers seem suspicious and unreasonable, requiring further investigation. Extending the analysis, we examined the
71 Susceptible, Exposed, Infected and infectious, Self-Isolation, Hospitalization, Fatality, Recovered (SEIQHRF)
detailed data collected from the governmental portal72. Unusual records are noted in the publicly disclosed files. For example, on May 1, 2020, the state of Santa Catarina has a negative number of new confirmed cases, -290; specifically, the city of Florianópolis has -94, Brusque has -21, Blumenau has -18, Joinville has -14, etc.
These results differ from those presented by several countries around the world, where the behavior of the disease was shown to increase in the first months of the infection (DEJARDINS et al., 2020; CALLAWAY, 2020). In addition to the inconsistent data, it was also not possible to have free access to data on the number of industrial establishments and the movement of people and cargo in the State of Santa Catarina. Inconsistent data and missing data can be a problem of open government data transparency. That is because open government data is a type of data that can be used, reused and redistributed freely by anyone (Open Definition, 2014) which should allow the integration of government, citizens and social groups with the support of information and communication technologies (WIRTZ; BIRKMEYER 2015).
72 Daily confirmed cases and daily deaths cases are collected here:
Figure 3. Number Validation
Source: The authors
Throughout the dataset from March 12, 2020, to July 31, 2020, there are many instances when the daily confirmed cases are reported as negative numbers. It is understandable to adjust the initially reported numbers, considering the time delay of recording the numbers. However, reporting a negative number might not provide sufficiently information to the public or to evaluate the severity of the situation. Based on the above analysis, a better recording system is needed to provide more accurate information to the public, which can improve the government’s ability to evaluate the situation and make appropriate policy decisions.
4.2. Clustering Approach Results
A set of time-invariant features are identified based on local geographic features (see Table 2), and local cultures, including demographic density, industrial jobs, industrial establishments, percentage of urban population, territorial extension of the municipality, list of municipalities by region, and GDP per capita.
Table 2. Geographic Features
Data Variable
DATA 1 Demographic density DATA 2 Industrial Jobs
DATA 3 Percentage of urban population DATA 4 Territorial extension of the municipality DATA 5 List of municipalities by region
DATA 6 GDP / Per capita Source: The authors
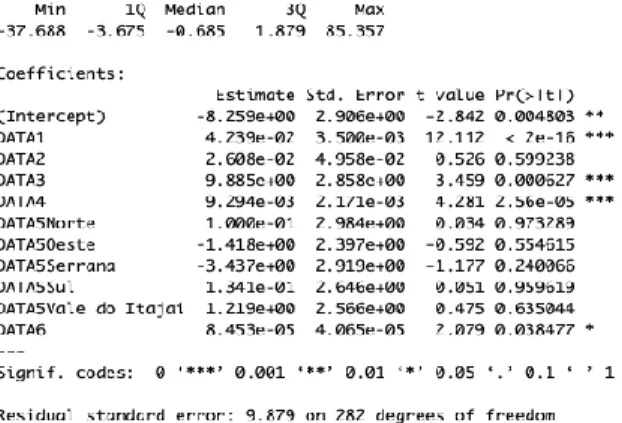
Regression analysis is performed to identify the significant factors associated with the pandemic. In this case, we examine the relationship between the confirmed cases with each factor. We use a 7-day average standard deviation of the confirmed cases as the dependent variable, and the set of geographic features as the independent variables.
Table 3. Correlation Results
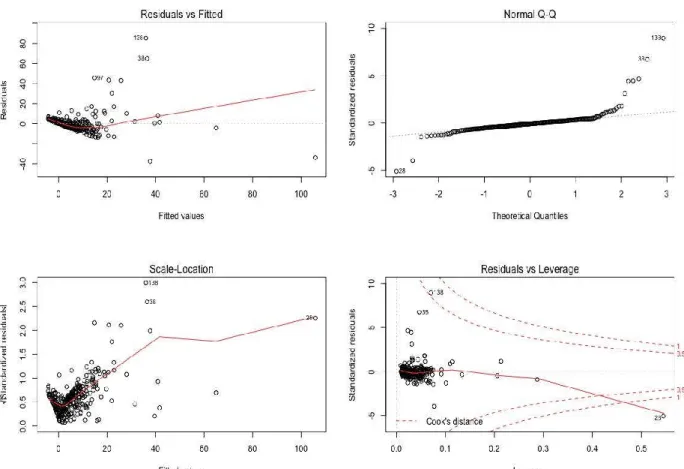
Figure 4. Collinearity Check
Source: The authors
The regression results in Table 3 and Figure 4 indicate that demographic density, percentage of the urban population, a territorial extension of the municipality, and GDP per capita are significant factors. Additionally, the model is robust concerning collinearity issues, although there are some outliers.
Based on the features identified above, a clustering method was used to categorize the cities in the state of Santa Catarina into different clusters. Cities in the same cluster will exhibit similar vulnerability to the disease with their peer groups. Identifying these peer groups, the government can better access the pandemic conditions of a specific city and allocate appropriate resources to the region. Figure 5 (5.1. and 5.2) illustrates the results of this analysis. First, the silhouette score is assessed to determine the proper number of clusters. Silhouette score is used to“measure how close each point in one cluster is to the points in the neighboring clusters; it has a range between -1 and 1.73” Based on the silhouette score, obtaining 3 clusters seems
73 Silhouette score explanation and information is available at:
reasonable. Also, the cluster-ID for each city in the state of Santa Catarina can be identified, and each city can find their peer group.
Figure 5.1. Silhouette Score Result
Source: The authors
Figure 5.2 K-Means Clustering Results
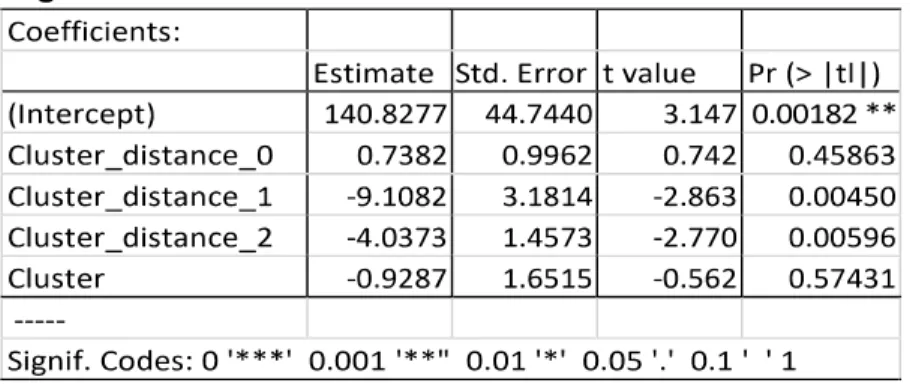
Furthermore, the distance between each point and the centroid point for each cluster was measured. Regression analysis was performed to determine the significant clusters (see Table 4).
Table 4. Cluster regression result
Source: The authors
Based on the results, cluster 1 and cluster 2 are significant clusters, which means that the cities within these two clusters are more susceptible to disease severity. In other words, the cities that are closer to the center point in cluster 1 and cluster 2 may suffer from more pandemic risk compared to the others. As such, the government should evaluate the preventive policies and medical resources available in such cities and determine whether the current level of policy can adequately control the spreading of the disease.
Corroborating previous studies (Li; Muldowney;Van Den Driessche 1999; Endraia, 2020; Ellison 2020; Wangping et al., 2020; Ribeiro et al., 2020), these results demonstrate that the forecast allows policymakers to adopt a proactive stance to face the pandemic, such as knowing in advance which industrial regions may be vulnerable to more severe pandemic risk. This can help the government and civilians to adopt in advance epidemiological prevention measures.
4.3. Epidemic Simulation Results
To assess the adequacy of each policy, such as social distancing or self-isolation, an epidemic simulation model was constructed to assist the government in determining actions. For instance, based on 3 infected cases and 9997 non-infected cases, a baseline model was developed based on no prevention policy put in place, which resulted in the infected cases rising to more than 3,000. After implementing both self-isolation and social distancing policies starting day 15, the infected cases dropped significantly, close to zero. A comparison between the baseline model and a simulated model was performed to assess the effect of a specific policy.
As indicated in Figure 6 (6.1, 6.2, 6.3), we can see the discrepancy between the baseline model and simulated models based on social distancing only, isolation, and the combination of social distancing and isolation.
Figure 6.1: Baseline model vs Increasing social distance and isolation
Source: The authors
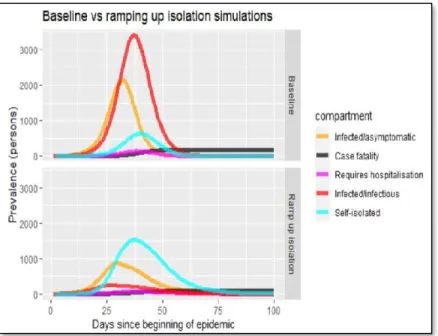
Figure 6.2: Baseline model vs Increasing isolation
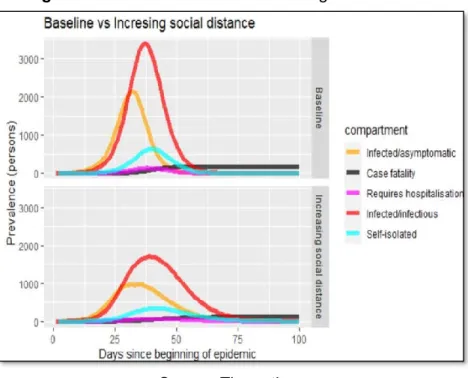
Figure 6.3: Baseline model vs Increasing social distance
Source: The authors
Figure 6.1-6.3. Use the SEIQHRF model to simulate the impacts of different social intervention policies assuming the total number of populations is equal to 10000. When enforcing self-isolation and social distancing, we can better control the transmission of Covid-19
The results are consistent with previous studies that indicate that social isolation is the most effective preventive measure found so far (WHO, 2020; ATLURI; MANCHIKANTI; HIRSCH, 2020; CHIOLERO, 2020; XIANG et al., 2020; CANDEAIS; MORHARD, 2020; GOPINATH, 2020; KPMG CHINA; LU, 2020; TANNE, 2020).
It is important to consider that OGP can increase the ability of the nation to analyze the behavior of the disease as it encourages public engagement, and achieves citizens’ trust and reputation (ALZAMIL;VASARHELYI 2019). For example, OGP allows for free access to society on epidemic and social information, and thus adequate care can be provided in a timely fashion to the public before the pandemic becomes uncontrollable.
Also, the use of SEIQHRF simulates the impacts of different social intervention policies, as it allows authorities to know the dimension and scope of the pandemic. For example, it is possible to predict the movement of Covid-19 from coastal regions to the inland, or from industrial regions to rural areas. This allows the government to launch public social protection policies preventively, by expanding hospital beds or releasing and providing financial assistance to families.
Conclusion
This study proposes a predictive model to support government decision-making to cope with the Covid-19 pandemic using open government data. We adopted an innovative approach (CIPM) to examine the current pandemic situation from the perspective of accountants and auditors (DUAN; HU 2020 a,b). We validate the likelihood of current epidemic numbers by utilizing exogenous data, assessing the disease severity level of each city in the state of Santa Catarina using the clustering approach, and providing guidance for policymakers.
In Santa Catarina, Covid-19 has already caused approximately 2,000 deaths with a lethality of 1.49% of identified cases. Cases were confirmed in all 295 municipalities in Santa Catarina, with 188 cities registering at least one death.
The results of this study point out that the data recording process requires substantive government attention. In many cases, the recorded information seems unlikely, which could significantly impact decision making. Additionally, the study pinpoints specific cities that are highly susceptible to disease severity, which can direct the government’s attention. Furthermore, based on a specific situation in a particular city, the model can provide simulation results based on current and forthcoming policies, as well as illustrate the impact of the timing of policy implementation.
Our empirical analysis using a sample of daily confirmed cases, daily deaths,and daily percentage of suspected cases, is consistent with our expectation. In particular, we found that the current publicly disclosed epidemic numbers fluctuate unreasonably, which raises concern regarding the accuracy of the information recorded and provided to the public. Despite these considerations, it is believed that it was possible to present an application based on the use of open government data. Through this data, it was possible to train the model to support decision making at the governmental level. This study has some limitations. First, only a limited amount of exogenous data was collected. The predicted results can be further improved based on additional data. Second, different clustering approaches can be explored. Third, more geographical features can be collected to examine the relationship between pandemic and various factors.
For future research, the fluctuation of confirmed cases and analysis of mortality by regions can help in coping with the epidemic and assist in managing the economic consequences. Assessing the development of the epidemic will allow the local and regional governments to develop public policies and proactive actions, including entrepreneurial actions, to better face the economic fallout from the pandemic.
Appendix I. SEIQHRF model
Susceptible, Exposed, Infected and infectious, Self-Isolation, Hospitalization, Fatality, Recovered (SEIQHRF) model74
References
ALZAMIL, Z. S.; VASARHELYI, M.A. A new model for effective and efficient open government data. International Journal of Disclosure and Governance, 2019, v. 13, n. 1.
ATLURI, S.; MANCHIKANTI, L.; HIRSCH, J. A. Expanded Umbilical Cord Mesenchymal Stem Cells (UC-MSCs) as a Therapeutic Strategy In Managing Critically Ill Covid-19 Patients: The Case for Compassionate Use. Pain Physician, 2020, v. 23, p. 71-83.
CALLAWAY, E. Time to use the p-word? Coronavirus enter dangerous new phase. Nature, 2020 v. 579, n. 277, p. 12.
CANDEAIS, V; MORHARD R. The human costs of epidemics are going down but the economic costs are going up. Here’s why. World Economic Forum, 2018.
CHIOLERO, A. (2020). COVID-19: a digital epidemic. Bmj, 368.
74 SEIQHFR information can be found at:
19-transmission-part-2/
CHRISTENSEN, T.; LAGREID, P. Balancing Governance Capacity and Legitimacy - How the Norwegian Government Handled the Covid-19 Crisis as a High Performer. Public Administration Review, 2020, p. 1-6.
COMFORT L.K.; KAPUCU N., KO K.; MENONI S.; SICILIANO M. Crisis Decision-Making on a Global Scale: Transition from Cognition to Collective Action under Threat of Covid-19. Public Administration Review, 2020, v. 80, n. 4, p. 616-622.
CURLEY, CALI; FEDERMAN, P.S. State Executive Orders: Nuance in Restrictions, Revealing Suspensions, and Decisions to Enforce. Public Administration Review, 2020, v. 80, n. 4, p. 623– 28.
DESJARDINS, M. R., A.; HOHL; DELMELLE, E.D. Rapid Surveillance of Covid-19 in the United States Using a Prospective Space-Time Scan Statistic: Detecting and Evaluating Emerging Clusters.” Applied Geography, 2020, v. 118, 102202.
DUAN, HUIJUE KELLY; HANXIN HU. Continuous Intelligent Pandemic Monitoring (CIPM). Journal of Emerging Technologies in Accounting, 2020a.
DUAN, HUIJUE KELLY; HANXIN HU.. “Continuous Intelligent Pandemic Monitoring (CIPM). Journal of Emerging Technologies in Accounting, 2020b
ELLISON, G. Implications of heterogeneous sir models for analyses of COVID-19. National Bureau of Economic Research, 2020, v. 53.
ENDRAIA, A. Influence of information quality on the development of Covid-19 pandemic in Indonesian. International Journal of Advanced Science and Technology, 2020, v.29, n.6.
FERREIRA, C.F.; WESLEY, V.; MUZART, E. Dados abertos: Uma estratégia para o aumento da transparência e modernização da Gestão Pública. Revista do TCU, 2014, v. 131, p.22–29. FONG S.J., LI G.; DEY N.; CRESPO R.G.; HERRERA-VIEDMA E. Composite Monte Carlo decision making under high uncertainty of novel coronavirus epidemic using hybridized deep learning and fuzzy rule induction. Applied Soft Computing Journal, 2020, v. 93, 106282,
GONIEWICZ, K.; KHORRAM-MANESH, A.; HERTELENDY A.J., GONIEWICZ M., NAYLOR K., BURKLE F.M., JR. Current response and management decisions of the European Union to the COVID-19 outbreak: A review. Sustainability, 2020, v. 12, n. 9, 3838.
GOPINATH, G. Limiting the economic fallout of the coronavirus with large targeted policies. Mitigating the COVID economic Crisis: Act Fast and Do Whatever, 2020, v. 41.
K.P.M.G. CHINA.; LU, L. China announces tax relief measures to tackle coronavirus disruption. International Tax Review, 2020.
LI, MICHAEL; JAMES MULDOWNEY, P.; VAN DEN DRIESSCHE. Global Stability of SEIRS Models In Epidemiology. Canadian Applied Mathematics Quarterly, v. 7, n. 4, 1999.
LIMA, C.l.; CECILIA, C.S.; SILVA, A.C.G.; SILVA, E.L.; MARQUES, G.S.; ARAUJO, L.J.B.; ALBUQUERQUE JUNIOR, F.A. COVID-SGIS: A Smart Tool for Dynamic Monitoring and Temporal Forecasting of Covid-19. MedRxiv, 2020.
LUTHFI, A.; JANSSEN, M.. 2019. Open Data for Evidence-Based Decision-Making: Data-Driven Government Resulting in Uncertainty and Polarization. International Journal on Advanced Science Engineering Information Technology, 2019, v. 9, n. 3, p. 71–78.
MANCA D., CALDIROLI D., STORTI E. A simplified math approach to predict ICU beds and mortality rate for hospital emergency planning under Covid-19 pandemic. Computers and Chemical Engineering, , 2020, v. 140, n. 2.
OPEN DEFINITION. Guia de Dados Abertos (2014). disponivel em https://opendatahandbook.org/guide/pt_BR/ acessado em 17.07.2020.
RAFAELL, R. D. M. R.; NETO, M.; CARVALHO, M. M. B. D.; DAVID, H. M. S. L.; ACIOLI, S.; FARIA, M. G. D. A. Epidemiologia, políticas públicas e pandemia de Covid-19: o que esperar no Brasil? Rev. enferm, 2020, p. 49570-49570.
RIBEIRO, M.H.M.; RAMON G.S.; VIVIANA C.M.; COELHO, L.S. Short-Term Forecasting COVID-19 Cumulative Confirmed Cases: Perspectives for Brazil. Chaos, Solitons and Fractals, 2020, 135.
SAFAROV, I.; MEIJER, A.J.; GRIMMELIKHUIJSEN, S. Utilization of Open Government Data: A Systematic Literature Review of Types, Conditions, Effects and Users. Information Polity, 2017, v. 22, n. 1, p. 1-24.
SANTA CATARINA, Dados sobre COVID-19 no Estado de Santa Catarina. disponível em http://www.coronavirus.sc.gov.br/.Acessado de 01.06.20 a 17.06.20.
SOLNICA A.; BARSKI L.; JOTKOWITZ A. Allocation of scarce resources during the COVID-19 pandemic: A Jewish ethical perspective. J Med Ethics, 2020; 1-3.
TANNE, J. H. (2020). COVID-19: Trump proposes tax cuts and improved health insurance, but millions are not covered.
WANGPING, J.; HAN KE, S.Y.; WENZHE, C.; SHENGSHU, W.; SHANSHAN, Y.; JIANWEI, W. Extended SIR Prediction of the Epidemics Trend of COVID-19 in Italy and Compared With Hunan, China. Frontiers in Medicine, 2020, v. 7, p. 1-7,
WIRTZ, B.W.; BIRKMEYER, S. Open Government: Origin, Development, and Conceptual Perspectives. International Journal of Public Administration, 2015, v. 38, n. 5, p. 381-96. WHO - WHO Coronavirus Disease (COVID-19) Dashboard. Disponível em
https://covid19.who.int/. Acessado no período de 01.06.2020 a 17.08.2020.
XIANG, Y.-T.; YANG, Y.; LI, W.; ZHANG, L.; ZHANG, Q.; CHEUNG, T. Timely mental health care for the 2019 novel coronavirus outbreak is urgently needed. The Lancet Psychiatry, 2020, 7 (3), 228–229.
Huijue Kelly Duan
https://orcid.org/0000-0002-9214-0806
Ph.D. Candidate in Accounting Information Systems Rutgers at the State University of New Jersey, USA.
E-mail: hd256@rutgers.edu
Hanxin Hu
https://orcid.org/0000-0003-4176-3832
Ph.D. student in Accounting Information Systems Rutgers at the State University of New Jersey, USA.
E-mail: hh497@scarletmail.rutgers.edu
Miklos Vasarhelyi
https://orcid.org/0000-0003-3205-476X
PhD in information systems from MIT and UCLA (USA). Head professor of KPMG at the State University of New Jersey, USA.
E-mail: miklosv@business.rutgers.edu
Fabricia Silva da Rosa
https://orcid.org/0000-0003-4212-1065
PhD in Production Engineering at the Federal University of Santa Catarina, Brazil. E-mail: fabriciasrosa@hotmail.com
Mauricio Vasconcellos Leão Lyrio
https://orcid.org/0000-0003-2024-5008
PhD in Management at the Federal University of Santa Catarina. Manager at Santa Catarina’s Government State, Brazil.