M
ESTRADO EM
C
ONTABILIDADE
, F
ISCALIDADE E
F
INANÇAS
E
MPRESARIAIS
T
RABALHO
F
INAL DE
M
ESTRADO
DISSERTAÇÃO
T
HE DIAGNOSTIC AND INTERACTIVE USES OF
MANAGEMENT CONTROL SYSTEMS IN THE
P
ORTUGUESE
FINANCIAL SERVICES INDUSTRY
–
AN EXPLORATORY
ANALYSIS
.
FLORENCE MENDES CORREIA CARP PINTO BASTO
ii
M
ESTRADO EM
C
ONTABILIDADE
, F
ISCALIDADE E
F
INANÇAS
E
MPRESARIAIS
T
RABALHO
F
INAL DE
M
ESTRADO
DISSERTAÇÃO
T
HE DIAGNOSTIC AND INTERACTIVE USES OF
MANAGEMENT CONTROL SYSTEMS IN THE
P
ORTUGUESE
FINANCIAL SERVICES INDUSTRY
–
AN EXPLORATORY
ANALYSIS
.
FLORENCE MENDES CORREIA CARP PINTO BASTO
O
RIENTAÇÃO:
MESTRE ANTÓNIO CARLOS DE OLIVEIRA SAMAGAIO
iii
ABSTRACT
The purpose of this research is to explore the relationships between perceived
environmental uncertainty (PEU), organizational structure, technology and management
control systems (MCS) diagnostic and interactive uses in the Portuguese financial
services industry. The study is built upon the Contingency Theory and the Levers of
Control framework and employs PLS-SEM to conduct the analyses on data from a
survey of 50 firms.
Results indicate that higher levels of PEU are associated with organizational
structures that are more decentralized and that exhibit a higher degree of specification
and specialization of tasks. This study also finds that higher levels of PEU are
associated with a more intense use of MCS for diagnostic and interactive purposes.
Additionally, results suggest that firms exhibiting higher centralization and lower levels
of task specification and specialization will tend to use more intensively a lower number
of MCS than more decentralized firms with higher levels of specification and
specialization of tasks. Finally, the association between technology and MCS diagnostic
and interactive uses were not found to be statistically significant.
iv
RESUMO
Este estudo teve como objectivo analisar as relações entre perceived
environmental uncertainty (PEU), estrutura organizacional, tecnologia e a utilização
diagnóstica e interactiva dos sistemas de controlo de gestão (SCG) no sector financeiro
português. O estudo é desenvolvido tendo por base a Teoria da Contingência e os
Levers of Control e utiliza PLS-SEM para realizar as análises tendo por base dados de
um inquérito realizado a 50 empresas do sector.
Os resultados indicam que níveis mais elevados de PEU estão associados a
estruturas organizacionais mais descentralizadas e com maiores níveis de especificação
e especialização de tarefas. O estudo também indica que níveis mais elevados de PEU
estão associados a uma utilização mais intensiva dos SCG de forma diagnóstica e
interactiva. Adicionalmente, os resultados sugerem que as empresas mais centralizadas
e com níveis mais baixos de especificação e especialização de tarefas tendem a utilizar
de forma mais intensiva um menor número de SCG quando comparadas com empresas
mais descentralizadas e com maiores níveis de especificação e especialização de tarefas.
Finalmente, a associação entre tecnologia e a utilização diagnóstica e interactiva dos
SCG não é suportada estatísticamente.
Palavras-chave: Portugal, sector financeiro, teoria contingencial, levers of control,
v
AKNOWLEDGEMENTS
I would like to thank my friends and family for the support and encouragement over the
past two years.
I would also like to express my sincere gratitude to my advisor, Mestre António
Samagaio, for his advice throughout the process of elaborating this dissertation.
An adequate adaptation of the questionnaire to the financial services sector would not
have been possible without the insightful contribution of Dr. Pedro Ventaneira from
Espírito Santo Investment Bank and Dr. Luís Franco from Companhia de Seguros
Tranquilidade.
Finally, I would like to thank Informa D&B for providing the list of companies
vi
TABLE OF CONTENTS
LIST OF FIGURES ... vii
LIST OF TABLES ... vii
LIST OF ABBREVIATIONS ...viii
LIST OF APPENDICES ... ix
1. INTRODUCTION ... 1
2. LITERATURE REVIEW AND HYPOTHESES DEVELOPMENT ... 4
2.1. MANAGEMENT CONTROL SYSTEMS IN THE FINANCIAL SERVICES SECTOR ... 4
2.2. LEVERS OF CONTROL FRAMEWORK ... 6
2.3. CONTINGENCY-BASED RESEARCH AND MCS ... 8
2.3.1. The relationship between PEU and Organizational Structure ... 8
2.3.2. The relationship between PEU and MCS Use ... 10
2.3.3. The relationship between Organizational Structure and MCS Use ... 11
2.3.4. The relationship between Technology and MCS Use ... 13
2.3.5. Size ... 14
3. RESEARCH METHOD ... 15
3.1. SURVEY DESIGN AND ADMINISTRATION ... 15
3.2. RESPONSE RATE AND NON-RESPONSE BIAS ... 16
3.3. RESEARCH MODEL ... 17
3.4. CONSTRUCT MEASUREMENT... 20
3.4.1. Measurement of constructs ... 20
3.4.2. Reflective Measurement Model Evaluation ... 21
3.5. DESCRIPTIVE STATISTICS OF THE VARIABLES ... 23
4. RESULTS AND DISCUSSION ... 25
5. CONCLUSIONS, LIMITATIONS AND FUTURE RESEARCH ... 30
REFERENCES ... 33
vii
LIST OF FIGURES
Figure 1 – Research model with control variables ... 19 Figure 2 – Estimated PLS path model ... 26
LIST OF TABLES
viii
LIST OF ABBREVIATIONS
ABC –Activity-based costing
ABM - Activity-based management
AVE – Average Variance Extracted
BSC –Balanced Scorecard
CRD - Capital Requirements Directive
CRR - Capital Requirements Regulation
CT – Contingency Theory
LOC – Levers of Control
LV –Latent Variable
MAS –Management Accounting Systems
MCS –Management Control Systems
MV – Manifest Variable
PEU –Perceived Environmental Uncertainty
ix
LIST OF APPENDICES
Appendix 1 – Sample Details ... 40
Appendix 2 –Respondents’ Profile ... 40
Appendix 3 - Companies Size (no. of employees) ... 40
Appendix 4 - Financial Sector Activity Description ... 41
Appendix 5 – Mann-Whitney and Median test results for two Independent Samples: comparison between the first 15 respondents and the last 15 respondents ... 42
Appendix 6 - Summary of indicators, questions, scales, anchors and source ... 43
Appendix 7 – The PLS measurement model ... 44
Appendix 8 – Cross Loadings ... 45
Appendix 9 – Latent variable correlations and square root of AVE (diagonal) ... 45
1.
INTRODUCTION
This research draws on the Contingency Theory (CT) of the firm and on Simons’
Levers of Control (LOC) framework. It represents an exploratory effort to identify the
relationships between perceived environmental uncertainty (PEU), organizational
structure, technology, and diagnostic and interactive uses of management control systems
(MCS) in the Portuguese financial services industry (e.g. commercial banks, investment
banks, cooperative banks, insurance and asset management companies, insurance
brokers).
Most of the studies on MCS have been carried out in the non-financial sector and
research conducted in the financial services industry is scant. MCS characteristics and use
has evolved throughout the past 30 years shifting from accounting systems that served
primarily the purpose of results measurement and reporting to regulators to more
sophisticated MCS used by management to assure efficiency and effectiveness in tackling
the increasing globalization and competition in the sector (Soin & Scheytt, 2008). From
the 1990’s onwards regulation has intensified in Europe as well as in the United States of
America. This was triggered by events such as the bankruptcy of Barings Bank in 1995,
the conscience that there was a high degree of interconnection between financial
institutions in different countries and the important role played by financial institutions in
the increasingly globalized economies. In the European banking context the Basel I and
Basel II Accords put forth by the Basel Committee on Banking Supervision and officially
adopted by the European Parliament and Council through Capital Requirements
Directives (CRD), and afterward transposed to national settings, have played an important
role. Basel III regulatory framework reflected in the European Union through the CRD IV
2
risk-related demands for institutions (CDR, 2011; CRR, 2011). As for the European
insurance market, Solvency Directive I focused on the capital adequacy requirements for
insurers and Solvency Directive II, expected to replace the former as of January 1st 2014,
establishes new capital requirements along with risk management standards devised for
the protection of policyholders. Recent events, such as the United States’ subprime crisis
that led to the financial crisis and recession that began in 2008, have proved the economic
importance of this sector beyond dispute.
In order to examine the relationships of interest to this study a survey on the
Portuguese financial services sector was conducted. The survey yielded 50 usable
responses, corresponding to a response rate of 12%. Data indicate that the most widely
used systems for coordinating and monitoring outcomes in relation to preset goals
(diagnostic use) are operating budgeting (66%), profitability analysis (64%), financial
performance analysis in relation to targets (48%), sales forecasting (40%), cash flow
forecasting (36%), investment budget (34%), costing systems (30%), sales objectives
systems (28%), complaints control systems (26%), and risk management systems (24%).
Respondents also indicated that profitability analysis (40%), financial performance
analysis in relation to targets (28%), customer and market development plans (28%),
benchmarking (26%), market research (24%), sales forecasting (22%), marketing policy
(22%), and development of new product and services systems (22%) were the most used
MCS for outlining new strategies (interactive use).
Partial Least Squares Structural Equation Modeling (PLS-SEM) was used for
analyzing data not only due to the small sample size but also because of the exploratory
nature of the study. The analysis of the data suggests that PEU (hostility and
unpredictability) has a positive effect on the intensity of diagnostic and interactive uses of
3
tend to use more MCS for monitoring and controlling as well as for outlining new
strategies. The present study also found a positive effect of PEU (hostility and
unpredictability) on organizational structure, meaning that higher levels of PEU are
associated with higher levels of delegation of authority (decentralization) and task
specification and specialization. As for the effect of organizational structure on MCS
diagnostic and interactive uses results suggest that the first has a negative effect on the
latter. A possible interpretation is that managers from more centralized firms, with lower
levels of task specification and specialization, tend to use more MCS for diagnostic and
interactive purposes probably due to the fact that they are using a lower number of MCS
and therefore the intensity of use of those MCS for diagnostic and interactive purposes is
higher for these firms. Technology and size effects on diagnostic and interactive uses of
MCS were not found to be significant. Additionally, alternative models suggest that the
relationships between environmental dynamism and organizational structure, MCS
diagnostic use and MCS interactive use are not statistically significant.
In a recent review of the literature on management control research in the banking
sector, Gooneratne & Hoque (2013) highlighted the need for more research using the
survey method, using multiple theories in partnership and considering the relationship
between risk management and MCS. Other authors also refer the connection between risk
management and MAS/MCS as being understudied (Soin & Collier, 2013). Thus, this
dissertation contributes to the existing literature by using the survey method and by
joining the Contingency Theory (CT) and the Levers of Control (LOC) framework as a
theoretical basis for exploring MCS use. Additionally, this study also considers risk
management systems as part of the MCS as a result of a «regulated hybridization
4
study provides cross-sectional evidence of the relationships between PEU, organizational
structure, technology, and MCS diagnostic and interactive uses.
This dissertation consists of five chapters. The following chapter provides a literature
review for the subject under study and the development of the hypotheses. The third
chapter is dedicated to the research model, sample selection and variable measurement.
Chapter 4 presents the main findings concerning the hypotheses and its discussion. The
final chapter brings forward the conclusions of the study, its limitations, and suggests
fields for future research.
2.
LITERATURE REVIEW AND HYPOTHESES DEVELOPMENT
There are several definitions of MCS in the literature. One of the first definitions was
provided by Anthony (1965, p. 27) as «the process by which managers ensure that
resources are obtained and used effectively and efficiently in the achievement of the
organization’s objectives». Several other authors elaborated on this seminal view of MCS
either by introducing a more technical point of view, by emphasizing its behavioral
aspects or by viewing them as socially constructed phenomena (Gooneratne & Hoque,
2013). Recently, Gooneratne & Hoque (2013) proposed a definition that encompasses
most of the aspects previously mentioned: MCS are defined as «the formal organizational
systems designed and implemented by management to ensure that organizational goals
are achieved».
2.1. MANAGEMENT CONTROL SYSTEMS IN THE FINANCIAL SERVICES SECTOR
Research on MCS in the financial services sector has covered a wide range of
5
Scheytt, 2008) are useful in understanding the global evolution of the industry and the
factors that triggered the changes in MCS use. Research on planning practices address
issues such as strategic/long-range planning (e.g. Gup & Whitehead, 1989; Kudla, 1982;
Sokol, 1993; Wood Jr., 1980) and the link between corporate planning and shorter term
budgeting (Dugdale, 1978). Vast research on based costing (ABC) and
activity-based management (ABM) has been conducted. Innes & Mitchell (1997) studied ABC’s
adoption among British largest financial institutions (banks, building societies,
insurance/investment organizations) and found it to be relatively late but enthusiastic
(54% of respondents were applying ABC). Revell et al. (2003) contributed with insights
on implementation and benefits of ABC systems based on two US case studies and
Sweeney & Mays (1997) found that activity-based management had a positive impact on
corporate performance in the case study of a US regional bank holding company. The
relationship between ABC and organizational change was the focus of several studies
(Soin, 1996; Soin et al., 2002; Vieira & Hoskin, 2005) mainly through case study
analysis. Kocaküläh and Crowe (2005) studied the relationship between ABC and loan
portfolio profitability and Norris (2002) examined the introduction and usage of
activity-based information in two British banks. Performance measurement systems were widely
researched. The use of non-financial measures was vigorously explored (Hussain, 2003;
Hussain, 2005; Hussain & Gunasekaran, 2002; Hussain et al., 2002) revealing a more
intense use of financial measures in detriment of non-financial measures. Also
performance measurement practices were studied (McNamara & Mong, 2005; Hussain &
Hoque, 2002; Zineldin & Bredenlow, 2001). Hussain & Hoque (2002)’s case studies of
four Japanese banks indicate that several institutional forces (economic constraints,
central bank's regulatory control, accounting standards/financial legislation,
6
implement a particular performance measurement system, being economic constraints the
most significant. Ittner et al. (2003)’s findings suggest that firms using a broader set of
financial and non-financial measures strategic performance measurement systems achieve
higher performances. Other research topics include the balanced scorecard (Aranda &
Arellano, 2010; Davis & Albright, 2004), budgetary control systems (Lau & Tan, 1998),
profitability reporting (Helliar et al., 2002); evolution of internal measurements and its
relationship with accounting regulations (Barretta & Riccaboni, 1998), management
accounting systems (MAS) and risk management (Bhimani, 2009; Huber & Scheytt,
2013; Siti Zaleha et al., 2011; Soin & Collier, 2013), and MAS and organizational change
(Cobb et al., 1995; Euske & Riccaboni, 1999;Guerreiro et al., 2006;Middaugh, 1998). In
light of the contingency theory, Lenz (1980) concluded that combinations of environment,
strategy and organizational structure of high-performance firms differed from
combinations associated with low-performance firms. Finally, Mundy (2010) analyzed a
case study with the levers of control framework and found that managers attempt to
balance «controlling and enabling uses» of MCS in order to manage organizational
conflicts and to generate dynamic tensions.
Based on the above literature review, one may conclude that there is a significant
absence of research, in the financial services industry, analyzing the relationships between
the variables under study. Therefore, the present work is exploratory in nature.
2.2. LEVERS OF CONTROL FRAMEWORK
There are four types of MCS that together work as levers of control (LOC): beliefs
7
which should be balanced in order to implement strategy effectively (Simons, 1994, 1995,
2000).
Beliefs systems are used by managers to formally «define, communicate and
reinforce values, purpose and direction for the organization» (Simons, 1994, p. 170) (e.g.
mission statement, vision and credos). Core values are broad in nature since they should
appeal to everyone working in the organization and are only effective when employees
believe that they represent real «rooted values». The top management’s behavior is of
extreme importance to this end since their actions contribute toward making these values
meaningful (Simons, 1995, 2000). Mission statements and credos give employees a
«sense of pride and purpose» (Simons, 2000).
Boundary systems serve as a means of avoiding risks by establishing limits and
enforcing rules (e.g. codes of conduct, strategic planning systems, operating directives).
Establishing clearly «what not to do» is, according to Simons (2000), the best way to limit
employees’ actions without hampering creativity and innovation. Codes of conduct, for
example, are needed to ensure ethical behavior and may be extremely valuable in
organizations where trust is a fundamental value for doing business. As for strategic
planning it plays a pivotal role in restricting actions in areas that turn away from the
organization’s strategic goals and that may impair performance. Therefore, beliefs
systems and boundary systems work together as «the yin and yang» of Chinese
philosophy that «create a dynamic tension» between «commitment and punishment»
(Simons, 1995).
Diagnostic control systems suit the purpose of monitoring critical variables, such as
revenue growth and market share, and enable organizations to identify and interpret
8
allow management to monitor situations of inappropriate goal setting and inability to
achieve goals due to unexpected changes (Simons, 2000).
Finally, interactive control systems are formal systems used by top management to
get involved regularly and personally in the decisions of their subordinates in order to
focus attention on strategic uncertainties (e.g. technology, regulation and competition), to
excite dialog and organizational learning which, in turn, originate proactive responses,
such as, the development of emergent strategies (Simons, 1995). The establishment of
regular meetings with subordinates to discuss main issues is an example of this type of
MCS.
2.3. CONTINGENCY-BASED RESEARCH AND MCS
The contingency-based approach on MCS emphasizes the idea that MCS are
implemented in order to assist managers achieve the desired organizational objectives and
that MCS design is influenced by the context in which the company operates (Chenhall,
2007). Several studies have examined the relationship between MCS and a number of
contextual variables, such as the external environment, organizational structure,
technology and size (Chenhall, 2007), which will be further analyzed.
2.3.1. The relationship between PEU and Organizational Structure
Khandwalla (1977) presents the environment as exerting pressures on the
organizations in the form of «constraints, contingencies, opportunities and problems».
The author identifies in the external environment five attributes which impact the
organizations’ structure and strategy: turbulence (dynamism and unpredictability),
hostility (intensity of competition), diversity, complexity (technology) and restrictiveness
9
two environmental dimensions, the simple-complex dimension (homogeneity or
heterogeneity of the factors) and the static-dynamic dimension (changes in the factors
over time), and found that a dynamic-complex environment leads to the greatest amount
of uncertainty in decision making.
Previous studies have focused on understanding the most adequate organizational
structure in relation to environmental uncertainty. According to Chenhall (2007),
organizational structure is the way roles of organizational members and tasks for groups
are formally specified to ensure that the activities of the organization are carried out.
Several definitions of organizational structure have been proposed focusing on different
dimensions such as differentiation and integration (Lawrence & Lorsch, 1967),
mechanistic and organic system (Burns & Stalker, 1961), bureaucratic and
non-bureaucratic type (Perrow, 1970). One of the most adopted typologies in research is the
one put forward by Burns & Stalker (1961). According to these authors, in a mechanistic
system tasks and roles are highly defined and the structure of control, authority and
communication is highly hierarchical. Instead, an organic form of organization is
characterized by higher flexibility and adaptability of tasks and a network structure of
control, authority and communication. Burns & Stalker (1961) suggested that an organic
structure would better fit an organization in a changing environment and research
conducted in the non-financial sector found a positive association between the
competitive environment and a more organic organizational structure (Baines &
Langfield-Smith, 2003; Chenhall, 2007; Gordon & Naranayan, 1984; Khandwalla,
1972a). On the other hand, some authors argue that the lack of organizational structure, as
in the situation of a pure organic type, may result in role ambiguity and uncertainty,
which may hamper organizational and individual action. These authors advocate that the
10
making (Sine et al., 2006). Research conducted indicates that new ventures in turbulent
and emergent economic sectors with higher formalization and specialization of roles
outperform those with more organic structures (Sine et al., 2006) and that mechanistic
structures are successful in coping with change when these changes are more technical
and structural in nature (Waldersee et al., 2003). Thus, the formalization of roles may also
be important in responding to change. Therefore, organizational structure in the financial
services industry should be viewed as a blend of two traits: delegation of authority and
task specification/specialization since some degree of delegation of authority and some
degree of task specification/specialization may be needed for coping with uncertainty.
Therefore, the following hypothesis is proposed:
H1: PEU is positively associated with Organizational Structure in the financial
services industry.
2.3.2. The relationship between PEU and MCS Use
Environmental hostility (intensity of competition) has been associated with the use of
sophisticated management controls (Khandwalla, 1972b). As for environmental
complexity (when derived from suppliers and government), it has been associated with
reduced emphasis on budgets (Brownell, 1985). Environmental dynamism and
unpredictability have been negatively associated with the extent of use of written budgets
(King et al., 2010). Additionally, evidence has been collected regarding the combination
of tight controls and more open, informal, flexible and interactive systems in
organizations (Ahrens & Chapman, 2004; Chapman, 1998; Chenhall, 2007; Ezzamel,
1990; Merchant, 1990; Simons, 1987). This appears to add up when considering that
11
from interactive systems is ultimately incorporated in the goals monitored by diagnostic
systems (Simons, 2000; Widener, 2007). Despite the fact that most of these studies were
carried out in the non-financial sector, there is evidence of the influence of the changing
environment on MCS use in the financial services sector (e.g. Cobb et al., 1995; Euske &
Riccaboni, 1999; Helliar et al., 2002; Soin, 1996; Vieira & Hoskin, 2005). It is vastly
documented that increasing regulation and competition has contributed to the
development of more sophisticated MCS in this industry. Thus it may be reasonable to
assume that changes in the environmental setting have contributed to both a more intense
diagnostic and interactive use of MCS in the financial services industry despite the lack of
research on this issue.
Therefore, the following hypotheses are proposed:
H2a: PEU is positively associated with the intensity of MCS Diagnostic Use in the
financial services industry.
H2b: PEU is positively associated with the intensity of MCS Interactive Use in the
financial services industry.
2.3.3. The relationship between Organizational Structure and MCS Use
Large and decentralized firms, with sophisticated technologies, have been associated
with an emphasis on formal MCS (Bruns & Waterhouse, 1975); and larger, diverse, more
decentralized firms, were found to use more formal and sophisticated budgeting practices
while smaller, more centralized firms tended to rely more on direct supervision and more
frequent personal interaction and less on formal budgets (Merchant, 1981). Khandwalla
(1972b, 1977) found that large decentralized firms used sophisticated controls along with
12
et al. (1995) found an association between decentralization and participative budgeting.
Organic structures (higher decentralization and lower task specification) have been found
to be associated with broad scope and future-oriented information (Gordon & Narayanan,
1984).
Studies conducted in the financial services industry suggest that changes in the
environment have led to adjustments in strategy, organizational structure and MCS (e.g.
Euske & Riccaboni, 1999; Vieira & Hoskin, 2005) but research studies directly relating
organizational structure and MCS diagnostic and interactive use are lacking. For the
financial services firms, it may be reasonable to assume that a more centralized
organization, and characterized by a low degree of specification and specialization of
tasks, will need to use a smaller number of MCS. Additionally, one may expect that these
firms use MCS diagnostically and interactively in a relatively intense way since they are
not using many MCS. On the other hand, a more decentralized organization, and with
high levels of specification and specialization of tasks, will most probably use a
considerable number of MCS and exhibit a lower intensity in the use of MCS for
diagnostic and interactive purposes when compared to the first type of firms.
Therefore, the following hypotheses are proposed:
H3a: Organizational Structure is negatively associated with the intensity of MCS
Diagnostic use in the financial services industry.
H3b: Organizational Structure is negatively associated with the intensity of MCS
13
2.3.4. The relationship between Technology and MCS Use
Technology is defined as the processes organizations use to translate resources
(hardware, software, materials, human resources and knowledge) into output and is
usually analyzed in MCS research regarding three characteristics: process
automation/standardization, task uncertainty and interdependence (Chenhall, 2007).
Theoretically, standardized/automated processes are linked to more formal MCS
(Khandwalla, 1977), high budget use (Merchant, 1984), high budgetary controls (Dunk,
1992) and less budgetary slack (Merchant, 1985).
Task uncertainty (in terms of difficulty, analyzability and/or variability) has been
associated with more informal controls (Chenhall, 2007), high reliance on standard
operating procedures, programs and plans (Daft & Macintosh, 1981), and broad scope
information (Mia & Chenhall, 1994). Research conducted on the services sector by
Auzair & Langfield-Smith (2005) found that professional service firms (e.g. corporate
banking) place greater emphasis on less bureaucratic forms of MCS (informal, flexible
and interpersonal controls) than mass service firms. This is attributed by the authors to a
higher task uncertainty in professional services firms due to greater human involvement
in the processes. Additionally, Lau & Tan (1998) advocate that the financial services
industry’s task difficulty levels are expected to be higher in comparison to manufacturing
and merchandising sectors which they attribute to the diversity and complexity of services
offered. They find that high budgetary participation is associated with improved
managerial performance in high task difficulty situations.
Finally, low levels of interdependence have been associated with budgets, operating
14
interdependence was associated with broad (narrow) scope MCS (Chenhall & Morris,
1986).
In the financial services industry research studies directly relating technology and
MCS diagnostic and interactive uses are lacking. It may be reasonable to assume that
firms exhibiting lower levels of task uncertainty, higher levels of process standardization
and automation and of interdependence will use MCS diagnostically more intensively. On
the other hand, firms exhibiting higher levels of task uncertainty, lower levels of process
standardization and automation and of interdependence will engage in a more interactive
use of MCS.
Therefore, the following hypotheses are proposed:
H4a: Technology is positively associated with the intensity of MCS Diagnostic use
in the financial services industry.
H4b: Technology is negatively associated with the intensity of MCS Interactive use
in the financial services industry.
2.3.5. Size
According to Chenhall (2007), large organizations have been associated with more
diversified operations, formalization of procedures and specialization of functions, and an
emphasis on and participation in budgets and sophisticated controls. Therefore it is
expected that as firms grow and become more complex to manage its organizational
structures become more decentralized and exhibit higher levels of task specification and
specialization. It is also expected that larger organizations will use a higher number of
MCS and therefore that the intensity of use of these systems for diagnostic and interactive
purposes might be different between larger and smaller firms. Therefore, this variable was
15
3. RESEARCH METHOD
3.1. SURVEY DESIGN AND ADMINISTRATION
In order to examine the relationships between PEU, organizational structure,
technology, and MCS diagnostic and interactive uses in the Portuguese financial services
sector, a survey was conducted. The survey consisted of 44 questions based on literature
review and adapted to the financial services sector through meetings with the directors of
the management control departments of Banco Espírito Santo de Investimento
(Investment Banking) and Companhia de Seguros Tranquilidade (Insurance). Since this
study is part of a larger research project, only 11 of the 44 questions were used.
The list of companies was supplied by Informa D&B, a company specialized in the
collection of corporate information, but only data for the small and medium-sized
companies (having 10 or more and less than 250 employees) were obtained. The larger
companies were identified through information supplied by the Bank of Portugal
(Portuguese banking regulator) and Instituto de Seguros de Portugal (Portuguese
insurance regulator). The resulting target population consisted of 800 companies. Due to
the fact that some of them were part of the same group of companies, were extinct, were
not possible to reach (the telephone number was invalid and no additional information
was available in the internet), or did not wish to participate in the study, the number of
usable companies was brought down to 423. Phone-calls were made to every company in
order to obtain the name and e-mail of the most qualified person to answer the survey
(usually a Board member, CEO, CFO or controller). However, many companies did not
supply the most adequate information and only an institutional e-mail was obtained,
16
The survey was administered by e-mail. E-mails enclosed a cover letter, since it is
documented as contributing to higher response rates (Dillman, 2000; Schaefer & Dillman,
1998), and a link to the online survey. The cover letter described the confidentiality and
purpose of the study and indicated that participants would have access to the results of the
study, be invited to a results’ presentation session and be eligible to participate in the
draw of 8 vouchers with values ranging from € 24.90 to € 89.90. Participants were
informed that completion of the questionnaire would take not more than 10 to 20 minutes.
Follow-ups were used with the objective of increasing the response rate since they have
been reported as contributing to that end, both in mail and online surveys (Dillman, 2000;
Schaefer & Dillman, 1998). Additional phone calls were made to companies highlighting
the importance of participating in the study and several reminders were sent by e-mail.
3.2. RESPONSE RATE AND NON-RESPONSE BIAS
In total, 60 questionnaires were completed. Data was analyzed for straight lining and
for the proportion of missing responses for a single construct which resulted in the
removal of 10 observations from the data file. The reason for having such a high
proportion of unusable responses may be attributed to the length of the questionnaire and
the inclusion of the option of not answering or not knowing the answer to the questions.
The final sample size consisted of 50 observations yielding a 12% response rate
consistent with the response rate of less than 20% reported in several recent studies (e.g.
Baines & Langfield-Smith, 2003; Widener, 2007). Sample’s details, respondents’ profile,
sample companies’ size (measured by the number of employees) and type of activity are
summarized in appendices 1, 2, 3 and 4, respectively.
To test for non-response bias, respondents were compared from the first 15
17
showed that overall there were no significant differences between the distributions and
medians of the two groups. The exceptions were items measuring Technology which
exhibited significant differences. Results of the Mann-Whitney and Median tests are
presented in appendix 5.
3.3. RESEARCH MODEL
Data were analyzed using PLS-SEM with SmartPLS 2.0 software (Ringle et al.,
2005). PLS-SEM is considered a second-generation technique and is primarily used to
develop theories in exploratory research (Hair et al., 2013; Gefen et al., 2011). By
estimating iteratively and simultaneously the measurement and structural models
PLS-SEM allows for a better estimation process in comparison to first-generation modeling
techniques such as principal components analysis, factor analysis, discriminant analysis
or multiple regression (Gefen et al., 2011; Lee et al., 2011; Chin et al., 2008).
Additionally, the method generally achieves high levels of statistical power with small
samples (Hair et al., 2013). The minimum sample size for PLS path model estimation
should, according to the 10 times «rule of thumb» (Hair et al., 2013; Barclay, Higgins &
Thompson, 1995), be equal to the larger of: (1) 10 times the largest number of formative
indicators used to measure a single construct; or (2) 10 times the largest number of
structural paths directed at a particular construct in the structural model (Hair et al.,
2013). Another characteristic of PLS-SEM is that it is a non-parametric method thus
making no data distributional assumptions and works with a variety of measurement
scales (e.g. metric, ordinal scaled data and binary coded variables).
The PLS path model is formed by two models: (1) a measurement model that relates
the manifest variables or indicators to their respective latent variables and (2) a structural
18
reflective or formative. A reflective measurement model was chosen for all of the
constructs since it was considered that the indicator items are manifestations of the
underlying constructs, following the guidelines proposed by Hair et al. (2013, p. 47,
exhibit 2.9). Therefore, it is expected that indicators of a construct are highly correlated,
are interchangeable and that one of them can be left out without changing the meaning of
the construct as long as the construct has sufficient reliability (Hair et al., 2013).
In the reflective measurement model, each manifest variable (xpq) reflects its latent
variable (Yq) and they are related by a simple regression:
(1) Xpq = λp0 + λpqYq + εpq
where λpq represents the loading associated with the p-th manifest variable in relation to
the q-th latent variable and εpq indicates the measurement error for the p-th manifest
variable.
The structural model may be written as:
(2) Yj = β0j + Σβqj Yq + ζpq q:ξq→ξj
where ξj represents each of the endogenous latent variables, βqj is the path coefficient
relating the q-th exogenous latent variable and the j-th endogenous latent variable and ζpq
is the error term in the inner relation.
19
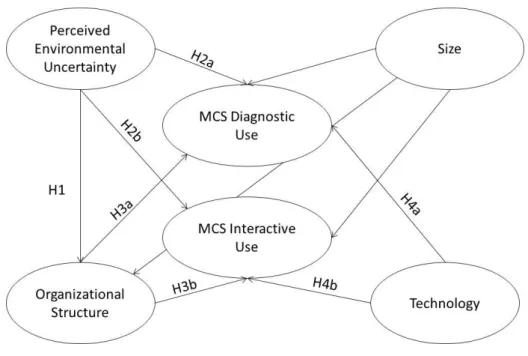
Figure 1 – Research model with control variables
In the present structural model the maximum number of paths directed at a latent
variable is 4 indicating that 40 is the minimum number of observations needed to estimate
the path model according to the previously mentioned «rule of thumb».
Hair et al. (2013)’s suggestions regarding missing value treatment, algorithm and
bootstrapping settings were followed. Missing data was handled through mean value
replacement since there were less than 5% values missing per indicator. When running
the algorithm, the selected weighting scheme for inner weights estimation was the path
weighting scheme and the chosen data metric was standardized data (Mean 0, Var 1). The
stop criterion was set at 1.10-5 and the maximum number of interactions at 300. Initial
weights were set at the default value of 1.0. Bootstrapping procedures were conducted
with the no sign changes option, 50 cases (equal to the number of observations in the
20
3.4. CONSTRUCT MEASUREMENT
3.4.1. Measurement of constructs
A literature review was conducted to identify existing measurement scales for the
constructs under study. Additionally, as previously mentioned, they were subject to
validation by the directors of the management control departments of 2 firms operating in
the Portuguese financial services sector.
Appendix 6 presents a summary of the items included in the questionnaire for
constructs PEU, Structure and Technology, the scales and the source. The questions
relating to the measurement of PEU, aiming to assess unpredictability, hostility and
dynamism, were drawn from Gordon & Narayanan (1984). The ones used for assessing
Organizational Structure, in terms of delegation of authority and task specification and
specialization, were derived from Gordon & Narayanan (1984) and King et al. (2010).
Technology was measured by questions adapted from Chenhall (2007). The validation of
the measurement model led to the reduction of the number of indicators used per variable.
PEU was ultimately measured by 4 indicators: the degree of predictability in competitor’s
actions, degree of predictability of customers' preferences and tastes, the intensity of
competition in the diversity of marketed products/services and the intensity of
competition in accessing human resources. Structure was measured by 4 items: the degree
of delegation of authority in budgeting and pricing decisions, the specification of tasks
and the specialization of tasks. Technology was measured by 3 indicators: degree of task
uncertainty (reversed score), degree of process standardization and automation, and
degree of process interdependency.
MCS Use was measured by 3 questions which aimed to reflect the intensity of MCS
21
respondents were asked to select the MCS used or implemented in the organization on the
basis of a list of 47 commonly used MCS in the financial services sector. Respondents
were asked to indicate, of the previously selected MCS, which were used to coordinate
and monitor the organization’s outcomes and correct deviations in relation to preset goals
(diagnostic use) and which were used to stimulate and guide the emergence of new
strategies (interactive use). Thus, MCS Diagnostic (Interactive) Use construct was
measured by dividing the number of MCS used for diagnostic (interactive) purposes by
the total number of MCS used by the organization. The resulting scale ranged from 0 to 1.
Size was measured by the natural logarithm of the number of employees supplied by
Informa D&B Database, Instituto de Seguros de Portugal (Portuguese insurance
regulator) and Associação Portuguesa de Bancos (a Portuguese banking association).
3.4.2. Reflective Measurement Model Evaluation
Indicator Reliability, Internal Consistency Reliability and Convergent Validity
Indicator reliability is achieved when indicators’ outer loadings are greater than 0.708
meaning that the corresponding latent variable explains at least 50% of the indicator’s
variance. However, indicators with weaker outer loadings (between 0.40 and 0.70) may
be retained subject to examination of item removal on composite reliability and average
variance extracted (AVE) as well as on construct’s content validity. Additionally, all
outer loadings should be statistically significant (Hair et al., 2013).
Internal consistency reliability refers to the degree items are free from random error
and therefore to the consistency of the scale. For measuring internal consistency,
composite reliability was used instead of Cronbach’s alpha because the first takes into
22
same importance. This fact makes composite reliability a more adequate measure of
internal consistency since in PLS-SEM the more reliable indicators play a stronger role in
the model. Composite reliability values of 0.70 are necessary to establish internal
consistency reliability for the constructs but values above 0.90 are not desirable because
they indicate that all indicators are measuring the same phenomenon and are unlikely to
be a valid measure of the construct (Hair et al., 2013).
Finally, convergent validity is the extent to which a measure correlates positively
with alternative measures of the same construct and is assured when AVE’s for each
construct are above 0.50, meaning that at least 50% of the measurement variance is
captured by the latent variables and therefore the set of indicators represent the same
underlying construct (Henseler et al., 2009).
After running the algorithm, only 7 of the indicators’ outer loadings were above the
threshold value of 0.70, 10 presented outer loadings between 0.40 and 0.70 and 4 had
values below 0.40. Following Hair et al. (2013)’s recommendations, the 4 indicators with
outer loadings below 0.40 were eliminated from the model. After removing these 4
indicators, composite reliability was above threshold value of 0.70 for the three latent
variables (PEU: 0.813; Structure: 0.817; Technology: 0.800) but AVE was below the
threshold value of 0.50 for PEU and Structure (PEU: 0.391; Structure: 0.398;
Technology: 0.576).
According to Hair et al. (2013), indicators with outer loadings between 0.40 and 0.70
should be considered for removal from the scale only when deletion of the indicator(s)
leads to an increase in composite reliability and/or AVE above threshold values.
Therefore, 6 additional indicators had to be removed to obtain convergent validity. The
remaining 11 indicators (4 for PEU, 4 for Structure and 3 for Technology) were tested for
23
significance level for each indicator and all of them were statistically significant at a 10
per cent level (p-value < 0.10). Even though 1 item presents a low loading (degree of
delegated authority in budgeting: 0.458 < 0.50) this item was retained in order to
guarantee content validity.
Appendix 7 summarizes the results of the measurement model evaluation in terms of
indicator reliability, composite reliability, convergent validity and significance of
indicator’s loadings.
Discriminant validity
Discriminant validity is the extent to which two constructs that are conceptually
different from each other exhibit sufficient difference (Henseler et al., 2009). The
analyses of cross loadings and the Fornell-Larcker criterion were conducted in order to
check for discriminant validity. The analysis of cross loadings shows that each indicator’s
loading on a construct is higher than all of its cross loadings with other constructs, as
required. Additional support for convergent validity is obtained by the Fornell-Larcker
criterion since the square root of the AVE of each construct is higher than any of the
construct’s correlation with any other construct. Appendices 8 and 9 present the cross
loadings and the latent variable correlations and the square root of AVE (diagonal),
respectively.
Thus, overall the measurement model is adequate in terms of indicator reliability,
internal consistency, convergent validity and discriminant validity.
3.5. DESCRIPTIVE STATISTICS OF THE VARIABLES
Descriptive statistics are summarized in appendix 10. Mean values for items
24
exhibit relatively low levels of decentralization (below 4). Task specification and
specialization appear to be relatively high (above 4) since mean values range from 4.60 to
5.00. This indicates a tendency for organizational structures in this industry to
approximate to the mechanistic type. Mean values for items measuring unpredictability
range from 3.77 to 3.96 meaning that the environment is assessed as being relatively
predictable. Items measuring hostility (intensity of competition) present mean values
ranging from 2.80 to 5.34. Analysis of the individual mean values indicates that the
competitive environment is mainly influenced by decisions regarding pricing and the
diversity of products and services offered by the firms. As for the assessment of the
company’s external environment (dynamism), mean values, ranging from 3.98 to 5.50,
indicate that the legal and technological environments are viewed as being less dynamic
than economic and political environments. Finally, task uncertainty was assessed by the
respondents as being relatively low (mean value of 2.5). Degrees of process
interdependency and process standardization and automation present similar mean values
of 4.16 and 4.82, respectively. Finally, MCS diagnostic use exhibits higher mean and
median values than MCS interactive use thus indicating the more intense use of MCS for
coordination and monitoring purposes in comparison to MCS being used for outlining
new strategies.
Assessment of skewness and kurtosis showed that 3 indicators used in the final
measurement model exhibited significant non-normality (z-values > 1.96): Degree of task
uncertainty, Size, MCS diagnostic use and MCS interactive use. This analysis is useful
since extremely non-normal data inflate standard errors obtained from bootstrapping thus
25
4. RESULTS AND DISCUSSION
The latent variable scores were extracted and assessed for collinearity using IBM
SPSS Statistics 20 software. By running a multiple regression with PEU, Structure,
Technology and Size as independent variables and MCS Diagnostic Use (or MCS
Interactive Use) as dependent variable the results were variance inflation factor (VIF)
values below 5 (PEU: 1.566; Structure: 1.855; Technology: 1.581 and Size: 1.097)
indicating that collinearity is not an issue in the structural model (Hair et al., 2013).
The R2 values obtained for the endogenous latent variables are considered weak for
MCS Diagnostic Use (R2 = 0.159) and MCS Interactive Use (R2 = 0.176) and weak to
moderate for Structure (R2 = 0.363) (Henseler et al., 2009). Despite that, the R2 values are
all above 0.10 thus assuring that the variance explained by the endogenous variables has
practical and statistical significance (Lee et al., 2011).
The structural model path coefficients significance was assessed through
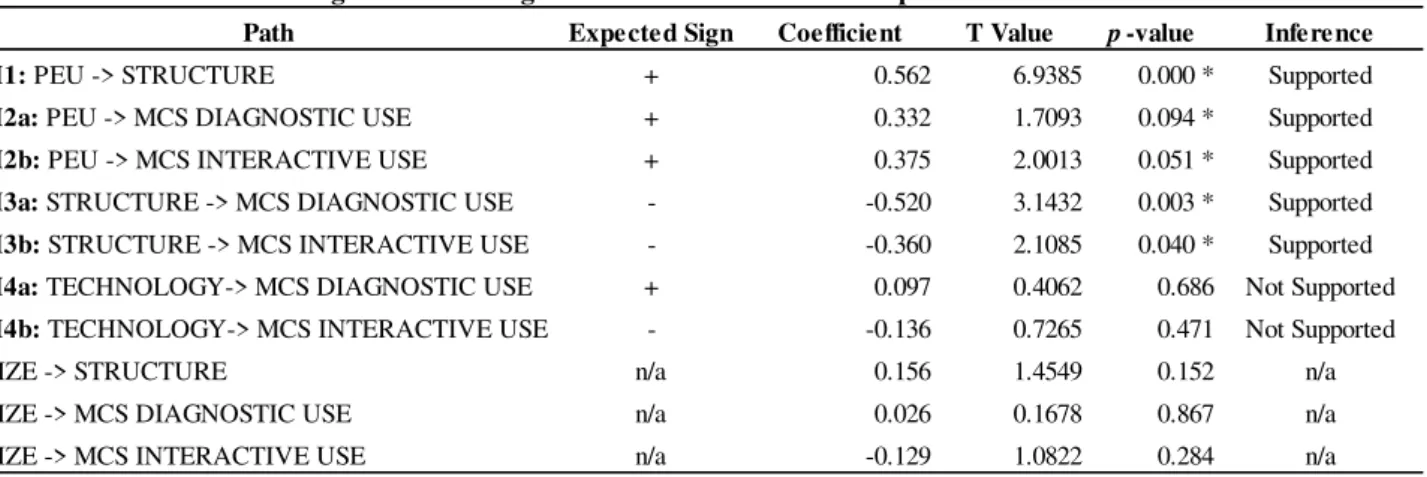
bootstrapping. Table 1 summarizes the significance testing results of the path coefficients.
Table 1 – Significance testing results of the structural model path coefficients
Path Expected Sign Coefficient T Value p-value Inference
H1: PEU -> STRUCTURE + 0.562 6.9385 0.000 * Supported
H2a: PEU -> MCS DIAGNOSTIC USE + 0.332 1.7093 0.094 * Supported
H2b: PEU -> MCS INTERACTIVE USE + 0.375 2.0013 0.051 * Supported
H3a: STRUCTURE -> MCS DIAGNOSTIC USE - -0.520 3.1432 0.003 * Supported
H3b: STRUCTURE -> MCS INTERACTIVE USE - -0.360 2.1085 0.040 * Supported
H4a: TECHNOLOGY-> MCS DIAGNOSTIC USE + 0.097 0.4062 0.686 Not Supported
H4b: TECHNOLOGY-> MCS INTERACTIVE USE - -0.136 0.7265 0.471 Not Supported
SIZE -> STRUCTURE n/a 0.156 1.4549 0.152 n/a
SIZE -> MCS DIAGNOSTIC USE n/a 0.026 0.1678 0.867 n/a
SIZE -> MCS INTERACTIVE USE n/a -0.129 1.0822 0.284 n/a
Note: * Significant path coefficient at p-value < 0.10 (two-tailed).
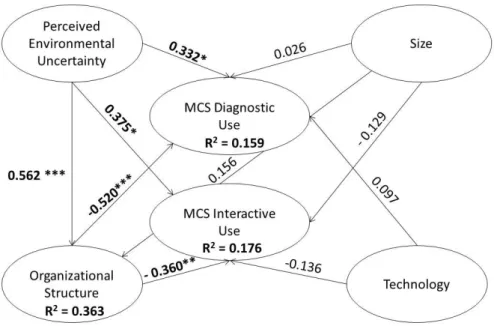
26 The estimated path model is depicted in Fig. 2.
Figure 2 – Estimated PLS path model
The results indicate that PEU is positively associated with organizational structure
thus supporting hypothesis H1 (p-value < 0.01). PEU was measured by 2 items measuring
unpredictability and 2 items measuring hostility (intensity in competition) in the external
environment. Organizational structure was measured by the degree of delegated authority
in budgeting and pricing decisions, and by the degrees of task specification and
specialization. The findings of the present study indicate decentralization and
specification and specialization of tasks working together as means of coping with higher
uncertainties of the external environment (path coefficient = 0.562). The results differ
27
environment to a more organic organization structure (e.g. Khandwalla, 1972a) thus
highlighting the specific nature of the financial services industry.
There is also a positive significant association between PEU and MCS diagnostic and
interactive uses which supports H2a (p-value < 0.10) and H2b (p-value < 0.10). These
results are consistent with the findings from previous studies carried out in the
non-financial sector indicating a positive association between PEU and MCS use (e.g. King et
al., 2010). Additionally, they are in line with Mundy (2010)’s conclusions regarding the
existence of a close relationship between diagnostic and interactive uses of MCS drawn
from a financial services firm case study. Therefore results suggest that when facing
higher environmental uncertainties financial services’ firms tend to use more intensively
MCS for coordinating and monitoring outcomes (path coefficient = 0.332) as well as for
outlining new strategies (path coefficient = 0.375) in a balanced way.
Additionally, the present study found a statistically significant negative association
between organizational structure and MCS diagnostic and interactive uses thus supporting
hypothesis H3a (path coefficient = 0.520; p-value < 0.01) and H3b (path coefficient =
0.360; p-value < 0.05). Results suggest that firms exhibiting higher centralization and
lower levels of task specification and specialization will tend to use more intensively a
lower number of MCS than more decentralized firms with higher levels of specification
and specialization of tasks.
The hypotheses of technology being positively associated with MCS diagnostic use
(H4a) and negatively associated with MCS interactive use (H4b) are not supported since
path coefficients are not statistically significant despite the resulting signs of the path
coefficients being consistent with the hypotheses. These findings are not in line with the
28
uncertainty and higher (lower) levels of process standardization will use MCS
diagnostically (interactively) more intensively.
The analysis did not support a significant association between Size, measured by the
natural logarithm of the number of employees, and organizational structure. The
coefficient is positive, as expected, but not significant. Previous studies have suggested
Size to be associated with more decentralized structures, with higher formalization of
procedures, and the specialization of functions (Chenhall, 2007). The expected influence
of Size on MCS use was also not supported by the results.
Additionally, the f2 effect size analysis was conducted in order to assess the change in
the R2 value when an exogenous construct is omitted from the model. Guidelines for
assessing f2 indicate values of 0.02, 0.15 and 0.35 as corresponding to small, medium and
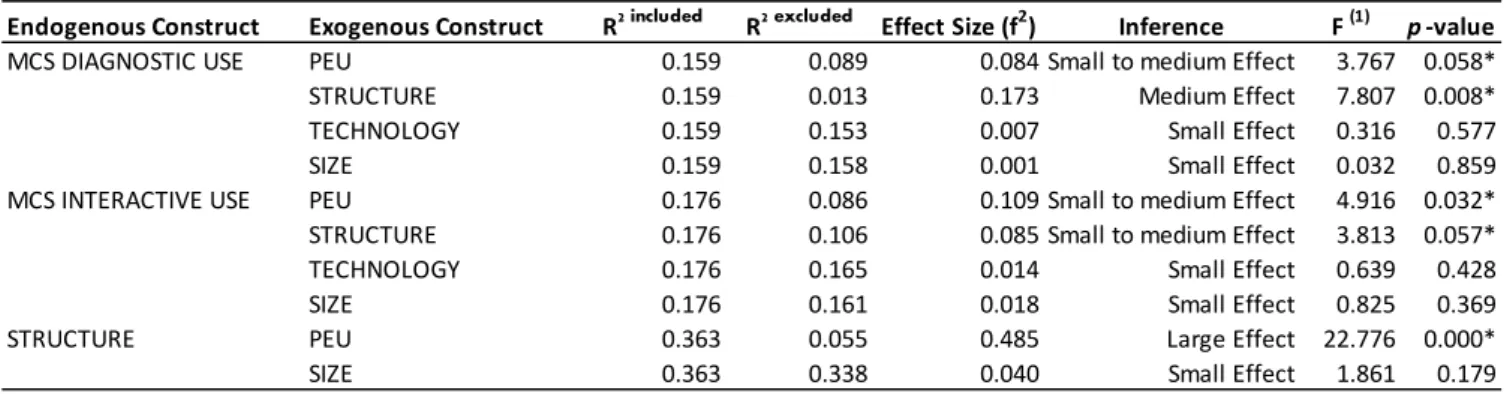
large effects, respectively (Hair et al., 2013). Table 2 summarizes the significance testing
results of the f2 effect size analysis. PEU has significant small to medium effect sizes on
MCS Diagnostic Use (p-value < 0.10) and MCS Interactive Use (p-value < 0.05), and a
significant large effect size on Structure (p-value < 0.01). Structure has a significant
medium effect on MCS Diagnostic Use (p-value < 0.01) and a significant small to
medium effect on MCS Interactive Use (p-value < 0.05).
Table 2 – Significance testing results of the f2 effect size analysis
Endogenous Construct Exogenous Construct R2 included R2 excluded Effect Size (f2) Inference F (1) p-value
MCS DIAGNOSTIC USE PEU 0.159 0.089 0.084 Small to medium Effect 3.767 0.058*
STRUCTURE 0.159 0.013 0.173 Medium Effect 7.807 0.008*
TECHNOLOGY 0.159 0.153 0.007 Small Effect 0.316 0.577
SIZE 0.159 0.158 0.001 Small Effect 0.032 0.859
MCS INTERACTIVE USE PEU 0.176 0.086 0.109 Small to medium Effect 4.916 0.032*
STRUCTURE 0.176 0.106 0.085 Small to medium Effect 3.813 0.057*
TECHNOLOGY 0.176 0.165 0.014 Small Effect 0.639 0.428
SIZE 0.176 0.161 0.018 Small Effect 0.825 0.369
STRUCTURE PEU 0.363 0.055 0.485 Large Effect 22.776 0.000*
SIZE 0.363 0.338 0.040 Small Effect 1.861 0.179
* Significant effect at p-value < 0.10.
29
Alternative structural models were tested and were compared on the basis of
adjusted R2. In one of those models environmental dynamism (measured by the
assessment of the company’s economic, legal and technological environment) was
introduced and Size was removed (due to limitation of the small sample size). This model
suggested that dynamism had a negative impact on MCS Diagnostic Use (path coefficient
= - 0.234) and positive impacts on MCS Interactive Use (path coefficient = 0.021) and
Structure (path coefficient = 0.151). However, these relationships were not found to be
statistically significant (p-values > 0.10). Additionally, in this alternative model
specification, the signs and statistical significance of relationships between the construct
measuring hostility and unpredictability, and Structure, MCS Diagnostic Use and MCS
Interactive Use remained unchanged thus confirming the results of the final research
model.
The findings of this study are consistent with the expected signs of the theoretical
model specified on the basis of literature review. This is an important issue to consider
since misspecification may result in the reversal of the relationship’s expected signs. The
results are also meaningful in practical terms. Firms operating in the financial services
industry, having to deal with risk on a day-to-day basis, need to develop sophisticated and
reliable controls in order to be able to operate and survive in this industry. MCS use and
development is further encouraged by regulators, demanding the existence of certain
specific types of controls (e.g. controls for capital adequacy, stress testing and market
liquidity risk for banks, controls for solvency and risk management for insurers), and
enforcing the reporting of standardized information, in order to play their role effectively.
This means that institutions are required to have a minimum number of MCS in this
30
sophisticated MCS are available and managers use them not only for monitoring
outcomes but also to look for new strategic options to cope with a changing external
environment. Regulation and environmental uncertainty have also contributed to firms
having a type of organizational structure that is not very decentralized but is relatively
high on task specification and specialization. Higher levels of decentralization and of
task specification and specialization contribute to a lower intensity in the use of MCS,
especially for diagnostic purposes. A practical insight is that more complex organizations
tend to use a higher number of MCS but in a less intensive way for diagnostic and
interactive purposes. Alternatively, there is the possibility that some of these systems are
being used as either beliefs systems or boundary systems.
5. CONCLUSIONS, LIMITATIONS AND FUTURE RESEARCH
The present study represents an exploratory analysis of the relationships between
PEU, organizational structure, technology and MCS diagnostic and interactive uses in the
Portuguese financial services sector. Results show that PEU is an important variable for
understanding the type of organizational structure adopted by firms in this sector. Higher
PEU drives firms to become more decentralized and at the same time to engage in higher
specification and specialization of tasks. This study also finds that PEU is associated with
MCS diagnostic and interactive uses. Higher PEU intensifies the use of MCS both for
coordinating and monitoring outcomes as well as for outlining new strategies. Results
also support the negative association between organizational structure and MCS
diagnostic and interactive uses. It suggests that firms exhibiting higher centralization and
lower levels of task specification and specialization will tend to use more intensively a
31
and specialization of tasks. The relationships between technology and MCS uses and Size
and MCS uses were not found to be statistically significant.
The limitations of this research stem from the low response rate and small sample
size. Because of the need to respect the 10 times «rule of thumb», the small sample size
made the inclusion of separate variables measuring the 3 dimensions of PEU (dynamism,
unpredictability and hostility) and the 2 dimensions of Structure (decentralization and task
specification and specialization), in conjuntion with technology and size, impracticable,
resulting in the reduction of indicators used. However the number of indicators used (≥ 3
indicators) for PEU, Structure and Technology in the final reflective measurement model
may be considered acceptable (Lee et al., 2011). Additionally, the fact that
unpredictability and task specification and specialization were measured only by two
items each led to the decision of not considering them in the model as separate constructs
in order to reduce PLS-SEM bias (Hair et al., 2013). Likewise other variables that
according to the literature might be of relevance in explainig MCS Use, such as strategy
and organizational culture, could not be included in the model. The low R2 in the PLS
structural model suggests ommited variables which may induce upward bias on the path
coefficients. However R2 > 0.10 ensures that the variance explained by the endogenous
variables has practical, as well as, statistical significance (Lee et al., 2011).
Despite the limitations, this study contributes to the existing literature by providing
cross-sectional evidence of the relationships between PEU, organizational structure,
technology and MCS Diagnostic and Interactive Uses in the financial services sector. It
also develops a measure of MCS in a more comprehensive way by considering risk
management systems as part of the MCS used in an industry where risk plays a
fundamental role. The use of two theories in partnership (the Contingency Theory and the
32
Future research on MCS diagnostic and interactive uses should include the
relationship with strategy. Many authors advocate that diversification requires
differentiated, divisional structures (Chandler, 1962; Chenhall, 2007; Thompson &
Strickland, 2003) and that strategy may be constrained by the established organizational
structure (Donaldson, 1987). This suggests that the relationship between strategy and
organizational structure may be bi-directional (Ferreira & Otley, 2009). It is also expected
that strategy has a relationship with MCS diagnostic and interactive uses (Chenhall, 2007;
Naranjo-Gil & Hartmann, 2006). Finally, the relationship between MCS use and