Employer Branding:
What Makes a Firm a Desirable Place to Work
Ana Inês da Silva Berlenga Universidade Técnica de Lisboa Instituto Superior de Economia e Gestão
Master in Business Administration (MBA)
Committee:
João José Quelhas Mesquita Mota, Phd.: Instituto Superior de Economia e Gestão, Universidade Técnica de Lisboa;
Maria Margarida de Melo Coelho Duarte, Phd.: Instituto Superior de Economia e Gestão, Universidade Técnica de Lisboa
Jorge Filipe da Silva Gomes, Phd.: Instituto Superior de Ciências do Trabalho e da Empresa, Instituto Universitário de Lisboa
Abstract
A new concerning is coming to human resource management: the way organizational branding can influence human resources to applied and be committed to enterprises. This application of branding to human resource management has been designate as “employer branding.”
In the present exploratory study the major objective is to understand the role of
organizational reputation, organizational personality and tangible organizational attributes and manager’s perception of enterprise attractiveness and commitment.
Using an online survey on a 214 sample of Portuguese managers, they describe organizational reputation by emotional appeal and product and services characteristics. Work environment is also important. Organizational personality was characterized by being
technical, hard working and secure.
The most desirable tangible attributes on enterprise is money and work characteristics. Managers think that their enterprise believe that employees are important but the company don’t spend a significant amount of money to keep their employees happy.
Manager’s main factor of commitment is loyalty and proud that they are part of the company. However they don’t consider their company as being the best place to work.
Key Words: employer branding, corporate branding, organizational personality, organizational
INDEX
INTRODUCTION 07
THEORICAL BRACKGROUND 09
Introducing Employer Branding 09
Researching Employer Brand Concept and its Implications 10
How to Form Employer Branding Representation 15
Marketing Employer Branding in Human Resources Management 16
The External Marketing of the Employer Brand 17
The Internal Marketing of the Employer Brand 20
METHODOLOGY 25
Sample 25
Procedure 25
Measures 25
RESULTS 27
Sample Demographic Profile 27
Sample Profile by Work Experience 29
Sample Profile by Market Sector 31
Sample Profile by Job and Organizational Characteristics 34
DISCUSSION 53
REFERENCES 57
APPENDIX 1 61
Table Index
Table 1 – Translation of Organizational Reputation Items 69
Table 2 – Translation of Brand Personality Items 71
Table 3 –Translation of Tangible Attributes Items 73
Table 4 – Translation of Focus on People Items 74
Table 5 – Translation of Organizational Commitment Items 75
Table 6 – Sample Demographic Profile by Gender 27
Table 7 – Sample Demographic Profile by Age 28
Table 8 – Sample Profile by Years of Work in Present Company 29
Table 9 – Sample Profile by Number of Companies Worked Before 30
Table 10 – Sample Profile by Market Sectors 31
Table 11 – Sample Profile by Main Market Sectors 33
Table 12 – Organizational Reputation Statistical Results 35
Table 13 – Pearson Correlation of Organizational Reputation Items 36
Table 14 - Means, Median and Standard Deviations of Organizational Personality
Factors and Items 38
Table 15 – Pearson Correlation of Organizational Personality 40 Table 16 - Means, Median and Standard Deviations of Desirable Tangible
Attributes 42
Table 17 - Pearson Correlation of Desirable Tangible Attributes 43
Table 18 – Means, Median and Standard Deviations of Perceived Tangible
Attributes 45
Table 20 - Means, Median and Standard Deviations of Focus on People Items 48
Table 21 - Pearson Correlation of Focus on People Items 49
Table 22 - Means, Median and Standard Deviations of Organizational Commitment
Items 51
Figure Index
Figure 1 –Total Scale Results: Organizational Reputation 34
Figure 2 - Total Scale Results: Organizational Personality 37
Figure 3 - Total Scale Results: Desirable Tangible Attributes 41
Figure 4 - Total Scale Results: Perceived Tangible Work Attributes 44
Figure 5 - Total Scale Results: Focus on People Items 47
Figure 6 - Total Scale Results: Employee Organizational Commitment
INTRODUCTION
A new practice is coming to human resource management: the management of employer branding. The companies must “highlight the unique aspects of the firm’s employment offerings or environment.” (Backhaus & Tikoo, 2004, p. 502).
The globalization of markets and financial global crisis are creating new problems to Portuguese companies and in consequence to employment. Nevertheless what concerns to top management, companies are looking for the best qualified human resource capital.
According to Lievens, Decaesteker and Coetsier (2001) the attraction “…results from the fact that both the individual and the organization are making decisions about one another: on the one side, recruitment and selection processes enable organizations to attract and select individuals who fit best to their needs and expectations. On the other side, on the basis of their previous experiences, interests, needs, preferences, and personality individuals make a
selection among different organizations.” (p.31).
This study explores what managers are looking for, in Portuguese enterprises, as employees; what managers are most attracted relating to organizational reputation, personality, and human resource policies and practice.
For analyses purposes the survey was design based on relevant framework related to the factors that attract and retain employees in their enterprises: Organizational reputation, brand personality, tangible and perceived attributes attractiveness and organizational commitment.
THEORICAL BACKGROUND
Introducing Employer Branding
A new practice is coming to human resource management. As Backhaus and Tikoo (2004) argued “Although firms commonly focus their branding efforts toward developing product and corporate brands, branding can also be used in the area of human resource
management. The application of branding principles to human resource management has been termed “employer branding.” (p. 501).
Backhaus and Tikoo (2004) suggested that employer branding is “the differentiation of a firm’s characteristics as an employer from those of its competitors. The employment brand highlights the unique aspects of the firm’s employment offerings or environment.” (p. 502). More precisely “…the need for companies to differentiate themselves and to market is the unique employment proposition they can offer” (Ewing et. al., 2002, p. 11).
In the present research, the designation of employer branding given by Backhaus and Tikoo (2004) is adopted: “…the process of building an identifiable and unique employer identity, and the employer brand as a concept of the firm that differentiates it from its
competitors” (p.502). Corporate identity “…is the reality and uniqueness of the organization. Its principal components are the company’s strategy, philosophy, culture, and organizational design.” (Gray & Balmer, 1998, pp.696-697).
The “…company must align three essential, interdependent elements (…) to create a strong corporate brand: vision, culture and image.” (Hatch & Schultz, 2001, p. 130).
judgment about the company’s attributes. Corporate reputation evolves over time as a result of consistent performance, whereas corporate images can be fashioned more quickly through well-conceived communication programmers.” (p.697).
The present study adopted the following definition of corporate reputation: “A corporate reputation is a collective representation of a firm’s past actions and results that describes the firm’s ability to deliver valued outcomes to multiple stakeholders.” (Gardberg & Fombrun, 2002, p.303). “An organization’s corporate reputation impacts on all stakeholder groups – whether employees, customers, shareholders or the wider community – albeit in different ways. Employment brand equity is a subset of the overall corporate brand.” (Ewing, 2002, p.18).
Researching Employer Brand Concept and its Implications
In order to study employer brand concept some considerations of brand awareness and association were made. Fombrun and Shanley (1990) suggested that “investigating
reputation’s influence requires a fully articulated model of organizational performance that also acknowledges the effect of market, product, and strategy variables.” (p. 255).
Van Riel & Fombrun (2002) claimed that “a high degree of top of mind awareness of corporate brands will tend to have a positive impact on reputation if the antecedents of
familiarity are positive. Negative publicity or underperformance on the stock market generally creates a high degree of familiarity, with negative connotations.” (p. 297).
Fombrun (Van Riel & Fombrun, 2002, p. 297) developed the RQ-method (reputation quotient method), which “…solicits the general public’s nominations of best and worst companies, and uses the resulting distribution to identify the pool of companies to rate”.
their personal identity and needs, such as personal growth or the opportunity to work with compatible coworkers.” (p. 930)
The social theory suggests that the main factor “in developing competitive human capital in a firm is attracting the appropriate applicants.” (Backhause, 2004, p. 115). This research explored corporate recruitment descriptions in Monster.com (a leading internet recruitment site), because corporate descriptions are a key piece of information the job
seekers uses to understand and evaluate organization as employers (Backhause, 2004, p. 116). Backhaus (2004) argued that “by examining how firms market themselves as
employers, their particular “employer brand” may be revealed. Employer branding, (…) is the promotion of a unique and attractive image of the firm as an employer – a distinct employer identity.” (p.117). Backhaus added “…employer branding involves promoting, both within and outside the firm, a clear view of what makes a firm different and desirable as an employer.” (p. 120). By applying employer brand techniques the organizations behave
“…similar to person-organization fit construct, but it represents a stronger effort on the part of the employer to exploit the “fit-drive” of potential employees and to position the employer brand image appropriately to recruit the desired applicants.” (p. 120). Empirical results have shown that “…most organizations fail to differentiate themselves in any material way from their competitors, indicating that in most firms, the employer branding strategy has not successfully taken hold.” (p. 131).
To Lievens and Highhouse (2003), the foundation of the brand image construct seems to be that people “associate both instrumental functions and symbolic meanings with a brand.”(p. 77). In this study Lievens and Highhouse, concluded that “…current
To Davies and Chun (2003), “brand image as a metaphor should be limited to the idea of a brand being a mental picture, an impression in the mind. (…) In contrast, brand as person, and therefore the idea that brands can have personality is providing a whole raft of new ways of thinking about brands and branding. The metaphor is very much alive.”(p. 61). “A metaphor work through the associations we can make with something that is better understood or just easier to understand. More fundamentally the use of metaphor invites the reader to connect two ideas.” (p. 46).
Davies and Chun suggested that there are three roots in use in marketing: “…brand as differentiating mark, brand as person and brand as asset.” (p. 49).
Connotations are related to perceptions. Some authors adopted the personification metaphor in which found that “…potential traits that will identify what they label as
“corporate character” as their measure of the perceptions of employees and customers (…) it is not therefore a direct measure of reputation, but an example of a projective technique or an indirect measure.” (Davies, Chun, da Silva & Roper, 2004, p. 127).
To Davies and Chun (2003), “reputation includes the character of a person, something that is close to personality. (…) Individuals have values and so must the brand as person.” (p. 53). These authors argued that “personality and reputation appear to us to be the metaphors providing significant bases for current work on understanding brand and branding and we use these as our main examples of metaphors in their life phase.” (p. 63).
traits are created via inferences or attributions based on observations of another person’s behavior.” (Aaker & Fournier, 1995, p. 392).
To Aaker (1997), “the personality traits associated with a brand, such as those associated with an individual, tend to be relatively enduring and distinct.” (p. 347). These personality traits, “…come to be associated with a brand in a direct way by the people associated with the brand – such as brand’s user imagery, which is defined here as the set of human characteristics associated with the typical user of a brand; the company’s employees or CEO…” (p. 348).
People “…interprets the brand though many different filters; though experience, through perceptions, misconceptions, the value systems of the individuals out there in the world, and, of course, all the noise in the system.” (Plummer, 2000, p. 80).
In Aaker’s study (1997) results showed that “…consumers perceived that brands have five distinct personality dimensions: sincerity, excitement, competence, sophistication, and ruggedness.” (p. 353).
To Caprara, Barbarenelli and Guido (2001) “…while the notion of brand personality may be useful, the Big Five personality factors are not a good way of thinking about brands.” (p. 378). These authors argued that despite the limitations of the application of the Big Five model to brands, “…do not invalidate the use of the psycho lexical approach as a vital tool for studying brand personality and detecting the best adjectives marketers can use to shape their desirable brand personality.” (p. 393). So brand personality is not the same concept as psychologists denominate personality in humans. “In fact, the adjectives used to describe human personality may not all be relevant to brands.” (Azoulay & Kapferer, 2003, p. 149).
partner in the dyadic relationship that exists between the person and the brand, a partner whose behaviour and actions generate trait inferences that collectively summarize the consumer’s perception of the brand’s personality.” (p. 393). “The idea that we can have a relationship with a brand is an extension of the brand is person metaphor, as the implication is the brand requires a human dimension before we can have a relationship with it.” (Davies & Chun, 2003, p. 51).
Revisiting Aaker’s research (1997), Azoulay and Kapferer (2003) argued that the brand personality concept “… covers a variety of separated constructs: the personality itself, but also the values, the reflection of the typical or stereotypical buyer, and so on – all different facets of brand identity.” (p.153). To Azoulay and Kapferer (2003) brand personality should be considered as “…the unique set of human personality traits both applicable and relevant to brands.” (p. 153).
According to Plummer (2000), brand personality could be expressed in two forms: “…the first is the brand personality statement, that is, our communication goals for the brand (…) and the other is the brand personality profiles, which are consumer perceptions of the brand.” (p. 80). The profiles should identify salient components of the brand’s personality. That is, they should indicate which dimensions are strong and which dimensions are weak.” (p. 81). Plummer argued that there are three aspects of the brand’s description: “There are its physical elements or attributes, the functional characteristics or the benefits or consequences of using a brand, and the way the brand is characterized, or its personality.” (p. 81).
“Apparently companies are not capable of developing corporate employment image without a sound basis of corporate image. This view was supported by our findings that corporate image has a stronger relationship with application intentions that corporate employment image.” (Lemmink, Schuijf & Streukens, 2003, p. 13).
How to Form Employer Branding Representation
Companies wishing to recruit staff should recognize the type of image they present to potential employees and, if necessary, endeavor to present themselves more explicitly to the labor market so as to attract the best match of applicant (Davies et al., 2004, p.142).
Baker (2003) argued that “advertisers already know that heavy brand name exposure increase brand recall and recognition.” (p.1131). His findings were “… highly consistent with the proposition that brand name imprinting enables stronger linkages between the brand name node and benefit information nodes in the brand memory network.” (p. 1131). “Employment branding is therefore concerned with building an image in the minds of the potential labour market that the company, above all others, is a great place to work.” (Ewing, 2002, p.12).
Ewing, Pitt, Bussy, & Berthon (2002) considered the salience of present and potential employees as an audience of the firm’s advertising. They argued that “...the concept of brand equity be expanded to encompass how a firm’s brand, its name and symbol add to (or subtract from) the value provided by the firm and/or that firm’s current and potential employees. This view of brand equity may be referred to as employer branding…” (pp. 4-5). To these authors “now firms, certainly those in knowledge-intensive markets, will have to build employment brands that will enable them to endure and flourish in the ongoing struggles for talent.” (p. 8).
According to Fombrun and Shanley (1990) “… publics appear to construct reputations from a mix of signals derived from accounting and market information, media reports, and other noneconomic cues. Firm’s risk – return profiles, resources allocations, social
responsiveness, institutional ownership, media exposure, and corporate diversification postures signal constituents about firms’ prospects and generate reputations.” (p. 234).
Specifically addressing job seekers perceptions of employer reputation Cable and Graham (2000) found that “…the majority of respondent’s statements regarding the antecedents of organizational reputation (68 per cent) related to four factors: industry, perceived opportunity for personal development, organizational culture, and
familiarity/previous exposure.” (p. 935). In their study the most robust finding was that job seeker’s reputation perceptions were affected by: 1) industry, 2) familiarity with employers was positively related to their reputation beliefs, 3) profitability was the best predictor of job seeker’s reputation perceptions.
Marketing Employer Branding in Human Resources Management
Employer brand serves two different marketing contexts: external and internal. “External marketing of the employer brand is designed primarily to attract the target
population, but is also designed to support and enhance the product or corporate brands. (...) The goal of internal marketing, also know as internal branding, is to develop a workforce that is committed to the set of values and organizational goals established by the firm.” (Backhaus & Tikoo, 2004, pp. 502-503).
The External Marketing of the Employer Brand. “External marketing of the
employer brand establishes the firm as an employer of choice and thereby enables it to attract the best possible workers (…) once recruits have been attracted by the brand, they develop a set of assumptions about employment with the firm that they will carry into the firm, thereby supporting the firm’s values and enhancing their commitment to the firm.” (Backhaus & Tikoo, 2004, p. 503).
“Firms use employer branding to advertise the benefits they still offer, including training, career opportunities, personal growth and development.” (Backhaus & Tikoo, 2004, p. 504). Lievens and Highhouse (2003) recommended that if a company wants to set itself apart from other companies, they should focus on its symbolic meaning as an employer in the marketplace, “…especially crafted around a company’s innovativeness, prestige, and
sincerity, may indeed yield secondary benefits in recruiting.”(p. 98). Their results showed that “…trait inferences indeed add incremental variance, over and above job/organizational attributes, in the prediction of company’s attractiveness as a place to work.” (p. 95). For example, the bank’s innovativeness and competence were seen as especially important in assessing a firm’s attractiveness as an employer.
On the effort to find the best human resources, “for some firms, the right applicants may be those who fit the job in terms of a match between their particular skills, abilities, and values and those desired by the organization.” (Backhaus, 2004, pp. 115-116). “This is highly similar to the person-organization fit construct, but it represents a stronger effort on the part of the employer to exploit the “fit-drive” of potential employees and to position the employers brand image appropriately to recruit the desired applicants.” (Backhaus, 2004, p. 120).
aspects of the employer image, they are more likely to identify with the brand, and will more likely choose to seek membership with the organization for the sense of heightened self-image that membership promises.” (p. 506).
Lievens and Highhouse (2003) explained that “…potential applicants were attracted to organizations because pursuing a job in an organization that is considered to be innovative or competent enables them to express parts of their self-concept and personality.” (p. 96).
Thinking that there is a natural attraction to similar stimuli, “…job seekers are looking for descriptions of attributes that match their own. Thus, it is reasonable to assume that firms should provide sufficient information (…) so that prospective applicants can determine their own degree of fit.” (Backhaus, 2004, p. 118). Backhaus (2004) added “…knowing that image is a potentially strong driver of attraction, it would include information that acquaints the reader with the firm and its reputation, products, and services.” (p. 119).
“Optimistic projections in turn incline some publics to purchase those firms’ equity offerings, thereby increasing their market value and also signaling other publics that the firms have the inherent potential to meet some of their objectives, be they economic or social.” (Fombrun & Shanley, 1990, p. 238).
Employees may consider both functional and symbolic benefits. Lievens and
Highhouse (2003) suggested that potential applicants’ initial attraction to an organization as a place to work cannot be explained solely on the basis of job and organizational factors (…) is also based on the symbolic meanings (in terms of inferred traits) that they associate with organizations.” (pp. 76-77). They believed that “…the instrumental-symbolic framework has several key implications for the field of applicants’ initial attraction to companies.” (p.80).
…are mainly concerned with wages, working conditions, and personnel policies” (Gray & Balmer, 1998, p. 699).
Lievens, Decaesteker and Coetsier (2001) relating to organizational attributes, such as, organizational size, level of internationalization, pay mix and level of centralization reported that “…because such organizational characteristics are visible and salient for applicants quite early in the application process, they might be perceived as signals of the organizational culture and values and, hence, influence applicants’ intentions to pursue further contact with a firm.” (p. 33).
To Backhaus (2004) “…individuals may be attracted to organizations that they perceive as large, well-known, and prestigious because they feel that as members of such organizations, they, too, gain credibility and prestige.” (p. 131). Lievens, Decaesteker and Coetsier (2001) found that “…prospective applicants were more attracted to medium-sized and large-sized organizations, to multinational organizations, and to decentralized
organizations.”(p.45).
The Internal Marketing of the Employer Brand. “The term internal marketing has attained considerable prominence among both marketing practitioners and researchers over the past ten years. The thinking underlying internal marketing is that employees are viewed as internal customers and jobs as internal products.” (Edwing, et al., 2002, p.10).
“Current employees represent the internal constituency that a firm must consider when communicating corporate identity. It is widely believed that a favorable reputation in the eyes of employees can be a prime causal factor of high morale and productivity.” (Gray & Balmer, 1998, pp. 698). Lego “…involved some 7.000 employees, individuals share their dreams for the company and themselves, building support for the brand in the process.” (Hatch & Schultz, 2001, p. 134).
In an organizational change study, employees perceived credibility when “…there is congruence between the values expressed by the managers verbally and those expressed by their actions, when they adhere to moral and ethical principles, and when they are competent, knowledgeable, open, and concerned.” (Fox & Amichai-Hamburger, 2001, p. 90).
“The distinction between trust, satisfaction, and commitment has not always been clear in the marketing channels literature.” (Geyskens, Steenkamp & Kumar, 1998, p. 243).
“Employer branding, a relatively new practice in recruiting, is the promotion of a unique and attractive image of the firm as an employer – a distinct employer identity.” (Backhaus, 2004, p. 117). Here is another metaphor to research marketing phenomena. “A sub-metaphor that should fall within the root of brand as person is that of loyalty, this implies the human trait of being exclusively and enduring linked with another person, to be true and trustworthy in a relationship.” (Davies & Chun, 2003, p. 52).
conceptualized as being shaped by a behavioral element that relates to organizational culture and an attitudinal element that relates to organization identity.” (p. 508).
Organizational commitment refers to “…a person’s affective reactions to
characteristics of his employing organization. It is concerned with feelings of attachment to the goals and values of the organization, one’s role in relation to this, and attachment to the organization for its own sake rather than for its strictly instrumental value.” (Cook & Wall, 1980, p. 40). To these authors commitment as three components: “… (1) identification – or the pride in the organization, which involve the internalization of the organization’s goals and values; (2) involvement – characterized by the willingness to invest personal effort as a member of the organization, for the sake of the organization and, (3) loyalty – affection for the attachment to the organization, a sense of belongingness manifesting as a wish to stay.” (p.41).
The commitment-trust theory by Morgan and Hunt (1994) characterized relationship commitment as “an exchange partner believing that an ongoing relationship with another is so important as to warrant maximum efforts at maintaining it; that it, the commitment party believes the relationship is worth working on to ensure that it endures indefinitely.” (p. 23). The same authors conceptualized trust as “…existing when one party has confidence on an exchange partner’s reliability and integrity.” (p. 23). Morgan and Hunt’s empirical research “…clearly support the theory that commitment and trust are key mediating variables that contribute to relationship marketing success.” (p. 31). To these authors one of the ten forms of relationship marketing is the relational exchange involving one’s own employees or business units.
uncertainty).” (p. 34). Trust is externalized with sentiments, for example “…feelings of goal compatibility, domain consensus, and fairness have consistently been shown to increase trust. Greater levels of trust increase affective commitment and expectations of continuity, and decrease calculative commitment.” (Geyskens, Steenkamp & Kumar, 1998, p. 232).
To Hunt, Chonko and Wood (1985) “…all firms and all functional areas within firms want their employees to be committed to their respective organizations.” (p.112). According to these authors organizational commitment was defined as “…a strong desire to remain a member of the particular organization, given opportunities to change jobs.” (p.116). In their findings they indicated that “…job characteristics, more than personal attributes, influence employee commitment.” (p. 124).
To Davies et al. (2004, p. 129) the form how employees are treated will influence their perception of corporate character. To Caldwell, Chatman and O’Reilly (1990) “…an
individual’s commitment to organization may be shaped by the process through which he ou she enters the organization (recruitment) and by those steps the organization takes to teach him or her about the organization’s values, and how work is done (socialization). “(p. 246). Their research showed “…a significant positive relationship between strong organizational recruitment and socialization practices, and individual commitment. When firms have well-developd recruitment and orientation procedures and well-defined organizational values systems, respondents manifest higher levels of normative commitment to the organization.“ (p. 256).
“When compared with the uncommitted, committed subordinates are believed to dedicate more of their time, energy, and talents to the organization.” (Hunt, Chonko & Wood, 1985, p.113).
In Coyle-Shapiro and Kessler’s study about psychological contract (2000) “ …the results indicate that employees are redressing the balance in the relationship through reducing their commitment and their willingness to engage in organizational citizenship behaviour when they perceive their employer as not having fulfiled its part in the exchange process. “ (p. 903). These authors also suggested that “…employees and employers may hold different views on the content of the psychological contract and the degree to which each party has fulfilled the mutual obligations of the exchange. “ (p.905) . These authors considered that “…as an influencing factor on organizational citizenship behaviour, the psychological
contract, perceived organizational support and organizational commitment are complementary rather than competing predictors.“ (p. 920). Their research was démonstratif that “ the extent of perceived employer contract fulfilment has a significant effect on employees’ perceived organizational support, organizational commitment and organizational citizenship behaviour.“ (p. 922).
Coyle-Shapiro and Kessler (2000) study highlighed “…the importance of employer’s contract behaviour regarding the fulfilment of specific obligations in affecting employee’s attitudes and behaviour. “ (p. 923).
To Farrelly and Quester (2004) commitment “…refers to an orientation characterised by specific intentions and behaviours purposefully activated to realised value for both parties over the long-term. Commitment signals long-term strategic intent, and as the association needs to be in place for a number of years to become embedded in the minds of key
Farrelly and Quester (2004, p. 06) research demonstrated that sponsor commitment had a direct positive impact on their level of ecomonic satisfaction, and trust was found to have a significant positive impact on both level of economic and noneconomic satisfaction. The strongest impact was on noneconomic satisfaction including the type of interpersonal factors most associated with trust, like integrity, and truthfulness. The authors also verified that sponsors trust have a strong impact on their level of commitment to the relationship.
Geyskens, Steenkamp and Kumar’s study (1998) about trust in marketing channel relationships, conceptualized trust as “…a key mediator variable, influencing satisfaction and long-term orientation, even when we control for economic out-comes and other
antecendents.“ (p. 240). Their results showed that “…building trust is an important organization goal, managerial focus on (1) sentiments (such as goal compatibility and
fairness), (2) action (such as communication, opportunistics behaviour, and support), and (3) economic outcomes may be most effective." (p.242). They also verified that “…enrironmental uncertainty has a negative effect on trust, a nonsignificant effect on long-term orientation, and a positive effect on satisfaction. Communication has a large effect on trust and long-term orientation, but a small effect on satisfaction.” (p. 243).
As Bridges and Harrison (2003) showed in their research, the present study would like to demonstrate that “paying more attention to employees pays off, not only in terms of
Methodology
Sample
The participants in this study included two hundred fourteen (214) Portuguese senior managers from different economic sectors who were invited by email to respond to the survey by email.
Procedure
A survey was designed in order to understand the main factors that attract and retain best managers in enterprises (Appendix 1). The items included in the survey were computed on the original frameworks. The items were translated to Portuguese and a retroversion made by an independent jury to assure their validation and legibility (see tables 1, 2, 3, 4 and 5 for the translations details in Appendix 2).
This survey was developed as an online survey in order to obtain the main sample data. Survey was administrated by mail linked to a website, where individuals completed directly their responses.
The website was constructed by the Macromedia resources and was linked to an Access data base. Data was then exported to Excel and then to SPSS for statistical analyses.
Measures
Demographic measures as sex and gender were use to describe the whole sample. Job and organizational characteristics were evaluated by different factors. All the respondents were asked to identify the market sector in which they work (e.g. services, building sector).
The items included on the survey represented different constructs based in five scales: Fombrum reputation quotient for organizational reputation, Aaker scale for brand personality, Lievens scale for instrumental and symbolic attributes, Bridges scale for focus on people analyses and Sherer e Morishima scale for commitment analyses . Items were rated on a five point scale from “strongly disagree” to “strongly agree”.
The dimensions studied for organizational reputation (Fombrum reputation quotient) were: A) emotional appeal (how much the company is liked, admired, and respected.); B) products & services (perceptions of the quality, innovation, value, and reliability of the company’s products and services); C) financial performance (perceptions of the company’s profitability prospects and risk); D) workplace environment (perceptions of how well the company is managed, how it is to work for, and the quality of its employees); E) vision and leadership (how much the company demonstrates a clear vision and strong leadership) and F) social and environmental responsibility (perceptions of the company as a good citizen in its dealings with communities, employees, and the environment).
The organizational personality by Aaker was evaluated by main factors as competence, excitement, sincerity, ruggedness and sophistication. These main factors were also analysed thorough their facets and facets by its individual traits.
Lievens scale was used to evaluate the desirable tangible work attributes as well as for the perceived tangible work attributes, through three main factors: Money, enterprises and work.
To analyse the importance that the enterprise invest on the human resources (focus on people) from the managers point of view six items were analysed (e.g. My company believes employees are important).
RESULTS
Sample Demographic Profile
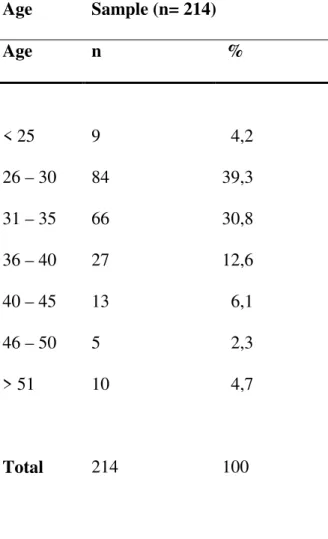
The sample was comprised by 214 respondents, all adult employed manager, 64% male and 36% females (Table 6); 39% have between 26 and 30 years old and 31% between 31 and 35 years old (Table 7).
Table 6 – Sample Demographic Profile by Gender
Gender Sample (n = 214)
n %
Male 137 64,0
Female 77 36,0
Table 7 - Sample Demographic Profile by Age
Age Sample (n= 214)
Age n %
< 25 9 4,2
26 – 30 84 39,3
31 – 35 66 30,8
36 – 40 27 12,6
40 – 45 13 6,1
46 – 50 5 2,3
> 51 10 4,7
Sample Profile by Work Experience
Mean years of work in the present company is less than two years (SD= 1, 143). Table 8 presents the sample distribution by years of work in the present company.
Table 8 – Sample Profile by Years of Work in Present Company
Years of Work in Present Company Sample (n=214)
n %
< 2 67 31,3 3 – 5 62 29,0 6 – 10 61 28,5 11 – 15 16 7,5 16 – 20 4 1,9 >21 4 1,9
Total 214 100
Mean Std. Deviation
Table 9 shows that 70% of the sample worked in two to four companies before working in the present company (M= 1,9; SD= 0,552).
Table 9 – Sample Profile by Number of Companies Worked Before
Number of Companies Worked Before Sample (n=214)
n %
1 43 20,1 2 – 4 150 70,1 5 – 7 20 9,3 8 – 10 1 0,5
Total 214 100
Mean Std. Deviation
Sample Profile by Market Sector
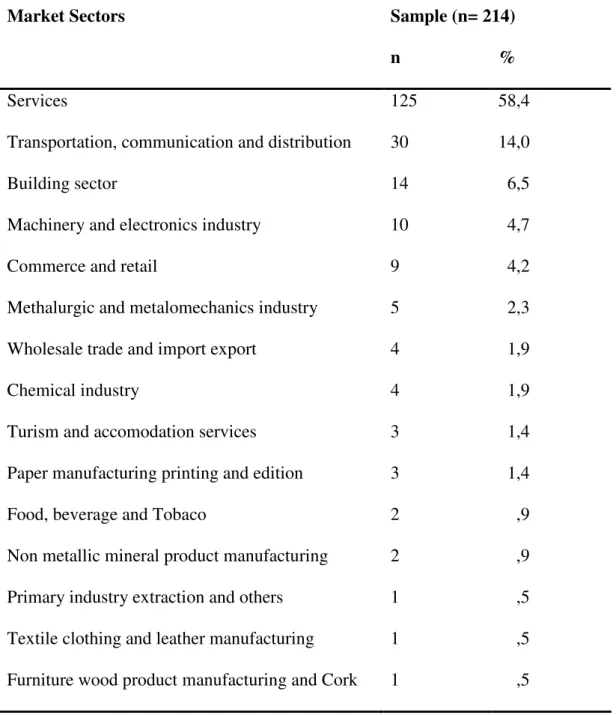
The sectors of industry represented in the sample, were mainly: Services (58.4%), transportation, communication and distribution (14%), building sector (6.5%), and machinery and electronics industry (4.7%). Details are reported in Table 10.
Table 10 – Sample Profile by Market Sectors
Market Sectors Sample (n= 214)
n %
Services 125 58,4
Transportation, communication and distribution 30 14,0
Building sector 14 6,5
Machinery and electronics industry 10 4,7
Commerce and retail 9 4,2
Methalurgic and metalomechanics industry 5 2,3
Wholesale trade and import export 4 1,9
Chemical industry 4 1,9
Turism and accomodation services 3 1,4
Paper manufacturing printing and edition 3 1,4
Food, beverage and Tobaco 2 ,9
Table 11 – Sample Profile by Main Market Sectors
Market Sectors Sample
(n=214)
n %
Services:
• Services 125 58,4
Sub totals 125 58,4
Industry:
• Machinery and electronics industry
• Methalurgic and metalomechanics industry
• Chemical industry
• Paper manufacturing printing and ediction
• Non Metallic mineral product manufacturing
• Primary industry extraction and others
10 5 4 3 2 1 4,7 2,3 1,9 1,4 ,9 ,5
Sub totals 25 11,7
Facilities:
• Transportation, communication and distribution
• Building sector
• Commerce and retail
• Wholesale trade and import export
• Turism and accomodation services
• Food, beverage and Tobaco
• Textile clothing and leather manufacturing
• Furniture wood product manufacturing and cork 30 14 9 4 3 2 1 1 14,0 6,5 4,2 1,9 1,4 ,9 ,5 ,5
Sub totals 64 29,9
Sample Profile by Job and Organizational Characteristics
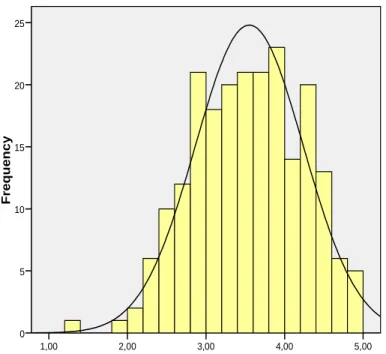
Organizational Reputation. The results for the organizational reputation, through the
Fombrun quotient analyses point of view, showed that, overall, the managers agreed their company have an organizational reputation (M= 3,55; SD= 0,688) (Figure 1).
5,00 4,00
3,00 2,00
1,00
F
re
q
u
e
n
c
y
25
20
15
10
5
0
Mean =3,55 Std. Dev. =0,688
N =214
The results to each dimension of organizational reputation are presented in Table 12.
Table 12 – Organizational Reputation Statistical Results
Organizational Reputation Dimensions and items
Descriptives Sample (n=214)
M m SD
Emotional Appeal:
• I have a good feeling about this company
• I admire and respect the company
• I trust this company
3,75 4,00 0,873
Products & Services:
• The company stands behind its products and services
• The company develops innovative products and services
• The company offers high quality products and services
• The company offers products and services that are a good value for the money
3,74 3,75 0,770
Financial Performance:
• The company has a strong record of profitability
• The company looks like a low risk investment
• The company tends to out perform its competitors
• Looks like a company with strong prospects for future growth
3,54 3,50 0,649
Workplace Environment:
• The company is well managed
• Looks like a good company to work for
• Looks like a company that would have good employees
3,54 3,66 0,799
Vision & Leadership:
• The company has an excellent leadership
• The company has a clear vision for its future
• The company recognises and takes advantages of market opportunities
3,34 3,33 0,969
Social and Environmental Responsibility:
• The company supports good causes
• Is an environmentally responsible company
• The company maintains high standards in the way it treats people
3,33 3,33 0,860
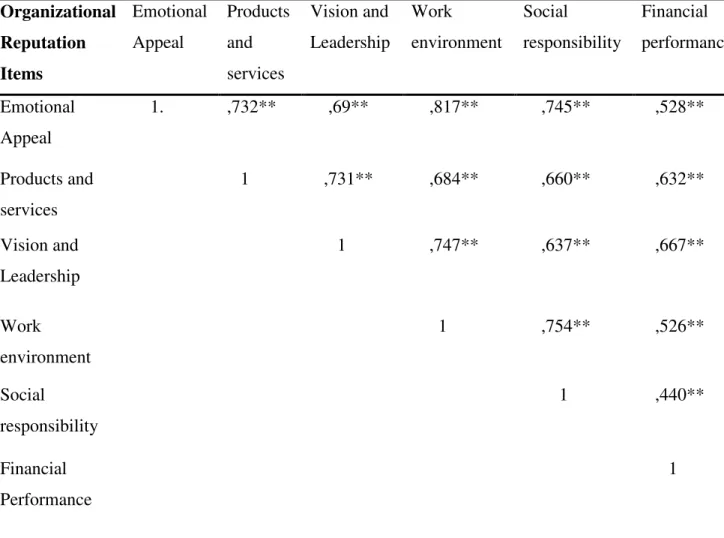
Table 13 presents the Pearson correlation of the main factors of organizational reputation.
Table 13 – Pearson Correlation of Organizational Reputation Items (n=214)
** Correlation is significant at the 0.01 level (2-talled). N=214 Organizational Reputation Items Emotional Appeal Products and services Vision and Leadership Work environment Social responsibility Financial performance Emotional Appeal
1. ,732** ,69** ,817** ,745** ,528**
Products and services
1 ,731** ,684** ,660** ,632**
Vision and Leadership
1 ,747** ,637** ,667**
Work environment
1 ,754** ,526**
Social
responsibility
1 ,440**
Financial Performance
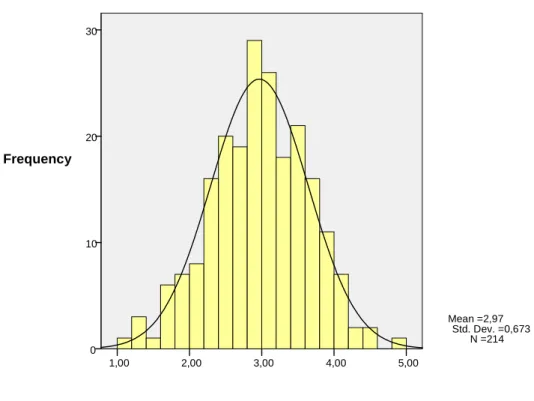
Brand Personality. The total results (Figure 2) for the organizational personality, through
Aaker scale, showed that this sample consider that the factors associated with organizational personality (e.g. competence) are reasonable associated with their company.
Figure nº 2- Total Scale Results: Organizational Personality
More specifically, attributes like competence (M= 3, 51; SD= 0,938), excitement (M= 3, 02; SD= 0,959) and sincerity (M= 2, 98; SD= 0,709) were reasonably associated with their company. While factors like ruggedness (M= 2, 74; SD= 0,732) and sophistication (M= 2, 59; SD= 0,888) had a weak association to their company.
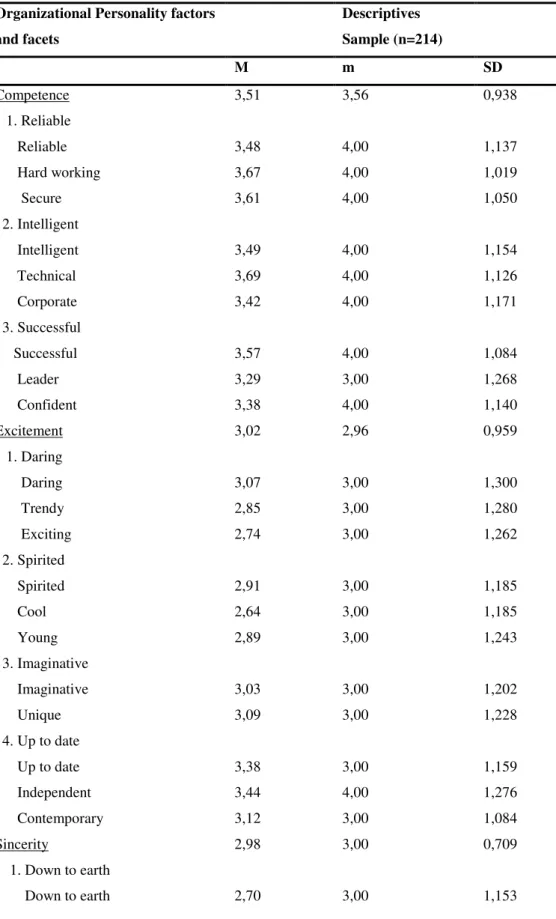
Table 14 presents descriptives analyses results of Organizational Personality factors, facets and its individual traits.
5,00 4,00
3,00 2,00
1,00
Frequency
30
20
10
0
Table 14 – Means, Median and Standard Deviations of Organizational
Personality Factors and Facets
Organizational Personality factors and facets
Descriptives Sample (n=214)
M m SD
Competence 3,51 3,56 0,938
1. Reliable
Reliable 3,48 4,00 1,137
Hard working 3,67 4,00 1,019
Secure 3,61 4,00 1,050
2. Intelligent
Intelligent 3,49 4,00 1,154
Technical 3,69 4,00 1,126
Corporate 3,42 4,00 1,171
3. Successful
Successful 3,57 4,00 1,084
Leader 3,29 3,00 1,268
Confident 3,38 4,00 1,140
Excitement 3,02 2,96 0,959
1. Daring
Daring 3,07 3,00 1,300
Trendy 2,85 3,00 1,280
Exciting 2,74 3,00 1,262
2. Spirited
Spirited 2,91 3,00 1,185
Cool 2,64 3,00 1,185
Young 2,89 3,00 1,243
3. Imaginative
Imaginative 3,03 3,00 1,202
Unique 3,09 3,00 1,228
4. Up to date
Up to date 3,38 3,00 1,159
Independent 3,44 4,00 1,276
Contemporary 3,12 3,00 1,084
Sincerity 2,98 3,00 0,709
1. Down to earth
Family oriented 2,64 3,00 1,228
Small town 2,17 2,00 1,252
2. Honest
Honest 3,43 3,00 1,106
Sincere 3,22 3,00 1,098
Real 3,21 3,00 1,079
3. Wholesome
Wholesome 3,22 3,00 1,137
Original 3,18 3,00 1,229
4. Cheerful
Cheerful 3,03 3,00 1,089
Sentimental 2,65 3,00 1,080
Friendly 3,05 3,00 1,049
Ruggedness 2,74 2,75 0,732
1. Outdoorsy
Outdoorsy 2,74 3,00 1,133
Masculine 3,00 3,00 1,204
Western 2,78 3,00 1,243
2. Tough
Rough 2,81 3,00 1,120
Rugged 2,50 2,00 1,158
Sophistication 2,59 2,66 0,888
1. Upper class
Upper class 2,94 3,00 1,147
Glamorous 2,55 2,00 1,144
Good looking 2,68 3,00 1,119
2. Charming
Charming 2,59 2,00 1,104
Feminine 2,21 2,00 1,062
Smooth 2,54 3,00 1,028
Table 15 presents the Pearson correlation of the main factors of organizational personality as they are evaluated by Aaker.
Table 15 – Pearson Correlation of Organizational Personality (n=214)
**Correlation is significant at the 0.01 level (2-tailed).
* Correlation is significant at the 0.05 level (2-tailed). Organizational
Personality
Sincerity Excitement Competence Sophistication Ruggedness
Sincerity 1 ,696** ,672** ,584** ,156*
Excitement 1 ,730** ,696** ,397**
Competence 1 ,543** ,340**
Sophistication
Ruggedness
1 ,403**
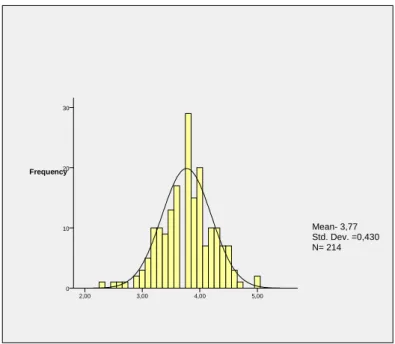
Desirable Tangible Work Attributes. Overall, top managers consider desirable tangible
items majors attributes (M= 3, 77; SD= 0,430) (Figure 3).
Figure nº 3 - Total Scale Results: Desirable Tangible Attributes
When top managers evaluated an enterprise they give major importance to general attributes like money (M= 4, 05; SD= 0,478) and work (M=3, 74; SD= 0,603). The factor enterprise (e.g. location, dimension) is evaluated as neither more important or less important (M= 3,44; SD= 0,635).
Table 16 presents descriptive analyses of the main desirable tangible attributes and their items.
5,00 4,00
3,00 2,00
Frequency 30
20
10
0
Table 16 – Means, Median and Standard Deviations of Desirable Tangible
Attributes
Desirable Tangible
Attributes Factors and
Items
Descriptives
Sample (n=214)
M m SD
Money 4,05 4,00 0,478
Payment 4,01 4,00 0,620
Benefits 3,81 4,00 0,783
Career 4,42 4,00 0,650
Security 3,94 4,00 0,797
Work 3,74 3,66 0,603
Tasks demands 3,93 4,00 0,689
Work with clients 3,61 4,00 0,921
Centralization 3,67 4,00 0,892
Enterprise 3,44 3,50 0,635
Internalization 3,52 4,00 0,928
Dimension 3,33 3,00 0,957
Localization 3,46 3,00 0,927
In Table 17 is shown the correlations between main factors of desirable tangible attributes.
Table 17 – Pearson Correlation of Desirable Tangible Attributes(n=214)
**Correlation is significant at the 0.01 level (2-tailed). Desirable Tangible
Attributes
Money Enterprise Work
Money 1 ,369** ,253**
Enterprise 1 ,499**
Perceived Tangible Work Attributes. When participants were asked to evaluated their own
enterprise for tangible attributes the total results showed that top managers perceived their own company neither as good or bad (M= 3,41; SD= 0,595).
Figure nº 4 - Total Scale Results: Perceived Tangible Work Attributes
l
5,00 4,00
3,00 2,00
1,00 30
20
10
0
Mean =3,41 Std. Dev. =0,595
Table 18 – Means, Median and Standard Deviations of Perceived Tangible Attributes
Factors and Items
Perceived Tangible
Attributes Factors and Items
Descriptives Sample (n=214)
M
m SD
Enterprise 3,66 3,66 0,730
Internalization 3,43 3,00 1,179
Dimension 3,66 4,00 0,888
Localization 3,90 4,00 0,922
Work 3,40 3,33 0,760
Tasks demands 3,46 4,00 0,932
Work with clients 3,68 4,00 0,846
Centralization 3,06 3,00 1,112
Money 3,20 3,25 0,714
Payment 3,22 3,00 0,930
Benefits 3,12 3,00 1,062
Career 2,89 3,00 1,073
Security 3,68 4,00 0, 0,950
Pearson correlations between the main perceived tangible attributes can be consulted in Table 19.
Table 19 – Pearson Correlation of Perceived Tangible Attributes(n=214)
** Correlation is significant at the 0.01 level (2-tailed). Perceived Tangible
Attributes
Money Work Enterprise
Money 1 ,499** ,481**
Work 1 ,478**
Enterprises Focus on People Analyses. Overall the managers did not show a clear position
(M= 3,10; SD= 1,045) what relates to enterprise commitment to their employees.
Figure nº 5 –Total Scale Results: Focus on People Items
6,00 5,00
4,00 3,00
2,00 1,00
0,00
Frequency
25
20
15
10
5
0
Mean =3,10 Std. Dev. =1,046
The six items focus on people items were analysed and the results are presented in Table 20.
Table 20 – Means, Median and Standard Deviations of Focus on People Items
Focus on People Items Descriptives
Sample (n=214)
M m SD
My company believes employees are important 3,32 3,50 1,152
My company is committed to employee values 3,22 3,00 1,196
My company treats employees as if they are important 3,12 3,00 1,175
My company does a good job of creating employee value 3,07 3,00 1,212
My company spends a significant amount of money to keep employees happy
2,98 3,00 1,142
My company focused a great deal of attention on employees 2,89 3,00 1,073
In Table 21 is shown the correlations between main factors of focus on people items.
Table 21 – Pearson Correlation of Focus on People Items (n=214)
** Correlation is significant at the 0.01 level (2-tailed).
Focus on People Items My company is committed to employee My company spends a significant amount of money to keep employees My company believes employees are important My company treats employees as if they are important
My company focused a great deal of attention on employees
My company does a good job of creating employee value
My company is committed to employee
1 ,745** ,793** ,807** ,755** ,818**
My company spends a significant amount of money to keep
employees
1 ,672** ,701** ,718** ,757**
My company believes employees are important
1 ,832** ,781** ,786**
My company treats employees as if they are important
My company focused a great deal of attention on employees
1 ,893**
1
,818**
,790**
My company does a good job of creating employee value
Employee Organizational Commitment Analyses. The managers in this study did not
show a clear position what concerns their commitment to the company where they work (M= 3,32; SD= 0,916) as shown in Figure 6.
Figure n 6 - Total Scale Results: Employee Organisational Commitment
6,00 5,00 4,00 3,00 2,00 1,00 0,00 25
20
15
10
5
0
Mean =3,32 Std. Dev. =0,916
N =214
The six commitment items were analysed individually and the results are reported in Table 22.
Table 22 – Means, Median and Standard Deviations based on Sherer and Morishima
Organizational Commitment Items
Organizational
Commitment Items
Descriptives
Sample
(n=214)
M m SD
I feel completely loyal to my company 3,86 4,00 0,964
I am proud to tell others that I am a part of my company 3,64 4,00 1,050 Deciding to work at my company was the definitive my
best decision
3,28 3,00 1,059
I talk up about my company to my friends as a great organization to work for
3,26 3,00 1,145
I find that my values and the values of my company are very similar
3,08 3,00 1,143
For me, this is the best of all possible organizations for which to work
2,82 3,00 1,149
In Table 23 is shown the correlations between main factors of employee organizational commitment items.
Table 23 – Pearson Correlation of Employee Organizational Commitment Items (n=214)
** Correlation is significant at the 0.01 level (2-tailed). Employee
Commitment Items
For me, this is the best of all possible organizati ons for which to work
I talk up about my company to my friends as a great organizatio n to work for
Deciding to work at my company was the definitive my best decision
I find that my values and the values of my company are very similar
I feel completely loyal to my company
I am proud to tell others that I am a part of my company
For me, this is the best of all possible organizations for which to work
1 ,720** ,747** ,701** ,499** ,679**
I talk up about my company to my friends as a great
organization to work for
1 ,664** ,732** ,569** ,718**
Deciding to work at my company was the definitive my best decision
1 ,590** ,563** ,692**
I find that my values and the values of my company are very similar I feel completely loyal to my company
1 ,496**
1
,713**
,697**
I am proud to tell others that I am a part of my company
DISCUSSION
This exploratory study investigated what makes a firm a desirable place to work. As outline previously employer branding is “...the process of building an identifiable and unique employer identity, and the employer brand as a concept of the firm that
differentiates it from its competitors.” (Backhouse and Tikoo, 2004, p.502).
We started by revisiting RQ-method (Reputation Quotient) by Fombrun and
colleagues, and Aaker’s personality traits for brand personality. Some scales were adopted by influence of Lievens, Briedges and Sherer and their team’s work.
After an online survey application, sample resulted on 214 respondents, 137 male and 77 female, mainly (70%) between 26 and 35 years of age. Sixty per cent of the respondents were at the present company for less than 5 years. Ninety per cent had worked between one and four different companies until today. Almost 60% of the respondents worked in the service sector and almost 30% worked in facilities like transportation, building sector or industry.
Observing data analyses the main conclusion is that: respondents considered their company reputation mainly describe by the emotional appeal and the products and services characteristics. The last component in their reputation consideration was about social and environmental responsibility, vision and leadership. The higher link between reputation factors is related to emotional appeal and work environment, just like Cable and Graham (2000, p.930) reported, according to social identity theory.
The weaker correlation between reputation factors was observed in social
and Graham (2000). Their results suggested “...that profitability was the best predictor of job seeker’s reputation perceptions.”(p.943).
Respondents consider their organizational personality as been characterized by
competence, like to be technical, hard working and secure, and by excitement like by being up to date like for example independent, up to date and contemporary. The factors that describe less the organizational personality was sophistication and ruggedness, like to be feminine, smooth and glamorous.
In conclusion respondents in this study considered their organizational personality was mainly technical, competent, reliable and intelligent and was not neither charming nor upper class. This goes in the same direction as Lievens and Highhouse (2003) study, where
“...potential applicants were attracted to organizations considered to be innovative or competent because enables them to express parts of their self-concept and personality.” (p.96).
The personality factors higher correlated was between competence and excitement. The weaker relation founded was between sincerity and ruggedness. The main factor that better related to all others was excitement. The personality factor less related to others was ruggedness.
Managers who responded to this study claimed that their most desirable tangible attributes are money, followed by work and enterprise. Their favourite items are career, payment, security and task demands. This result is in line with Gray and Balmer (1998) research, where employees “...are mainly concerned with wages, working conditions, and personnel policies.” (p.699).
enterprise and work factors. The weakest relation identified by managers was between work and money factors.
What concerns tangible attributes, Portuguese managers perceived as most satisfying, in their present company, the enterprise factor, followed by work and then by money. The most satisfying items were localization, dimension and internalization, and the worst satisfying items were career, benefits and payment. In conclusion, the desirable tangible attributes were inversely (almost totally) perceived to tangible attributes. Managers showed that the strongest relation in tangible factors occurred between money and work and identified the weakest relation between work and enterprise.
Related to the point their enterprises are focused on people the results showed that managers mostly agree with the item “my company believes employees are important”; the item with worst level of agreement was “my company focused a great deal of attention on employees.” The items which demonstrated strongest correlation on organizational focus on people were “my company focused a great deal of attention on employees” and “my company treats employees as if they are important”. On the contrary the weakest correlation was
between “my company believes employees are important” and “my company spends a significant amount of money to keep employees happy”.
Respondents attributed the commitment factor mainly to the items related to loyalty and to be proud to tell others that they are part of their company. However the weak factors were related to the item considering their company as being the best of all possible
REFERENCES
Aaker, J.L., & Fournier, S. (1995). A brand as a character, a partner and a person: Three perspectives on the question of brand personality. Advances in Consumer Research, 22, 391 – 394.
Aaker, J.L. (1997). Dimensions of brand personality. Journal of Marketing Research. 34 (8), 347 – 356.
Azoulay, A., & Kapferer, J.N.(2003). Do brand personality scales really measure brand personality? Journal of Brand Management, 11 (2), 143 – 155.
Backhaus, K. B. (2004). An exploration of corporate recruitment descriptions on monter.com. Journal of Business Communication, 41 (2), 115 – 136.
Backhouse, K.B., & Tikko, S. (2004). Conceptualizing and researching employer branding. Career Development International, 9 (5), 501 – 516.
Baker, W.E. (2003). Does brand name imprinting in memory increase brand information retention? Psychology and Marketing, 20 (12), 1119 - 1135.
Bridges, S., & Harrison, J.K. (2003). Employee perceptions of stakeholders focus and commitment to the organization. Journal of Managerial Issues, 15 (4), 498 – 509.
Cable, D.M., & Graham, M.E. (2000). The determinants of job seekers’ reputation perceptions. Journal of Organizational Behaviour, 21, 929 – 947.
Caldwell, D. F., Chatman J. A., & O’Reilly C.A. (1990). Building organizational commitment: A multifirm study. Journal of Occupational Psychology, 63, 245-261.
Caprara, G.V., Barbaranelli, C., & Guido, G.(2001). Brand personality: How to make the metaphor fit? Journal of Economic Psychology, 22, 377-395.
Coyle-Shapiro, J., & Kesser, I. (2000). Consequences of the psychological contract for the employment relationship: A large scale survey. Journal of Management Studies, 37 (7), 904 – 930.
Davies, D., & Chun, R. (2003). The use of metaphor in the exploration of the brand concept. Journal of Marketing Management, 19, 45 – 71.
Davies, D., Chun, R., da Silva, R.V., & Roper, S. (2004). A corporate character scale to assess employee and costumers views of organization reputation. Corporate Reputation Review, 7 (2), 125 – 146.
Durgee, J.F. (1988). Understanding Brand Personality. The Journal of Consumer Marketing, 5 (3), 21 – 25.
Ewing, M. T., Pitt, L. F., Bussy, N.M., & Berthon, P. (2002). Employment branding in the knowledge economy. International Journal of Advertising, 21, 03 – 22.
Farrelly, F. J.,& Quester, P. G. (2004). Examining important relationship quality constructs of the focal sponsorship exchange. Industrial Marketing Management, 20, 01 – 09.
Fombrun, C. J., Gardberg, N. A., & Sever, J. I. (2000). The reputation quotient: A multi-stakeholder measure of corporate reputation. The Journal of Brand Management, 7(4), 241 – 255.
Fombrun, C., & Shanley, M. (1990). What’s in a name? Reputation building and Corporate Strategy. Academy of Management Journal, 33 (2), 233 –258.
Fox, S., & Amichai-Hamburger, Y. (2001). The power of emotional appeals in promoting organizational change programs. The Academy of Management Executive, 15 (4), 84 – 95.
Gardberg, N.A., & Fombrun, C.J. (2002). The global reputation quotient project: First steps towards a cross – nationally valid measure of corporate reputation. Corporate
Geyskens, I., Steenkamp, J.B., & Kumar, N. (1998). Generalizations about trust in marketing channel relationships using meta-analysis. International Journal of Research in Marketing, 15, 223 – 248.
Gray, E.R., & Balmer J. T. (1998). Managing corporate image and corporate reputation. Long Range Planning, 31(5), 695 – 702.
Hatch, M.J., & Schultz, M. (2001). Are the strategic stars aligned for your corporate brand? Harvard Business Review, (2), 129 – 134.
Hunt, S. D., Chonko, L.B., & Wood, V.R. (1985). Organizational commitment and marketing. Journal of Marketing, 49, 112 – 126.
Lemmink, J., Schuijf, A., & Streukens, S. (2003). The role of corporate image and company employment image in explaining application intentions. Journal of Economics Psychology, 24, 01-15.
Lievens, F., Decaesteker, C., Coetsier, P., & Geirnaert, J. (2001). Organizational attractiveness for prospective applicants: A person-organization fit perspective. Applied Psychology: An International Review, 50 (1), 30 – 51.
Lievens, F., & Highhouse, S. (2003). The relation of instrumental and symbolic attributes to a company’s attractiveness as an employer. Personnel Psychology, 56, 75 – 102.
Morgan, R. M., & Hunt S. D. (1994). The commitment -trust theory of relationship marketing. Journal of Marketing, 58. 20 – 38.
Plummer, J.T. (2000). How Personality Makes a Difference. Journal of Advertising Research, December, 79 – 83.
APPENDICES 1
APPENDIX 2
Table 1: Translation of Organizational Reputation Items
Organizational Reputation Items
n. Original items * Adapted items
1 I have a good feeling about the company Tenho uma boa sensação relativamente à
empresa
2 I admire and respect the company Admiro e respeito esta empresa
3 I trust this company Confio nesta empresa
4 Stands behind its products and services A empresa defende os seus produtos e
serviços
5 Develops innovative products and services A empresa desenvolve produtos e serviços
inovadores
6 Offers high quality products and services A empresa oferece produtos e serviços de
elevada qualidade
7 Offers products and services that are a good
value for the money
A empresa oferece produtos e serviços que valem bem aquilo que custam
8 Has excellent leadership A empresa tem uma liderança excelente 9 Has a clear vision for its future A empresa tem uma visão clara relativamente
ao seu futuro
1
0
Recognizes and takes advantage of market opportunities
A empresa reconhece e retira vantagem das oportunidades do mercado
1
1