The Brazilian
Competitiveness Cliff
Otaviano Canuto, Matheus Cavallari and Jose Guilherme Reis
Poverty Reduction and Economic Management The World Bank
Climbing down a
competitiveness cliff
1. Export performance in the recent past;2. Elements potentially associated with low competitiveness;
Export Performance
•
The good news:
•
Brazilian exports showed remarkable expansion
in recent years.
•
Exports expanded 262% during 2000-10, almost
twice the global average.
•
Exports are well diversified in both markets and
Export Performance
• Brazil is a global trader - exports a large number ofproducts to many markets.
• Herfindahl Index also shows strong diversification.
Figure 3. Product and Markets (2008–10) Figure 5. Herfindahl Index and GDP per Capita
Source: World Integrated Trade Solution. Source: World Development Indicators.
ARG BRA CHL CHN COL IDN IND KOR MEX PERPHL THA URY VNM 0 1000 2000 3000 4000 5000 N u mb e r o f p ro d u ct s 0 50 100 150 Number of countries P E R C H N B R A IN D K O R J O R R U S C O L M E X C H L U R Y A R G 0 .1 .2 .3 H H I n d e x 0 1 0 0 0 0 2 0 0 0 0 3 0 0 0 0 4 0 0 0 0 G D P p e r c a p ita ( P P P , a v .)
Export Performance
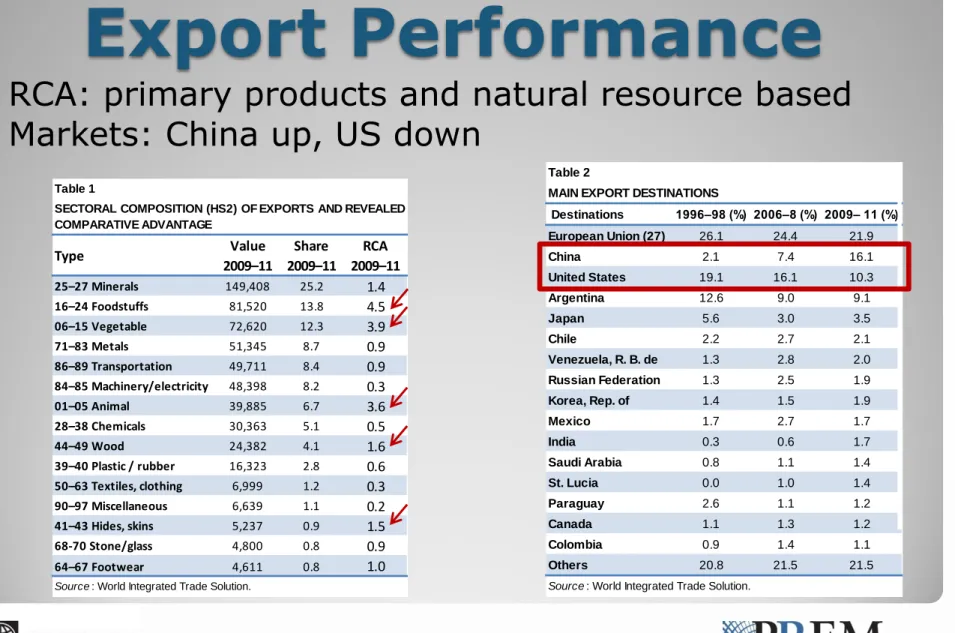
• RCA: primary products and natural resource based • Markets: China up, US downTable 1
Value Share RCA
2009–11 2009–11 2009–11 25–27 Minerals 149,408 25.2 1.4 16–24 Foodstuffs 81,520 13.8 4.5 06–15 Vegetable 72,620 12.3 3.9 71–83 Metals 51,345 8.7 0.9 86–89 Transportation 49,711 8.4 0.9 84–85 Machinery/electricity 48,398 8.2 0.3 01–05 Animal 39,885 6.7 3.6 28–38 Chemicals 30,363 5.1 0.5 44–49 Wood 24,382 4.1 1.6 39–40 Plastic / rubber 16,323 2.8 0.6 50–63 Textiles, clothing 6,999 1.2 0.3 90–97 Miscellaneous 6,639 1.1 0.2 41–43 Hides, skins 5,237 0.9 1.5 68-70 Stone/glass 4,800 0.8 0.9 64–67 Footwear 4,611 0.8 1.0 Type
SECTORAL COMPOSITION (HS2) OF EXPORTS AND REVEALED COMPARATIVE ADVANTAGE
Source : World Integrated Trade Solution.
Table 2 Destinations 1996–98 (%) 2006–8 (%) 2009– 11 (%) European Union (27) 26.1 24.4 21.9 China 2.1 7.4 16.1 United States 19.1 16.1 10.3 Argentina 12.6 9.0 9.1 Japan 5.6 3.0 3.5 Chile 2.2 2.7 2.1 Venezuela, R. B. de 1.3 2.8 2.0 Russian Federation 1.3 2.5 1.9 Korea, Rep. of 1.4 1.5 1.9 Mexico 1.7 2.7 1.7 India 0.3 0.6 1.7 Saudi Arabia 0.8 1.1 1.4 St. Lucia 0.0 1.0 1.4 Paraguay 2.6 1.1 1.2 Canada 1.1 1.3 1.2 Colombia 0.9 1.4 1.1 Others 20.8 21.5 21.5
MAIN EXPORT DESTINATIONS
Source : World Integrated Trade Solution.
Korea, Rep. of St. Lucia
Export Performance
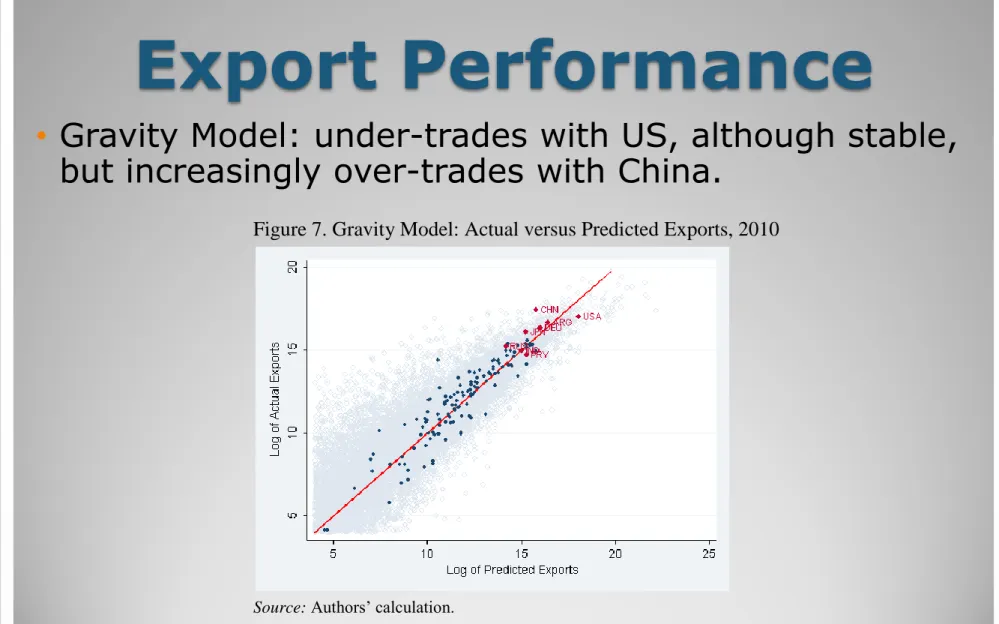
• Gravity Model: under-trades with US, although stable,
but increasingly over-trades with China.
Figure 7. Gravity Model: Actual versus Predicted Exports, 2010
Export Performance
• High-technology products lost ground, as absolutegrowth was only 36% during 2000-10.
• Average sophistication (EXPY index) has decreased. Figure 10. Brazil and Latin America (2004–10): EXPY Index
Source: Authors’ calculation.
2004 2006 2008 2010 2004 2006 2008 2010 20042006 20082010 2004 2006 2008 2010 2004 2006 2008 2010 8 .8 9 9 .2 9 .4 L o g EXPY 8.6 8.8 9 9.2 9.4 9.6
Log GDP per capita, PPP (constant 2005 international USD)
Peru Argentina Brazil
Chile Colombia
Figure 9. Export Technological Content
Export Performance
• Brazilian exports benefited from strong geographical and sector
effects; pure “competitiveness effect” is lower than BRICS and
MIST. Table 5 Geographical (%) Sectoral (%) Overall (value) (%) Price com ponent (%) Volum e com ponent (%) European Union (EU27) 6.9 -2.9 9 -1.6 -0.5 -0.6 0 -0.6
of which Euro Area
(EA17) 5.8 -4.1 7.4 -1.3 -0.3 -2.2 -0.4 -1.7 Japan 7.4 -2.4 4.5 3.6 -0.6 -5.1 2.4 -7.2 United States 6.5 -3.3 5.1 1.2 0.2 -4.3 -0.8 -3.7 Brazil 13.2 3.4 11.2 0.8 1.2 1.1 0.6 0.4 Russian Federation 18.4 8.6 16 -0.8 3.3 5.2 0.9 4.3 India 16.3 6.5 13.9 -1.3 3.8 3.3 0.5 2.8 China 11.8 2 15.9 -0.2 -3.9 6.1 -0.7 6.9 South Africa 14.4 4.6 13 2.2 -0.8 2.6 -0.9 3.5 Mexico 12.3 2.5 15.5 -3 -0.2 5.6 -0.3 6 Indonesia 17.1 7.3 14.9 1 1.2 4.4 1.8 2.6 Korea, Rep. of 15.7 5.9 12.8 4.3 -1.4 2.4 0.2 2.2 Turkey 8.7 -1.1 12.5 -1.4 -2.4 2.8 -1.9 4.8 G-3 BRICS MIST
Source: Authors’ calculation. Note: Figures are in average annual growth. Export Growth Decomposition: Brazil (first quarter 2009 to third quarter 2011)
Export grow th (%) Export m arket share change (%) Perform ance (export grow th w ithout com position effects) (%) Pull factors (specialization, com position effects), of
w hich:
Push factors (export m arket share grow th w ithout com position
Export Performance
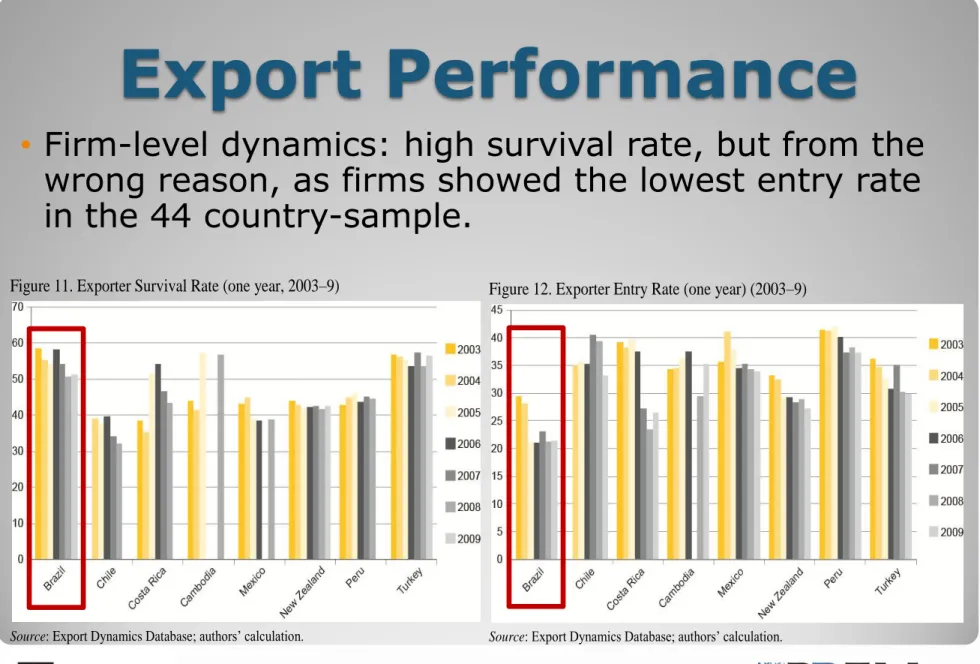
• Firm-level dynamics: high survival rate, but from the
wrong reason, as firms showed the lowest entry rate in the 44 country-sample.
Figure 11. Exporter Survival Rate (one year, 2003–9)
Source: Export Dynamics Database; authors’ calculation.
Figure 12. Exporter Entry Rate (one year) (2003–9)
Export Performance
• Exports expanded 262% during 2000-10.• Almost twice of global average, but half of BRICS. • Trade openness is still among the lowest.
Figure 2. Trade to GDP (%)
Source: World Bank. World Development Indicators.
ARG BRA CHL COL PER IND CHN RUS ZAF 0 50 1 0 0 1 5 0 2 0 0 2 5 0 T ra d e t o GD P ( % ), 1 9 9 8 -2 0 0 0 6 7 8 9 10 11
Log of GDP per capita (PPP, av. 1998-2000)
ARG BRA CHL COL PER IND CHN RUS ZAF 0 50 1 0 0 1 5 0 2 0 0 2 5 0 T ra d e t o G D P ( % ), 2 0 0 8 -2 0 1 0 6 7 8 9 10 11
Export Performance
In a cross-country sample of 155 countries in 2010-11, Brazil had the lowest trade-to-GDP ratio at 23.6%. But large (or landlocked)
countries trade less, all else equal; trade-to-GDP ratio for the US is only 29%, Argentina (40.7%), Colombia (34.5%). Compared to 1990-91, however, Brazil has increased its ratio from about 16%.
Cross country regression can adjust the actual openness ratio to factor in other explanatory variables. Typical are:
Log GDP, log GDP squared, log of population, log of remoteness and a dummy for landlockedness.
Our linear model predicts that Brazil should have an approx. trade-GDP ratio of 53.7%; it is under-trading by about 30 percentage points. Not the highest one, though – Colombia, for example, is
under-trading by more than Brazil (actually almost all LAC countries under-trade!)
Export Performance
• Another way to look at this is through the participation
index (Koopman et al, 2011). The chart taken from OECD 2012 confirms Brazil’s lack of integration in global value chains.
Brazilian Economy
• Puzzle: “soft-landing” with full employment, but no
reaction from investment ratio.
Figure: GDP Growth, Unemployment, Domestic Demand and Investment Ratio
Source: Instituto Brasileiro de Geografia e Estatistica
3 5 7 9 11 13 -2 0 2 4 6 8 10 3Q0 2 1Q0 3 3Q0 3 1Q0 4 3Q0 4 1Q0 5 3Q0 5 1Q0 6 3Q0 6 1Q0 7 3Q0 7 1Q0 8 3Q0 8 1Q0 9 3Q0 9 1Q1 0 3Q1 0 1Q1 1 3Q1 1 1Q1 2 3Q1 2
GDP growth (left) unemployment rate
15 16 17 18 19 20 -2 0 2 4 6 8 10 12 3Q0 2 1Q0 3 3Q0 3 1Q0 4 3Q0 4 1Q0 5 3Q0 5 1Q0 6 3Q0 6 1Q0 7 3Q0 7 1Q0 8 3Q0 8 1Q0 9 3Q0 9 1Q1 0 3Q1 0 1Q1 1 3Q1 1 1Q1 2 3Q1 2
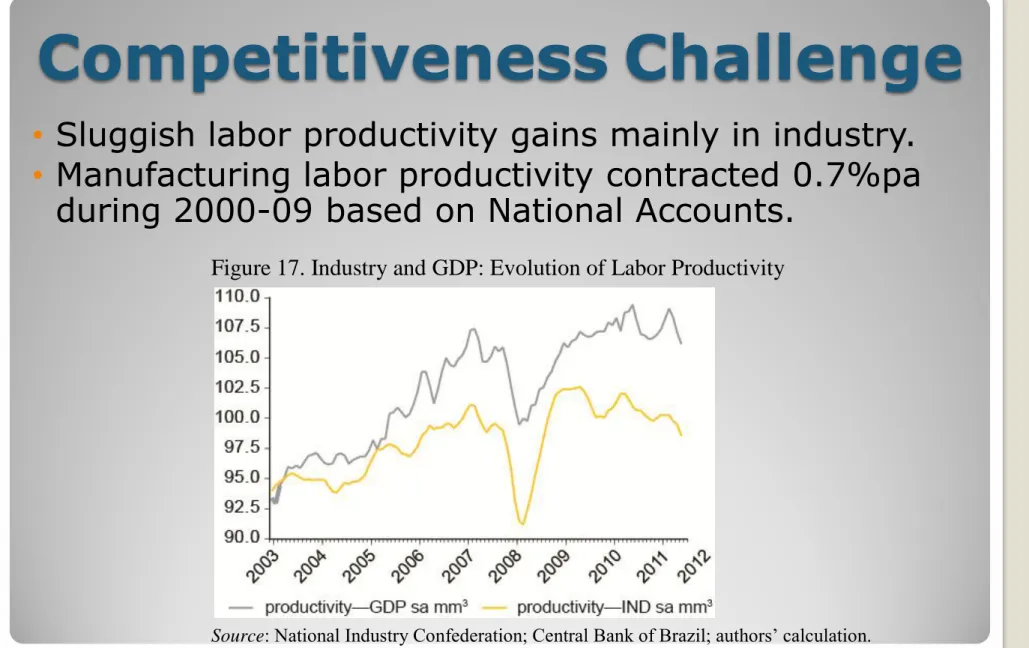
Competitiveness
Challenge
• Sluggish labor productivity gains mainly in industry.• Manufacturing labor productivity contracted 0.7%pa
during 2000-09 based on National Accounts.
Figure 17. Industry and GDP: Evolution of Labor Productivity
• Favorable terms of trade fuel employment and
income, and by consequence domestic demand.
• Service sectors benefit from domestic demand and
may accommodate larger cost pressures.
Figure 18. Terms of Trade
Source: Funcex (http://www.funcex.org.br).
Figure 19. Real Average Wages
Source: Instituto Brasileiro de Geografia and Estatística ( IBGE).
• As a result of the combination of higher real wages
and stagnant or falling labor productivity, industrial unit labor costs have soared.
Figure 20. Unit Labor Cost in Industry Sector
Source: National Industry Confederation; authors’ calculation.
•
Exchange rate appreciation seems to be just one
more element adding to the competitiveness.
Figure 21. Real Effective Exchange Rate and Unit Labor CostSource: Central Bank of Brazil.
•
Trade costs indicators are still high, and logistics
performance has plenty to improve.
Figure 22. Foreign Trade Logistics – Costs of Dealing with ContainersSource: World Bank. World Development Indicators.
Conclusion
•
Brazilian economy shows remarkable
diversification with potential to expand trade
openness.
•
But, some major concerns remain:
export entry rate is low and has dropped.
export performance fueled by significant
favorable geographical and sector
composition effects.
declining sophistication, not just because the
success of commodity-related exports.
significant cost pressures and
Conclusion
•
Policies aiming at higher productivity are crucial,
rather than just short-term stimulus or focused
policies favoring some export sectors.
•
This diagnostic reinforces the importance of
resuming the agenda of microeconomic reforms,
increasing the investment-to-GDP ratio, and
advancing toward a better-skilled human capital
base.
•
Promoting and rewarding productivity gains in a
competitive economy, including the service
sector, are the only options to accelerate growth
and overcome middle-income growth traps.
Thank you
"The Brazilian Competitiveness Cliff," with Matheus Cavallari and Jose
Guilherme Reis. Economic Premise No. 105. Washington D.C. February 2013.
"Brazilian Exports: Climbing Down a Competitiveness Cliff," with
Matheus Cavallari and Jose Guilherme Reis. Policy Research Working Paper 6302. World Bank. Washington D.C. January 2013.