A Work Project, presented as part of the requirements for the Award of a Master Degree in Economics from the NOVA – School of Business and Economics.
Can We Improve the Prediction of the Influenza
Onset and Save Money in the Process?
João Miguel de Jesus Gomes Cortes nr. 25874
A Research project carried on the Master’s in Economics Program Under the Supervision of: Professor Joana Gonçalves-Sá
Thank you Note
I want to thank professor Joana Gonçalves-Sá and Doctor Lília Perfeito for their guidance, teaching and patience. I also want to thank to the members of the Data Science and Policy team as well as prof. Pedro Pita Barros, prof. Judite Gonçalves, prof. Cláudia Soares, prof. Qiwei Han, prof Íñigo de Troya, André Martins, João Santos, João Galinho, Pedro Neves, José Silva, Francisco Santos, Marta Santos, Beatriz Gonçalves, João Pedro Diamantino, Filipe Bravo, Paulo Matos, Rodrigo Barrela, Diogo Paleta, Patrícia Filipe, António Ramos and Francisco Castro for the valuable advices, insights and recommendations. Finally, I want to thank my family and friends for the inspiration and support throughout these past few months.
Can We Improve the Prediction of the Influenza
Onset and Save Money in the Process?
∗
João Cortes
January 2020
Abstract
Each year, up to 650 000 people die of respiratory diseases linked to seasonal flu world-wide and billions of dollars are spent in preventing and mitigating its impact. Much of this social and economic burden could be prevented if the beginning of the Influenza outbreak was timely known. This study predicts the outbreak’s commencement using a diverse range of data and then estimates the economic impact from a timely alarm of the outbreak’s ar-rival. Weekly maximum levels of precipitation along with fever and cough in the younger population were found among the most significant predictors of the onset.
Keywords: Influenza Onset; National Health; Machine Learning; Economic Impact
∗Nova School of Business and Economics. This work used infrastructure and resources funded by Fundacao
para a Ciencia e a Tecnologia (UID/ECO/00124/2013, UID/ECO/00124/2019 and Social Sciences DataLab, Project 22209), POR Lisboa (LISBOA-01-0145-FEDER-007722 and Social Sciences DataLab, Project 22209) and POR Norte (Social Sciences DataLab, Project 22209)
1
Introduction
Each year, the flu season affects the lives of millions of people worldwide, and up to 650 000 individuals die of respiratory diseases linked to seasonal flu. Many of these deaths could be prevented from proper warning and care. In Portugal, the National Health Service (NHS) alerts society of the flu outbreak, following the contingency plan as soon as it identifies the beginning of the flu season; however, given its complex behavior, the outbreak is rarely identified in a timely manner. These delays in identifying the outbreak increase the social and economic burden that the flu season brings, ranging from decreasing the benefits of prevention and increasing costs of treatment and overall management. Therefore, a timely knowledge of the Influenza-Like Illness (ILI) outbreak brings a decisive advantage in preparing both the national authorities and the general population to mitigate its impact.
This study intends to address this issue. Using data from ILI-related searched terms on Google; phone-call logs to the NHS, SNS24, we predict the onset (beginning) of the Influenza outbreak, in Portugal, while combining both classic and modern forecasting techniques. We also identify the most consistent predictors of the outbreak, regardless of the Season, from 2010 to 2015.
Knowing the onset period of the outbreak, we then estimate what would be the economic saving provided to the NHS if, in the 2018/2019 season, the official alarm of the outbreak com-mencement had been made at the onset, instead of at it’s peak (when the real official alarm was made). In this section, first, we explain the key issues behind Influenza and Current Alert Sys-tems; following, we describe the importance of an Economic Estimate; we walk through key main achievements from the Classic to Modern techniques; and finally we explain the approach used in this study.
1.1
Influenza and Current Alert Systems
Each year, the seasonal influenza virus results in 3 to 5 million cases of severe illness worldwide. Infants; pregnant women; citizens with heart diseases; respiratory infections; and elderly are among the groups mostly harmed by this illness. In Portugal, more than 3000 people died [9] from the flu in the 2017/2018 season. It is an issue posing a serious concern in the health and well-being of the population.
The Portuguese National Health Service (NHS) spends millions only in vaccines [10] each year to prevent and mitigate its effect in society. However, the diversity and unpredictability for each year’s predominant flu strain harms the effectiveness of the most annually common commercialized flu vaccines, only 30-60% effective(Source: ECDC). Complementary, the NHS monitors the flu behavior and the search for healthcare services, alerting the population of the influenza outbreak once possible. After providing an official warning [? ], the NHS follows a contingency plan [? ]. According to it, when the disease reaches a regional or widespread stage of development, the NHS warns health professionals and the general population of the influenza outbreak and prepares the materials and resources to face the outbreak. Before the flu season is declared, people that describe ILI symptoms are often directed to the primary care services. However, once the flu outbreak is declared, people describing the same symptoms, as long as they do not belong to a risk group, are asked to remain at home, avoiding overcrowding emergency rooms. National Health Authorities recommend to use the SNS24 phone service as first contact with the NHS. Thus, a timely onset identification is key in reducing overcrowding and even limiting disease transmission.
On top of official alerts rarely being made on time, the social awareness of the flu outbreak from the communication provided by the media and health authorities can increase the concern in the population over flu related symptoms, leading to an increase in the search for medical care thereafter.
The majority of the hospital emergency units are yearly overcrowded with patients suffering from respiratory infections. The majority of the population is not vaccinated, and thousands continue to suffer from this disease while doctors and other health professionals try to find new ways to find a cure and to better prepare health resources available.
As mentioned before, official alerts of the influenza outbreak are rarely made in time of the onset (period of the beginning of the outbreak) and can take as much as 6 weeks to be declared. In fact, in 6 of the periods where there were registered records of a widespread or regional outbreak (whichever registered first), from 2002 to 2014, only 2 of them registered an alert at the onset of the outbreak (lines in green) while all others were performed several weeks after. Figure 1.
Figure 1: Regional (in black) and Widespread (in Red) alerts of the Influenza Outbreak. Source: FluNet.
1.2
Importance of an Economic Estimate
As Authorities only proceed the contingency protocol weeks after the onset, NHS resources are further exhausted; fewer people with respiratory infections are made aware of the presence of the flu; and, while the need for extra care increases, more people are infected and more damaging it
becomes the effect of the influenza outbreak, both socially and economically.
It is thus crucial to search and find alternative means – both methods and materials - to forecast the onset of the Influenza Outbreak. If then the onset is identified successfully in real-time, it is also important to ascertain the economic impact of the accurately timed official alert.
it is also important to know which economic impact will this timely made official alert lead to society.
Influenza activity also brings several socioeconomic costs – from loss in productivity to private and public expenses in prevention and treatment. This study focuses on the costs that are carried by the NHS in order to better understand and measure its impact in society during Influenza Outbreaks. The NHS absorbs a significant portion of the population’s healthcare ser-vices and costs, with an accumulated economic burden of billions of euros [11]. In Portugal, 2014, almost 2.5 million (40%) [12] of all hospital emergency cases in public hospitals were not urgent.
If significant, a timely official alert advising population to phone dial SNS24 to avoid at-tending to the hospital emergency can significantly save money to the NHS, assuming the right message reaches the general population and people act accordingly.
1.3
Classic Models and datasources
Influenza virus evolves over time developing antigenic drifts (small changes to the genetic makeup) and shifts (large changes to the genetic makeup). As each outbreak depends on the predominant strain of the virus, predicting the onset is a complex issue. New and different ap-proaches are published yearly by several researchers worldwide in an attempt to improve and built on top of the knowledge developed in predicting the influenza outbreak. Though several studies are made in predicting the form, peak and intensity of the outbreak, few of them solely focus on predicting the onset.
Nsoesie et al(2013) [1] have developed “a systematic review of studies in forecasting the dynamics of influenza outbreaks” and summarized key influenza prediction approaches into: 1) Time Series Models; 2) Approaches in meteorology; 3) Compartmental Models; 4) Agent-based models and 5) Meta-population models. These models carry among them different strengths and weaknesses.
Compartmental models in epidemiology subdivide population according to disease states from which individuals transition to, depending on given rates. These are known for their sim-plicity and well-studied behavior. This study uses the susceptible–infectious–recovered (SIR) model, a compartmental model.
Tracking past values of Influenza-Like Illnesses (ILI), such as the EISN-ILI provided by the European Center for Disease Control, is a systematically reliable mechanism and traditionally used to forecast the influenza outbreak. However, frequently, these data sources only capture a portion of the population requiring medical care [2], describing it’s symptoms periods after it’s infection. Models using ILI data alone frequently suffer from sampling problems.
1.4
Current Models and Data Sources
More frequently, forecast models have included more diverse sources. In addition, the recent boom in world available data (big data), as well as statistical, technological and software de-velopments in machine learning and deep structured learning methods, has lead to an increase in the usage of these resources and techniques, significantly improving forecasting scores and surpassing classic models.
As the arrival of lower winter temperatures make the air become dryer and decrease air humidity [13] ILI transmission increases, weather information can be a strong a predictor for influenza activity. Intergovernmental organizations such as the World Health Organization and national institutions such as INRJ (Instituto Nacional Ricardo Jorge) in Portugal, keep track
of the change in climate variables to monitor its impact in flu activity. While some authors have found a significant correlation between the absolute humidity and temperature at the time of infection, others, such as Deyle et al (2016) [4] have defended to be a causal relationship between absolute humidity and temperature in driving influenza outbreaks globally.
In addition, health surveillance data has allowed to better detect the outbreak from the symp-toms described by patients. This allows for the anticipation of an increase in the number of hospital patients, as individuals only go to the hospital after feeling those symptoms for a period of time. Researchers such as Timpka et al (2014) [3] have found telenursing data to improve the overall performance for seasonal influenza outbreaks on a daily and weekly basis.
Search query based surveillance data, such as Google Trends, has become increasingly pop-ular in predicting diseases outbreaks in developing countries, as well as forecasting influenza. Despite being sensitive to media coverage, Google has claimed to be able to predict regional outbreaks of flu up to 10 days before reported by the US Centre for Disease Control [14].
Machine learning-based models for real-time prediction using these same data sources, along with others such as Social Media are improving past accuracy scores. Hopefully in the future, influenza forecasts can be made as operationally as the ones performed in extreme events or climate predictions.
1.5
The Approach Used in This Study
Literature solely focused in predicting the beginning of the flu is scarce. This study intends to address this issue. The early detection of the flu onset supports the timely provision of protocols, resources, and health professionals, providing guidance for the population and improving the monitorization of influenza, sparing lives and saving money in the process.
In order to improve the onset prediction, our approach, following the work by Gonçalves-Sá, Won et al (2017), combines both classical and modern models and data sources. After capturing
the onset using a modified version of the SIR model, where the transmission rate is sigmoidal-shaped, this same sigmoidal-shaped curve is then used to forecast the beginning of the epidemy using methods from Machine Learning libraries such as sklearn, from Python. Beyond past ILI data (ECDC), it is used Weather data (NOAA); telenursing data (SNS24) and Google Search data (GT) to identify the most relevant feature combinations to predict the influenza onset, from 2010 to 2015.
To provide an estimate of the economic impact from an in-time alert, first, it is tested whether the real alert made by the NHS is significant in affecting the number of patients with respiratory infections going to the hospital emergency units and, if so, by how much. This magnitude can then allow us to make an estimate of the economic impact from an ideal in-time alert in the season 2018/2019, ceteris paribus.
2
Data Collected
The five influenza related data sources for the prediction model were extracted from October 2010 to March 2015 and originated from independent sources. These include: 1) Influenza in-cidence rate per 100 000 inhabitants, collected from the EISN-ILI (2010-2015), and considered the ground truth for the prediction Model; 2) Climate information from the National Oceanic and Atmospheric Administration (NOAA)[15] 3) Phone calls logs made to SNS24, a service provided by the Portuguese National Health Service(NHS) [2]; 4) Google Trends search data for four key terms and 5) Influenza Official Alerts);
With the exception of climate related data, data sources were provided by the Data Science & Policy group, led by Prof. Joana Gonçalves de Sá.
The data sources used for the Economic Impact model originated from two independent public sources (for the Season 2018/2019). These include: 6) The ILI Incidence rate per 100 000 inhabitants) reported by ISNA (Instituto Nacional de Saúde Doutor Ricardo Jorge) (2019);
7) Number of ILI related patients in hospital emergency reported by Transparência NHS official, open source database. All data sources refer to activity in Portugal.
1. The total number of Influenza Like-Illness (ILI) infected individuals is originated from the European entity responsible for gathering and reporting data on ILI, the European Cen-tre for Disease Control (ECDC). This institution manages the European Influenza Surveillance Network (EISN) to which an international group of medical professionals are accountable for reporting the estimated number of ILI cases per 100,000 inhabitants of the previous week. This data source is used to form the model’s target variable and the feature of ILI cases from the previous week.
2. Weather information, extracted from the National Oceanic and Atmospheric Adminis-tration (NOAA), is commonly used for climate forecasts (and natural hazard occurrences). We used daily Temperature and Precipitation from Lisbon, the most populated city in the country, with a coastal climate (more than 3/4 of the Portuguese population lives in the coastline) and a latitude centered in the continental territory. Weather features include the weekly mean, median, variation, maximum and minimum of both Temperature and Precipitation in the city. Other data sources such as METAR data,information predominantly used by aircraft pilots, - provided by prof. Cláudia Soares and the Data Science and Policy group - were curated and prepared to be used in this study but, unfortunately, as these data sources were not complete, the NOAA database was the most viable alternative.
3. SNS24 is an on-call service provided by the Portuguese NHS, available 24 hours a day. It was established in 2007 with the purpose of providing recommendation, counselling and triage for health conditions and receives hundreds of thousands of calls yearly. From the symptoms described, clinical advice is given by a trained S24 nurse, selecting a specific health protocol from a computer algorithm. Each caller has only a small local fee when using this service. In each phone call is registered the date, age, gender of the caller, location, health condition protocol and notes from the nurse operators containing self-reported symptoms. Being extracted
from electronic registries of calls that use unique identifiers, S24 data has no information recall or misclassification bias. Following from the S24 expert advice provided in “Early and Real-Time Detection of Seasonal Influenza Onset“(2017)[2] all phone calls that activated one of the 15 protocols that could be caused by Influenza were listed (see Table S2, Gonçalves-Sá et al, 2017, [2]), and arranged in 11 key terms (listed in Table 2 in Appendix) where five age groups were divided: 0–4, 5–24, 25-64, above 25 years old, and regardless of age. All of the patient’s reported symptoms in free-text comments which contained one of the 11 words listed in Table 2 (in Appendix) were then accounted for and grouped according to the 6 predefined groups. In addition, phone calls where the “Síndrome Gripal” (Flu symptoms) protocol was attributed were also considered for the 6 age groups. – Capturing the joint expertise of the operator and the algorithm together to identify the flu outbreak, before the official alert is made. These calls were also weekly grouped. All the 42 generated time series were normalized by the absolute number of phone-calls to correct for the differences in total number of calls made during each season, varying annually depending on the media coverage of S24, period of alert and others.
4. Google Trends’ (GT) features indicate the frequency of searches for key influenza terms on Google. It captures a relative popularity of a search term over time in a data sources pre-viously normalized by Google. This data was obtained from Google Trends. Four flu related expressions are searched: "flu -vaccine" (gripe -vacina); "cough" (tosse); "cold" (constipação) and "fever" (febre), key symptoms intuitive to be identified and described by the majority of the population. To control for the change in Google’s search frequency through time, weekly num-ber of searches is normalized by the correspondent weekly numnum-ber of searches containing the expression "o a de". Table 2 in appendix includes a brief description of all variables considered for the Prediction Model.
5. Influenza Official Alerts are reported weekly by FluNet. Countries inform the dispersion state of the epidemic in five levels: -No activity; Sporadic; Local Outbreak, Regional Activity and Widespread Activity. For the purpose of this work the onset is considered to take place once
Regional Activity is reached, the period after is the alert period.
6. Since 1999, Instituto Nacional de Saúde Dr. Ricardo Jorge (ISNA) coordinates the net-work of sentinel medical doctors in Portugal, reporting the ILI Incidence Rate per 100 000 inhabitants. It is used the absolute number of infected for the 2018/2019 flu Season.
7. The Number of ILI related patients in hospital emergency is generated multiplying the weekly average rate of the number of emergency episodes diagnosed with respiratory infections by the weekly average number of emergency cases. Both sources are provided publicly by the Ministry of Health database: Transparência. It is used the absolute number of patients with respiratory infections for the 2018/2019 flu Season.
3
Methodology, Results & Discussion
This section is divided in 2 parts. The first walks through the methods carried and results achieved in the Prediction Model, discussing those results. The second presents the same steps for the Economic Impact Model.
3.1
Predicting the Onset of the Influenza Outbreak
3.1.1 Methods
The model used was based on previous work from the research Gonçalves-Sá, Won et al (2017) [2]. All calculations were performed in Python 3.6.8. This model receives as input influenza related data and outputs a normalized sigmoidal-shaped activation function, returning the like-lihood of the onset commencement. This likelike-lihood is then compared with the target function, generated using a Modified version of the SIR model. The Susceptible-Infected-Recovered model is a traditional compartmental model used in epidemiology grouping a population in 3 stages: Susceptible, Infected and Recovered. Individuals transition from each state by a given
rate. Susceptible individuals become infected by a transmission rate and Infected individuals are recovered by a recovery rate.(see Fig 1 [2]) The prediction model’s dependent variable is generated following a 2-step procedure :
Step 1. The weekly number of ILI infected individuals is fitted seasonally by using the integral of the differential equations (Equations (1) to (5)) from the modified version of the SIR model - where transmission rate follows a sigmoidal-like shape over time and is activated when the outbreak takes place. This allows to identify the exact moment when each season’s onset takes place. dS dt = − β SI N (1) dI dt = β SI N − γI (2) dR dt = γI (3) β (t) = γ + A 1 + e−(t−t0) (4) i0= I(t = 0) (5)
S, I and R are respectively the Susceptible, Infected and Recovered weights in a population of size N (N=1000); β and γ are correspondingly the transmission and recovery rates; and i0the
average number of infected individuals at the initial period. The methods odeint and curve_fit from the Scipy library were respectively used to integrate and fit the group of derivative func-tions (Eqs. (1) to (5)) into the registered weekly number of ILI infected. As the five seasons’
curve_fitmethod returned the optimal parameter values for A, t0(the onset week) and γ, reaching
an above 90% average Adjusted R2, each season’s transmission function became reproducible and extendable enough to be used as the prediction model’s target function. (Figure 4 in Ap-pendix). This mechanism allows to distinctly identify a two-period scenario – one before and the other after the onset (when the sigmoid function is activated). In the first scenario both the transmission (β ) and recovery rates (γ) are close to 0, β ' γ. In the second scenario β > γ as the transmission levels reach an epidemic state and the outbreak has taken place. Thus, the shifting period (where t = t0) is always located at the inflection of the SIR-shaped growth curve, after
which the influenza outbreak has begun.
Step 2. From each sigmoidal-shaped transmission rate identified, each function is respec-tively normalized and centered at the onset week for each season (subtracted by γ and divided by A, in this specific order), generating the Identified Onset (IO) function (6) - the dependent variable, or target function, of the prediction model(Equation 6). This signal function, similar to the transmission rate function, outputs the likelihood than the onset has taken place, (where IO(t) > 0.5), using t0 as the corresponding MSIR onset week, the inflection point of the In-fluenza infected individuals’ distribution per each season.
IOi(t) = 1
1 + e−(t−t0), i= Season (6)
Having captured each season’s IO function, we can use our independent features to predict the flu onset. From the 60 generated independent features (presented in table 2 in Appendix), different best feature combinations where then selected, xk(t)(ILI−1; Wr; S24; GT) and used to
minimize the residual difference between the target variable (IO) and the Predicted Onset (PO), recursively training and testing the model’s fitted weighted parameters {a, bk} in order to find
which feature combination most consistently was able to approximate the IO function behav-ior, regardless of the season. The Predicted Onset function follows a logistic-like regression
behavior:
POi(t) = 1
1 + ea+∑kbkxk(t), i= Season (7)
In order to find the best feature combination, it was used the Recursive Feature Elimina-tion(RFE) method from the sklearn library. This is a common machine learning method that recursively removes the weakest feature until finding the most significant feature combination. This method eliminates features based on the attribute importance found per feature. From the feature groups selected, the projected probability of the Logistic Regression model was tested in a Cross Validation alike process with each season divided in a different fold (k=5), reducing the bias and variance of the prediction model, with one season as test set and the remaining four as training set for each prediction. The quality of the fit was measured through the averaged root mean square error RMSE of the simulated test season, a measure of residual standard deviation commonly used in regression analysis, as used in Gonçalves-Sá, Won et al (2017)[2]. In addi-tion, different regularization techniques such as Ridge (l1) and Lasso (l2) were tested to avoid over-fitting the model while improving the final prediction. Finally, model hyper-parameters were optimized using the GridSearch[? ] method, commonly used in Machine Learning, where a proposed group of parameter combinations is exhaustively considered until the most efficient one is found.
3.1.2 Results from the Prediction Model
The Modified version of the SIR model allows us to combine both Classic and Modern pre-diction techniques. Through it, we’re able to recursively train and test a function (PO) over the normalized transmission rate (IO) until the most optimal residual difference between both functions is reached.
predictors of the influenza onset. The 60 generated features were subjected to a recursive search of relative relevance in order to find the most optimal combination possible (RFE) (See table 1). The projected probability of the Logistic Regression function allowed to find a consistent pattern within all the feature combinations used, coherent with the literature.
Table 1: Feature combinations recommended by the RFE process, using different regularization techniques
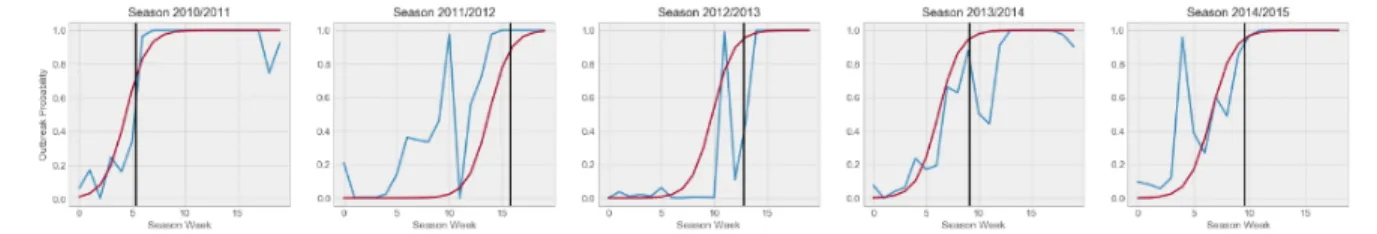
Consistently, calls describing symptoms of cough and fever, especially in individuals under 25 years old (’sn2’,’sn16’ and ’sn17’) were pointed out by the RFE method as most relevant (whether using a Ridge or Lasso regularization) and were effectively of the most significant features to predict the influenza outbreak (Combination nr 7, Table 3 in Appendix). The combination of these three variables using a Lasso Regularization with the variable ’Max_Rain’ -variable representing the weekly maximum level of rain in Lisbon – lead to the most significant feature combination, for the chosen metric, using only four features. The specific combination fever and cough has consistently been found to be among the best predictors to forecast influenza [6]. If all top 20 features recommended through RFE were to be selected as the most optimal for the final model, though the model could reach a low RMSE, non-relevant features could be creating noise in the model prediction, decreasing average significance per feature and the global minimum would not be reached. Though Combination nr. 15 (Table 3) has the lowest RMSE, each individual variable is on average less significant to predict the influenza onset in comparison to Combination nr. 7. As it can be seen in figures 2 and 5, both combinations
were significant in predicting the influenza onset (dark vertical line), and were activated after the onset week.
Figure 2: Predictions (PO), in blue, carried by the combination with the highest significance per feature. The Identified Onset (IO) is represented in red. Combination n.7, Table 2.
Both models using ’Var_Temp’ - temperature weekly variation in Lisbon or ’Max_Rain’ – maximum weekly precipitation in Lisbon, along with calls with symptoms of cough and fever, (under 25 years) were equally significant. Both abrupt decreases in temperature and low levels of humidity have indicated in the literature to be strong indicators when preceding an outbreak.
3.1.3 Discussion
Despite the variability in the projected probability of the influenza onset, forecasts are close to the IO function and the PO function is always activated after the alert week (Figure 2), the key goal of these predictions. There appears to be present a small group of features consistently sig-nificant to the model prediction (combination cough and fever under 25 years old - features ’sn2’, ’sn16’, ’sn17’). Though weather information used in this study was only limited to Lisbon, these features were among the most significant predictors, particularly the weekly maximum daily precipitation (’Max_Rain’). If future predictions use instead weather information from the 90% most populated areas, averaged by the number of residents per region, Climate informa-tion might play an even larger role in the forecast, improving the forecasts achieved. Informainforma-tion starting in the fall season can enhance these results as changes in weather conditions are felt more notoriously. In addition, different normalization techniques can affect significantly the removal
or not of non-intend noise in the data. Methods such as sklearn.preprocessing.StandardScaler are commonly used in alternative.
3.1.4 Limitations
While using the projected probability of the Logistic Regression function, it is possible that a lower global minimum can still be reached using the same input data. There can be used alternative training processes to find the optimal parameter values and possibly identify even more accurate coefficients, using the same feature combinations.
3.2
An Economic Measurement of a Timely Alert of the Flu Season
As the vast majority of patients in hospital emergency units with respiratory infections describe symptoms similar to influenza during the winter/flu season, determining the true infection rate is complex. Following from two decision analysis studies Smith et al (2002) [7] and Rothberg et al (2003) [8], during influenza outbreaks, 70% of patients hospital emergency rooms (ERs) with respiratory infections have the flu. If an official alert was made at the onset of the influenza outbreak instead of at its peak - as the vast majority of the official alerts carried in Portugal have been – and we assume only half of infected individuals stop attending the hospital after the signal: Multiplying 70% to the number of individuals with respiratory infections going to the hospital emergency from the onset to peak, 68 thousand people would not go to the hospital emergency rooms in the 2018/2019 flu season (Data source: Transparência).
Annually, the cost of the basic emergency services charged by the NHS to public hospitals is updated in accordance with expected historic values. Both in 2018 and 2019, basic emergency services had an expected value of 40e to the NHS. This price creates a national estimated average value appropriate to use as an averaged cost value nationally, assuming discrepancies in hospital attendances are already offset through this cost measure and this value does not inherit
any other profit measure other than the true cost of the services themselves.
If the previously calculated number of individuals not going to the hospital emergency were to be true, a timely official alert of the flu season would provide the NHS with an economic saving of approximately 2.7 million euros (40e * 68 thousand).
This analysis assumes that a change in the official alert period significantly affects the de-cision of half of all individuals willing to go to the hospital emergency in unison and leads consequently to a decrease in the number of attendances to the hospital emergency. However, it is unknown if the official alert provided by the Portuguese national health authorities has a significant impact in society’s decision to attend the hospital emergency in the first place and, if it does, if its average estimated impact is to decrease the number of attendances – the impact expected – or to increase the number of attendances to the hospital emergency.
In order to reach a more accurate estimate of the economic impact to the NHS from timely alerting the population of the true influenza onset, we must confirm if the official alert has a significant impact in affecting the number of people going to the hospital emergency in the first place. If significant, we can estimate the expected number of infected going to the hospital if the alert is made timely, following from the previously established relationship.
Only a portion of patients with respiratory infections attend the hospital emergency in rela-tionship to the national number of infected individuals. To be registered in the hospital emer-gency as infected, the patient attending needs to describe symptoms related to the infection and so it is assumed that only truly infected individuals are attending the hospital emergency. The number of ILI related patients in hospital emergency is known from Transparência. Using the information provided by the National Health Institute Dr. Ricardo Jorge (ISNA), we’re able to know the estimated number of ILI infected individuals per 100 000 Portuguese inhabitants. The official alert of the influenza season is publicly disposed in the NHS website. With this
information we’re allowed to propose the following relationship:
U(t) = α + ρ ∗ I(t) + φ ∗ S(t) + ω ∗ IS(t) +C (8)
Where U (t) represents the absolute number of infected individuals in the hospital emer-gency over time expressed in weeks; I(t) the number of infected individuals in Portugal per week; S(t) the dummy activated from the week where the signal (alert) is activated onwards; IS(t) represents the number of infected individuals from the week of the official alert onwards (the interaction term). C represents the control variables, included to guarantee stationarity in the model’s residuals. This includes the variables Winter(t) - dummy activated if the week is between December and March; and March(t) – dummy activated when the week corresponds to the month of March(t). α is a constant, representing the number of individuals going to the hos-pital emergency regardless of time or other factors considered. ρ represents the mean change in the number of people going to the hospital emergency unit for every additional infected person, through time, measured by t. φ represents the mean change in the number of people going to the hospital emergency unit when the alert has been made, regardless of the total number of infected individuals. ω represents the mean change in the number of people going to the hospital emer-gency unit for every additional infected individual in the country when the alert has been made. If the time series analysis assumptions apply, the coefficient and p-value of ω is interpretable and the alert will be significant if it’s p-value is lower than 0.01. When alerting the population not to attend the hospital emergency, the individuals to whom the official alert will have a true impact or not will be reflected in the significance and sine of the parameter from the variable IS(t). This model still assumes that a change in the official alert period does not significantly affect the total number of infected individuals per week, ceteris paribus.
To confirm that the time series analysis assumptions hold, equation 8 was subject to the Dickey Fuller test of its residuals (test over model’s stationary), presented in table 4 of the
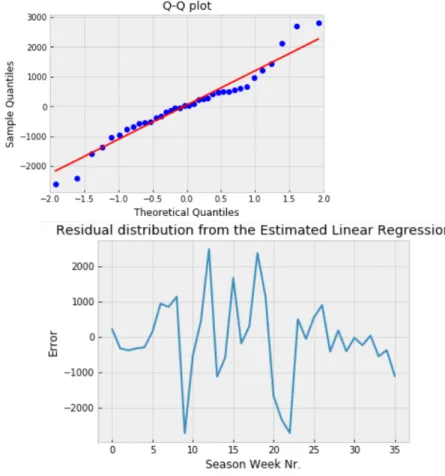
appendix. The test rejected the Null-Hypothesis of a unit root, meaning, the presence of non-stationarity in the relationship. In addition, model residuals were subject to the Shapiro-Wilk, Jarque-Bera and Anderson-Darling tests, presented with the Q-Q plot in figure 6 of the ap-pendix. No result rejected the Null-Hypothesis of normally distributed residuals. When perfom-ing the Breusch Godfrey test for serial correlation, the Null-Hypothesis of no serial correlation was not rejected (the p-value is the last value in table 7).
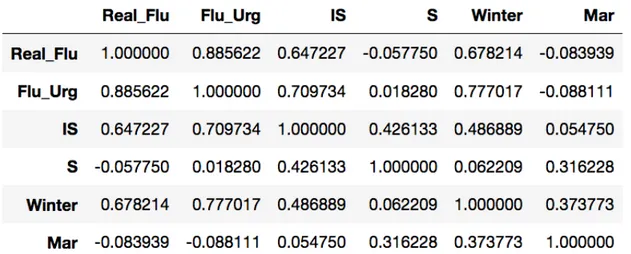
Accounting for the rejected null hypothesis of equal variance in errors (Homoskedasticity), it was used a robust measure of the linear relationship established above - the Robust Linear Model(RLM) method from the StatsModels documentation, performed under a Least Squares estimation. Only the weeks from October 2018 (when the Flu Season begins) to March 2019 (when the Flu outbreak ended) were considered - This is a relevant information for the inter-pretations hereinafter. Both I(t) and IS(t) parameters’ coefficients and p-values were robust across different tested control variable combinations. No pair of explanatory variables has a correlation higher than 71% (table 6 in appendix). As expected, the mean increase in number of patients for every additional number of infected is small and positive (magnitude of ρ). See table 5 in appendix. By 2.000 additional infected inhabitants, there is an expected increase of 1 additional individual going to the hospital emergency, regardless of the official alert provided by the NHS. The interaction term’s parameter, ω, presented itself significant (p − value < 0.01) and its coefficient was a robust positive 0.0005. This indicates that, for every additional 2.000 infected people after the official alert, the number of people going to the hospital emergency unit is expected to increase by 1.
The confidence interval of the interaction term’s parameter is never negative, including across different tested relationships. Since the p-value of ω is significant, we use these same estimators to measure an estimated number of patients going to the hospital emergency unit un-der different alert conditions. This variable, S0(t), will act according to the ideal official alert period, meaning, it will be 1 once the onset of the outbreak has taken place. IS0(t) will be the
Figure 3: Estimated Linear Regression produced by the RLM. The dark line is the week of the official alert
number of infected after the ideal alert period. In this way, if the alert had taken place at the onset, the number of individuals attending the hospital emergency, U0(t), would be given by the following relationship:
U0(t) = α + ρ ∗ I(t) + φ ∗ S0(t) + ω ∗ IS0(t) +C (9)
D(t) = U (t) −U0(t) (10)
D thus represents the difference in the estimated number of patients going to the hospital emergency, while comparing different alert periods. It is calculated by the difference of both equation’s total number of attendees to the hospital emergency units with t ∈ [0, 36] ∩ N, the weeks between the beginning and end of the outbreak, ceteris paribus. Since the outbreak began in the 40th week of the year, the difference in the expected number of patients going to the hospital, accounting for different alerting periods, is of 12 094. In this way, all else constant, the estimated economic impact from the timely signal is given by the number of patients going
multiplied by the average cost the national authorities carry per individual in the emergency units. Though it is not possible to know the individual cost each different public hospital had per specific patient where these particular symptoms where verified, as explained in page 18, the national average value from basic emergency services of (40e) can be used as a strong approximate. In this regard, an official alert of the flu outbreak at the onset of the 2018/2019 influenza season is estimated to provide an economic burden to the NHS of 483.771e, all else constant.
3.2.1 Discussion of the Results from the Economic Impact Measured
Unfortunately, the NHS database only includes data from 2016 onwards and so it is not possible to make interpretations from both results achieved (Prediction and Estimation model) combined since each analyses different time periods. Though this model exclusively considered the flu sea-son of 2018/2019, several relevant intertemporal factors may justify a possible increase in the number of attendances to the hospital emergency from an early official alert (though this model did not test for causality). Once national health authorities publicize the arrival of the outbreak, mass media communication is written, broadcasted and advertised. As society is made aware that the flu season has begun, it is possible that the attentional bias caused by the communication made leads individuals to become more prone to believe they’re experiencing ILI related symp-toms more frequently, leading to an increase in the relative number of individuals willing to attend the hospital emergency. While these results seem counter-intuitive, despite many health literacy action plans have been pursued in the past few years, according to the World Health Organization, Portugal is one of the European countries with the worse levels of health literacy. It can be possible that the communication of the outbreak is not reaching the vast majority of the population in the most effective way. Institutes such as Ricardo Jorge have alerted for the need to promote population’s literacy in resourcing for services such as SNS24, reducing the search over presential care. Further tests would be required to reach a better understanding over
this issue and the results achieved in this estimate. As these results were not tested for differ-ent seasons, several factors not accounted for in this study, can then explain better the results achieved.
3.2.2 Limitations
Model results were only specific to one Season. While residuals presented evidence of being normally distributed, stationary and not serially correlated, the evidence of Heteroskedasticity lead the usage of a Robust Linear Model where standard errors already take into account the present heteroskedasticity. This model assumes every other condition or attribute not included in the Linear Regression Model won’t be affected by a change in the period of the official alert.
4
Conclusions
In Portugal, official alerts by the National Health Service (NHS) of an influenza outbreak rarely are in-time of the true outbreak’s beginning. Timely knowledge of the onset makes the differ-ence in health policy action to prepare both the resources and the population to face the outbreak. The predictions made in this study were able to significantly identify the onset period. Calls to the NHS describing symptoms of cough and fever, particularly among the younger than 25 years old was a consistently recommended combination across the periods studied. Though weather information was only limited to the city of Lisbon, weekly maximum levels of rain were among the best onset predictors. If a national average of weather information is used instead for future forecasts, weather information can become an even more significant predictor of the outbreak. The regression analysis studying the strength of the relationship between the number of infected in the country and the number of patients infected, presented evidence of a positive relationship between the number of infected after the official alert and the number of patients in the hospital emergency unit infected. This differences-in-differences approach was tested after
aforemen-tioned tests in the regression were coherent with the time series model assumptions of stationar-ity; no perfect collinearstationar-ity; normality of residuals and no serial correlation. Results were robust across different estimates. Low health literacy in the population can be a possible explanation for these results. Nevertheless, results were only applicable to the Season of 2018/2019 and further testing in future research will more fundamentally explain the reached results.
The continuous improvement of technology and usage of better monitoring techniques of the population’s symptoms and Weather information can make the difference in future work and allow for an improvement of the onset prediction. If an effective communication is carried forward, this will save money in the process.
References
[1] Nsoesie, E., Brownstein, J., Ramakrishnan, N., Marathe, M. (2013). "A systematic re-view of studies on forecasting the dynamics of influenza outbreaks". Wiley Online Library. Influenza and Other Respiratory VirusesPages 309-316.
[2] Gonçalves-Sá, J., Won, M., Marques-Pita, M. and Louro, C. (2017) "Early and Real-Time Detection of Seasonal Influenza Onset". PLOS Computational Biology.
[3] Timpka T., Spreco A., Eriksson O., Dahlstrom O., Gursky E. A., Stromgren M., Holm E., Ekberg J., Hinkula J., Nyce J. M., Eriksson H. Predictive per- formance of telenursing complaints in influenza surveillance: a prospective cohort study in Sweden.(2014) Euro Surveill.. Volume 19. Issue 46.
[4] Deyle, E., Maher, M., Hernandez, R., Basu, S. and Sugihara, G. (2016) "Global environ-mental drivers of influenza". Proceedings of the National Academy of Sciences. Nov 2016, 113.
[5] Poirier C., Lavenu A., Bertaud V., Campillo-Gimenez B., Chazard E., Cuggia M., Bouzillé G. (2018) "Real Time Influenza Monitoring Using Hospital Big Data in Combi-nation with Machine Learning Methods: Comparison Study". JMIR Public Health Surveil-lance Systems2018;4(4)
[6] Monto S., Gravenstein S., Elliott M., Colopy M. and Schweinle J. (2000) "Clinical Signs and Symptoms Predicting Influenza Infection". Arch Intern Med.;160(21):3243–3247 [7] Smith, J. and Roberts, M. (2002) "Cost-effectiveness of newer treatment strategies for
influenza" The American Journal of Medicine Volume 113, Issue 4, Pages 300–307
[8] Rothberg,M., Bellantonio, S., Rose, D. (2003) "Management of Influenza in Adults Older than 65 Years of Age: Cost-Effectiveness of Rapid Testing and Antiviral Therapy". Ann Intern Med. 2003;139(5_Part_1):321-329
[9] Observador, 2019. "Mais de 3.000 pessoas terão morrido devido à gripe em Portugal no inverno passado".
[10] Jornal Médico, 2019. "Gripe: SNS já administrou mais de 430 mil doses de vacina".
[11] Peixoto, M. (2019). "SNS acumulou prejuízo de 2,3 mil milhões de euros em cinco anos". Jornal de Negócios.
[12] Santos, R. (2015). "Hospitais atenderam 40% de urgências desnecessárias em 2014" Público..
[13] Rettner, R. (2013). Live Sciences."Higher Humidity Lowers Flu Transmission".
[14] Helft, M. (2008) "Google Uses Searches to Track Flu’s Spread" New York Times
[15] NOAA. National Oceanic and Atmospheric Administration. Retrieved from the official website.
5
Appendix
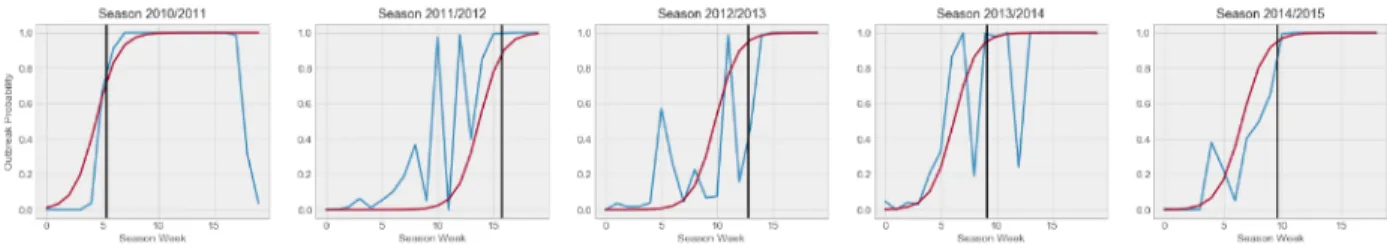
Figure 5: Predictions carried by the Model with the lowest RMSE. Combination nr.15
Table 3: Best Feature Combination models
Figure 6: Results from the distribution of the Robust Linear Model Residuals.
Table 5: ANOVA produced using a Robust Linear Model.