Food Science and Technology
DO:
D https://doi.org/10.1590/fst.02917 OSSN 1678-457X (Dnline)
1 Introduction
The buriti tree (Mauritia flexuosa) belongs to the family Arecaceae and is one of the most unique palm trees in Brazil, mostly found in flooded and wet areas in the country’s Center, North, and Northeast regions (Smith, 2015). From the tree’s leaves and stalks, fibers with excellent properties are extracted and its trunk produces an exudate that provides a gum made up of polysaccharides (Cantu-Jungles et al., 2015).
Gums can be defined in practical terms as molecules with high molecular weight featuring hydrophilic or hydrophobic characteristics, which usually have colloidal properties, and which are able to produce gels when combined with an appropriate solvent (Nussinovitch, 2010).
The gums from plant exudate are applied in several industrial segments. On the food industry, they are used in confectionery products with high sugar content and low moisture to prevent saccharose crystallization, besides as thickeners and emulsion stabilizers in salad dressings (Paraskevopoulou et al., 2005). They are also used in frozen products as mix stabilizers; in dehydrated products to protect important compounds such as vitamin C and anthocyanins and to improve solubility; as microencapsulants of aromas, dyes, and oils; in wine clarifying; and as emulsifiers in beverages and meat products (Nussinovitch, 2010).
The sorption thermodynamic properties, determined from those isotherms, provide a better understanding of the equilibrium between water and the solutes that make up the product, such as water affinity with the solutes and the spontaneity of the sorption process (Fasina, 2006). Moreover, they enable defining
the concept of order and disorder in water-solute systems (Rizvi & Benado, 1984).
Differential enthalpy or net isosteric heat of sorption defines the amount of heat released or absorbed during the sorption process at constant pressure and is used as an indicator of the strength of the bond between water and the solutes in the product (Moreira et al., 2008). When this heat is added up with the latent heat of vaporization of pure water, at a given temperature, the integral isosteric heat of sorption is obtained, i.e., the total energy required to transfer the water molecules in vapor state to a solid surface or vice versa (Fasina, 2006; Slavutsky & Bertuzzi, 2015). On turn, the differential entropy of a material is proportional to the number of sorption sites available, corresponding to a specific energy level, and indicates the state of mobility of the water molecules in the product (Moreira et al., 2008). Entropy describes the degree of disorder and randomness of movement of water molecules and has been used to explain the water sorption modes in biological materials (Mazza & LeMaguer, 1978).
Variations in enthalpy provide the measure of energy variation in the interaction between water molecules and the adsorbent. Entropy, on the other hand, can be associated with the binding or repelling of forces in the system and, consequently, with the spatial arrangement of the water-adsorbent relationship. Thus, entropy characterizes the degree of order or disorder in the water-adsorbent system (Xiao & Tong, 2013). Gibbs free energy is impacted by the thermodynamic properties, enthalpy, and entropy and indicates the energy spontaneity of the water-adsorbent interaction to provide the measure of energy availability in the
Thermodynamic properties of Buriti (
Mauritia flexuosa
) tree gum
Diego Aires da SOLVA1,2, Rosinelson da Silva PENA1*
Received 21 Jan., 2017 Accepted 02 Dec., 2017
1 Programa de Pós-graduação em Ciência e Tecnologia de Alimentos, Instituto de Tecnologia, Universidade Federal do Pará – UFPA, Belém, PA, Brasil 2 Departamento de Tecnologia de Alimentos, Centro de Ciências Naturais e Tecnologia, Universidade do Estado do Pará – UEPA, Belém, PA, Brasil
*Corresponding author: rspena@ufpa.br Abstract
Moisture adsorption and desorption isotherms from buriti tree gum (BG) were obtained at different temperatures (25 to 55 °C) in a water activity range of 0.1 to 0.9. The isotherms were classified as type OO. The hysteresis loop and moisture of the monolayer decreased as temperature increased and Halsey’s equation proved able to predict with good precision the product’s sorption isotherms in the conditions studied. BG’s isosteric heats of moisture adsorption and desorption were close to the latent heat of vaporization of pure water for moisture levels above 30 g/100 g db and exponentially increased below that level. The enthalpy-entropy compensation theory and the isokinetic relationship were applied and indicated that BG’s moisture adsorption and desorption processes are spontaneous. The integral sorption properties indicated that the increase in surface tension at BG’s moisture sorption sites was more representative for the desorption process.
Keywords: Mauritia flexuosa; isotherm; water sorption; enthalpy; entropy.
process. Of the value of this property is negative, the process is spontaneous, whereas it is non-spontaneous if the value is positive (Rizvi, 2005).
On face of that, this study aimed to investigate the hygroscopic behavior of the gum extracted from buriti tree trunk through moisture sorption isotherms obtained at different temperatures, as well as to assess the fit of mathematical models to the sorption data and determine the differential and integral thermodynamic properties of the interaction between water molecules and the product.
2 Materials and methods
2.1 Obtaining and purifying buriti tree gum
The raw exudate from buriti tree trunk (1 kg) was collected in April 2015 in Cametá Tapera island (Pará, Brazil) (2°09’02.77” S and 49°26’15.57” W). The exudate was collected from the trunk at 0.8 m from the ground and stored in polyethylene bags at 25 °C. On order to obtain the gum, the raw exudate was suspended in distilled water (1:10, w/v) at room temperature (≈ 25 °C) for dissolving for 24 h with no stirring. Next, the solution was filtrated with a 1 mm sieve and the filtrate was centrifuged at 2,778 x g for 10 min (Suprafug 22, Heraeus Sepatech). The impurities were discarded and the supernatant was added with absolute ethanol (1:3 gum:ethanol solution, v/v). The buriti tree gum (BG) (precipitate fraction) was dried in an oven with air circulation (50 °C/24h), ground, and stored in flasks at 25 °C.
2.2 BG centesimal composition
BG’s contents of moisture, ashes, lipids, and proteins (with a nitrogen-to-protein conversion factor of 6.25) were determined using methodologies recommended by the Association of Dfficial Analytical Chemists (2010). Total carbohydrates were determined by difference.
2.3 BG sorption isotherms
The moisture adsorption and desorption isotherms were obtained in a Vapor Sorption Analyzer (VSA) (Aqualab VSA, Decagon, WA, USA). A representative amount of the sample (600 to 800 mg) was weighed in a stainless steel capsule of the VSA using the equipment’s own micro analytical balance. The device was programmed to obtain the data in an adsorption-desorption cycle for a range of 0.1 to 0.9 aw by the Dynamic Vapor Sorption (DVS) method. The equilibrium condition was programmed for a change in mass per change in time (trigger %dm/dt value) below 0.05 for two consecutive measures. The equipment was programmed to obtain the equilibrium data in 0.05 aw intervals. After the analysis, the dry mass of the sample in the capsule was determined in an oven at 105 °C (Association of Dfficial Analytical Chemists, 2010). Osotherms were obtained at 25 °C, 35 °C, 45 °C, and 55 °C.
2.4 Sorption isotherms modeling
Monolayer moisture (mo) was determined for the adsorption
and desorption processes using the linearized BET equation (Brunauer et al., 1940) (Equation 1) and linear regression.
1 ( 1) . (1 ) − = + − w w
w o o
a C
a
a m m C m C (1)
where: m = moisture (g/100 g dry base - db); aw = water activity; mo = monolayer moisture (g/100g db), and C = constant related to the adsorption heat.
The following five three-parameter mathematical models (Equation 2-6) were fitted by nonlinear regression to the sorption data:
Modified Chung-Pfost: 1 ( ) ln ln( )
− +
= −
w
T b
m a
a c (2)
Modified GAB:
(1 ) 1
= − − + w
w w w
c
a ba
T m
c
ba ba ba
T
(3)
Modified Halsey:
1
exp( . ) ln( )
− +
= c w
a b T m
a (4)
Modified Henderson: 1 1 ln(1 ) ( ) = − − + c w m a
a T b (5)
Modified Oswin: 1 ( . ) 1 = + − c w w a m a b T
a (6)
where: m = moisture content (g/100 g db); aw = water activity;
T = temperature (K); terms a, b, and c are the parameters to be estimated by fitting.
2.5 Isosteric heat and differential entropy of sorption
The isosteric heat of sorption (Qst) is defined as the sum of
the heat of vaporization of pure water (ΔHvap) and the net isosteric
heat of sorption (qst) (Equation 7), which was determined from
the moisture sorption data using the integrated form of the Clausius-Clapeyron equation (Equation 8) and linear regression, assuming qst was independent of temperature (Rizvi, 2005; Xiao & Tong, 2013).
= + ∆
st st vap
Q q H (7)
( ) ( ) ln 1 − = W st m
d a q
d T R (8)
where: Qst = isosteric heat of sorption (kJ/kg); qst = net isosteric
heat of sorption (kJ/kg); ΔHvap = heat of vaporization of pure water at the average of the temperatures considered in this study (2,406.7 kJ/kg at 40 °C); aw = water activity; m = moisture content (g/100 g db); T = temperature (K); R = universal gas constant (0.4618 kJ/kg.K).
from the angular (ΔH/R) and linear (ΔS/R) coefficients of the straight ln(aw) versus 1/T for a constant moisture.
lnaw=∆S−∆H
R RT (9)
∆ = ∆ + ∆H G T S (10)
ln
∆ = −G RT aw (11)
where: ΔH = change in differential enthalpy (kJ/kg), ΔS = change in differential entropy (kJ/kg.K); ΔG = Gibbs free energy (kJ/kg).
2.6 Enthalpy-entropy compensation theory
On order to assess the effect of temperature on the sorption behavior, the following linear correlation between ΔH and ΔS was calculated (Equation 12).
β β
∆ = ∆H G + ∆T S (12)
where: Tβ = isokinetic temperature (K) and ΔGβ = Gibbs free energy at Tβ (kJ/kg).
On order to ratify the compensation theory, Krug et al., (1976) recommend a statistical test that compares the value of Tβ with the value of the harmonic mean temperature (Thm)
obtained by the Equation 13.
( )
1 1
=
∑
ihm nn
T
T (13)
where: ni is the number of isotherms. The enthalpy-entropy compensation theory can only be applied if Tβ ≠ Thm. When Tβ > Thm, the process is governed by enthalpy, otherwise (Tβ < Thm), it is
entropy that governs the process.
The following equations (Equation 14-16) were used for the statistical test, with 99% confidence interval to calculate Tβ
throughout the data range observed:
2, 2 ( )
β
β= ±m− a β
T T t Var T (14)
(
)(
)
(
)
2 β= ∆ − ∆ ∆ − ∆∆ − ∆
∑
∑
H H S S
T S S (15)
( )
(
)
( )(
)
2 2 2 β β ∆ − ∆ − ∆ = − ∆ − ∆∑
∑
H G T S
Var T
m S S
(16)
where: m = number of ΔH and ΔS data pairs; ∆H, ∆S, and ∆G are the mean values of enthalpy (kJ/kg), entropy, (kJ/kg.K), and free energy (kJ/kg), respectively. Of the harmonic mean temperature (Thm) value is within the range calculated for the isokinetic temperature (Tβ), the ratio between the ΔH and ΔS values
reflect only experimental errors. On that case, the existence of chemical and physical factors interfering in the process cannot be supported.
2.7 Integral properties
Spreading pressure (π) was calculated using the Equation 17.
0 θ
π=
∫
aww
m w
KT da
A a (17)
where: π = spreading pressure (J/m2); K = Boltzmann constant
(1.38×10⁻²³ J/K); A
m = the surface area of a water molecule
(1.06×10⁻¹⁹ m2); θ = ratio of moisture content (m) and monolayer
moisture content (mo).
Plugging Halsey’s equation (Equation 4) into Equation 17 and making an adjustment at the lower threshold of the integral for 0.05, since for aw = 0 the solution of the equation is undetermined,
yields Equation 18, which was used to calculate the π values for different temperature conditions. The π values corresponding to the range of 0-0.05 aw were corrected according to the analytical
procedure used by McMinn & Magee (2003).
( ) ( ) ( ) 1/ 1 1 0.05 exp ln 1 1
π= + − −
− w c a c w m o a bT KT a
A m c (18)
Net integral enthalpy (qin) (kJ/kg) was determined using
the integrated form of Equation 19 and linear regression, while Equation 20 was used to calculate the net integral entropy values (ΔSin) (kJ/kg.K).
( ) ( )ln1 π
∂
= −
∂ w in
a q
T R (19)
*
ln
∆ = − in−
in q w
S R a
T
(20)
where: *
w
a = geometric mean water activity at a constant π.
2.8 Statistical analysis
The software Statistica Kernel Release 7.1 was used for the linear and nonlinear regression procedures. On the nonlinear, the Levenberg-Marquardt algorithm was used with a convergence criterion of 10-6. The coefficient of determination (R2) and the
mean relative percentage deviation modulus (E) (Equation 21) were used to compare the fit precision of the models.
exp, , exp, 1 100 = − =
∑
n i pre ii i
m m
E
n m (21)
where: mexp,i = ith experimentally observed moisture content; mpre,i = ith predicted moisture content; n = number of observations.
3 Results and discussion 3.1 BG centesimal composition
3.36 g/100 g db ashes; 1.15 g/100 g db proteins; 0.36 g/100 g db lipids, and 95.53 g/100 g db carbohydrates.
3.2 BG sorption isotherms
Based on the behavior of the curves (Figure 1), all isotherms are classified as type OO (sigmoid-like isotherms) (Brunauer et al., 1940) and, in particular, they were more consistent with Langmuir-like type-OO isotherms according to the quantitative criterion proposed by Yanniotis & Blahovec (2009). Type-OO behavior was observed by Torres et al. (2012) for adsorption isotherms of carboxymethyl cellulose, guar gum, locust gum, tragacanth gum, and xanthan gum at different temperatures (20-65 °C). Melo et al. (2011) also observed type-OO sorption isotherms for the skin, pulp, and fibrous part of buriti (Mauritia flexuosa).
The moisture adsorption and desorption isotherms (Figure 1) show that the increase in temperature led to a decrease in equilibrium moisture for constant aw. According to Oglesias & Chirife (1982), the kinetic energy associated with the water molecules present in food matrices tends to increase with temperature, causing weaker attraction forces among water and solute molecules, which favors water molecules escaping and a decrease in moisture. Vishwakarma et al. (2011) found similar behaviors for moisture adsorption of guar gum (Cyamposis tetragonoloba).
The fits of the BET equation (Equation 1) to the experimental data (R2 > 0.99) yielded the values of monolayer moisture (m
o)
for the BG adsorption process at 7.17 g/100 g db (25 °C), 7.04 g/100 g db (35 °C), 6.06 g/100 g db (45 °C), and 6.02 g/100 g db (55 °C). The value of mo for adsorption indicates the moisture
at which the product will have the greatest stability in decay processes (Pavan et al., 2012). On turn, mo values for the desorption process were 9.74 g/100 g db (25 °C), 9.07 g/100 g db (35 °C), 8.79 g/100 g db (45 °C), and 7.20 g/100 g db (55 °C), with R2 > 0.98.
Removing water from BG, at moisture levels below the mo value of the desorption process, will require significantly higher amounts of energy than the latent heat of water vaporization, which might be too costly for a possible drying process (Mishra et al., 1996). The values of mo both for adsorption and desorption decreased as temperature increased. According to Oglesias & Chirife (1982), this behavior can be attributed to physical and chemical changes in the product induced by the increase in temperature. Furthermore, the increase in temperature raises the energy level of water molecules and increases the distance of the water-solute interaction sites, thus decreasing the stability of the water molecules (Palipane & Driscoll, 1993).
3.3 Mathematical modeling of sorption isotherms
According to Peng et al. (2007), values of E below 10% indicate good fits for practical purposes. Based on this criterion and on the R2 value, the modified Halsey and Dswin models (R2
> 0.97 and E < 8.3) had the best fits both to the BG adsorption and desorption data (Table 1). On addition, the modified GAB model (R2 > 0.97 and E < 11.1) also had good fits to the adsorption
data. For having the best mean value of E (E = 6.5) between the adsorption and desorption processes, the modified Halsey model was used to calculate the thermodynamic parameters. The good fits of that model to the BG moisture sorption data can be verified in Figure 2. The Halsey model was also the best in predicting the adsorption isotherm of guar gum (Cyamposis tetragonoloba) obtained from different parts of the guar seed (guar grain and guar splits) (Vishwakarma et al., 2011).
Figure 2 shows the formation of the hysteresis loop between the BG moisture adsorption and desorption isotherms for an aw range between 0.2 and 0.8. Ot can also be seen that this loop decreases as temperature increases, virtually disappearing at 55 °C. A similar behavior was observed by Mousa et al. (2014) for the sorption isotherms of Malaysian paddy (20-50 °C).
Countless qualitative propositions involving factors such as the presence of local metastable domains, fixation of molecules by chemisorption, phase transition, and capillarity phenomena can be used to explain the appearance of the hysteresis loop in sorption processes (Oglesias & Chirife, 1982).
3.4 Differential thermodynamic properties
The aw values calculated by the modified Halsey equation
for different levels of equilibrium moisture, in the range of 6 to 50 g/100 g db, and for different working temperatures were used
Figure 2. Moisture (○) adsorption and () desorption isotherms of buriti tree gum ((a) 25 °C, (b) 35 °C, (c) 45 °C, and (d) 55 °C) fitted by the modified Halsey model ((---) adsorption and (----) desorption).
Table 1. Parameters of mathematical modeling of sorption isotherms of buriti tree gum at different temperatures.
Parameter
Sorption process/Model (Equation number)
Adsorption Desorption
2 3 4 5 6 2 3 4 5 6
a* 0.09 6.42 4.85 1.0 x10⁻⁴ 33.36 0.10 7.27 6.41 1.0x10⁻⁴ 33.36
b* -157.12 0.94 -4.7x10⁻³ -10.66 -0.06 -217.16 0.91 -7.8x10⁻³ -144.28 -0.06
c* 404.96 8.9x10³ 1.52 1.10 2.09 288.46 1.0x10⁴ 1.68 1.28 2.09
R2 0.916 0.990 0.995 0.949 0.987 0.925 0.968 0.983 0.932 0.975
E 17.93 6.99 4.66 16.23 7.33 13.37 11.06 8.25 13.88 7.50
to estimate the isosteric heats and the differential entropies for the BG moisture adsorption and desorption processes. Values of R2 > 0.99, for the correlation ln a
w versus 1/T, at all moisture levels
studied, indicated the excellent fits of the Clausius-Clapeyron equation to the experimental data.
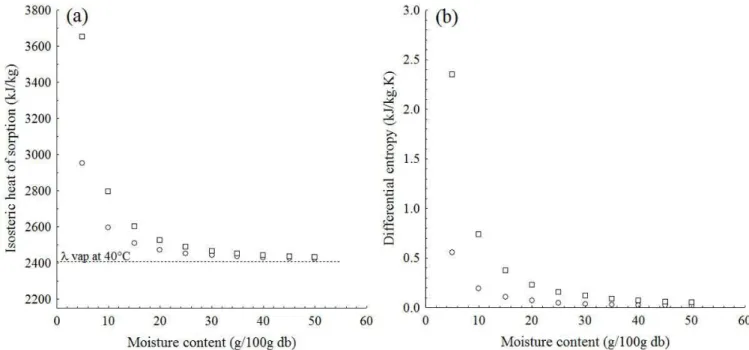
Figure 3a shows the behavior of the isosteric heat of sorption (Qst) as a function of moisture for the BG moisture sorption
processes. The curves show that, for moisture levels above 20 g/100 g db, the energy involved both in the adsorption and desorption processes is basically the latent heat of condensation (adsorption) or vaporization (desorption) of pure water. Below that moisture level, the Qst values for both processes exponentially
increase, which is more representative for moistures below 10 g/100 g db – the region where the product’s moisture monolayer (mo) is – for the adsorption (6.02-7.17 g/100 g db) and desorption
(7.20-9.74 g/100 g db) processes. At low moisture levels, several polar sites are active on the product’s surface, which favors a greater degree of water molecule binding and, consequently, a higher Qst value (Al-Muhtaseb et al., 2004). Similar behaviors for
the effect of moisture on Qst were observed by Pérez-Alonso et al.
(2006) for moisture sorption of blended carbohydrate polymers.
The Qst values for the desorption process were above those
observed for the adsorption process (Figure 3a) and the difference in energy of approximately 50 kJ/kg for a moisture level of 20 g/100 g db reached values above 700 kJ/kg for 5 g/100 g db. This behavior indicates a higher number of polar sites on the surface of BG during the desorption process, which involves greater binding energy compared to the adsorption process (Tsami, 1991). A similar behavior was observed by Benado & Rizvi (1985) for rice moisture sorption processes and by Al-Muhtaseb et al. (2004) for the moisture sorption of potato starch, high-amylopectin starch, and high-amylose starch.
Figure 3b shows the sorption differential entropy (ΔS) behavior as a function of equilibrium moisture for BG. According to the curves, there is a strong dependency between ΔS and equilibrium moisture below 20 g/100 g db, the region where the ΔS value exponentially increases, similarly to what is observed for Qst. The increase observed in ΔS is attributed to the
increase in moisture sorption intensity as moisture decreases. Since entropy is an index of irregularity in the sorption process, it can be said that the lower the BG moisture, the higher the irregularity in both the adsorption and desorption processes (Maleki Majd et al., 2013).
Similarly, to what occurred with isosteric heat (differential enthalpy) of sorption, the differential entropy values were higher for the desorption than for the adsorption process (Figure 3b) and the difference in ΔS value increased seven fold when moisture dropped from 20 to 10 g/100 g db. According to Al-Muhtaseb et al. (2004), the higher ΔS values observed for the desorption process indicate that, during this process, water molecules have greater mobility than during adsorption. Those authors observed a similar behavior for moisture sorption processes for potato starch, high-amylopectin starch, and high-amylose starch. According to Pérez-Alonso et al. (2006), entropy is not necessarily a measure of total order or disorder in the system, but rather a measure of the different levels of the adsorption/desorption process.
3.5 Enthalpy-entropy compensation
The enthalpy-entropy compensation theory was used to assess the relationship of physical and chemical phenomena in the BG moisture sorption process. The theory establishes that, in order to minimize changes in free energy due to those phenomena, compensation occurs through a change in ∆H or ∆S values from
Figure 3. Ososteric heat (a) and differential entropy (b) of (○) adsorption and (□) desorption of buriti tree gum as a function of equilibrium
the nature of the interaction between the solute and the solvent and, therefore, the relationship between ∆H and ∆S for a specific reaction follows a linear behavior (Hercigonja & Rakic, 2015).
From the linear regression of Equation 12, the values of isokinetic temperature (Tβ) and Gibbs free energy at Tβ (ΔGβ) were obtained at 495.9 K and -205.0 kJ/kg (R2 = 0.98) for the
moisture adsorption process and 330.0 K and -137.6 kJ/kg (R2 = 0.99) for the moisture desorption process of BG. T
β
values for the sorption processes different from the harmonic mean temperature (Thm = 312.7 K) validate the application of
the compensation theory in the present study. On turn, the fact that Tβ was greater than Thm both for adsorption and desorption indicates that both processes are governed by enthalpy (Krug et al., 1976). Moreover, values of ΔGβ < 0 indicate that both processes are spontaneous (Slavutsky & Bertuzzi, 2015) and suggest strong intermolecular or binding interactions between water molecules and the product (related to enthalpy), which promotes a greater reduction in configurational freedom of the water molecules and, hence, a greater order in the system (related to entropy) (Xiao & Tong, 2013). Velázquez-Gutiérrez et al. (2015) have applied the isokinetic theory to assess moisture sorption processes of mucilage for chia seeds and observed that those processes are also controlled by enthalpy.
3.6 Integral thermodynamic properties
The net integral enthalpy of sorption (qin) and net integral
entropy of sorption (ΔSin) were determined in a similar manner
as those employed to determine the differential properties of sorption, however, in this case, the spreading pressure property was used instead of equilibrium moisture. The property π represents the excess free energy on the surface and provides
an indication of the increase in surface tension at the sorption sites due to the adsorbed molecules (Tsuji et al., 2008).
The values of π increase with aw for both the BG moisture
adsorption and desorption processes (Figure 4) for the whole range of aw and temperature studied. On addition, it can be observed that, for the same aw level, the value of π for desorption
(Figure 4b) was always higher than for adsorption (Figure 4a) and decreased as temperature increased, an effect which was more representative of the desorption process. Similar behaviors were observed by McMinn & Magee (2003).
Figure 5 shows the values of qin and ΔSin as a function of equilibrium moisture for the BG moisture adsorption and desorption processes at the mean working temperature (40 °C). For low moisture levels, the value of qin increased until reaching a maximum of 359.9 kJ/kg at 9.57 g/g db moisture for adsorption and 669.2 kJ/kg at 11.72 g/g db moisture for desorption, then it gradually decreased for higher moisture levels (Figure 5a). According to McMinn & Magee (2003), the low qin values observed for low moisture levels are attributed to the occupation of sorption sites on the outermost surface of the product. As moisture increased, stronger bonds occur among water molecules and polar sites on the surface, which causes an increase in qin until a maximum value is reached, when those
sites are fully covered. From that point onwards, less favorable bonds of water with the product’s surface sites and the formation of multilayers cause a progressive decrease in qin value. A similar
behavior was observed by Torres et al. (2012) for the adsorption process of guar, locust bean, and xanthan gums.
For low moisture levels, the value of ΔSin decreased until reaching a minimum of -0.83 kJ/kg at 13.94 g/g db moisture for adsorption and -1.79 kJ/kg at 13.11 g/g db moisture for desorption, then it gradually increased for higher moisture levels
Figure 4. Spreading pressure of adsorption (a) and desorption (b) process for buriti tree gum as a function of water activity at (○) 25 °C, (□) 35 °C,
References
Al-Muhtaseb, A. H., McMinn, W. A. M., & Magee, T. R. A. (2004). Water sorption isotherms of starch powders: Part 1: mathematical description of experimental data. Journal of Food Engineering, 61(3), 297-307. http://dx.doi.org/10.1016/S0260-8774(03)00133-X. Association of Dfficial Analytical Chemists – ADAC. (2010). Official
methods of analysis of the Association of Official Analytical Chemists.
(18th ed.). Gaithersburg: ADAC.
Benado, A. L., & Rizvi, S. S. H. (1985). Thermodynamic properties of water on rice as calculated from reversible and irreversible isotherms. Journal of Food Science, 50(1), 101-105. http://dx.doi. org/10.1111/j.1365-2621.1985.tb13286.x.
Brunauer, S., Deming, L. S., Deming, W. E., & Teller, E. (1940). Dn a Theory of the van der Waals Adsorption of Gases. Journal of
the American Chemical Society, 62(7), 1723-1732. http://dx.doi.
org/10.1021/ja01864a025.
Cantu-Jungles, T. M., Almeida, C. P., Oacomini, M., Cipriani, T. R., & Cordeiro, L. M. C. (2015). Arabinan-rich pectic polysaccharides from buriti (Mauritia flexuosa): An Amazonian edible palm fruit.
Carbohydrate Polymers, 122, 276-281. http://dx.doi.org/10.1016/j.
carbpol.2014.12.085. PMid:25817669.
Fasina, D. D. (2006). Thermodynamic properties of sweetpotato. Journal
of Food Engineering, 75(2), 149-155. http://dx.doi.org/10.1016/j.
jfoodeng.2005.04.004.
Hercigonja, R., & Rakic, V. (2015). Enthalpy-entropy compensation for n-hexane adsorption on Y zeolite containing transition metal cations. Science of Sintering, 47(1), 83-88. http://dx.doi.org/10.2298/ SDS1501091H.
Oglesias, H. A., & Chirife, J. (1982). Handbook of food isotherms: Water
sorption parameters for food and food components. New York:
Academic Press.
Krug, R. R., Hunter, W. G., & Grieger, R. A. (1976). Enthalpy-entropy compensation. 1. Some fundamental statistical problems associated (Figure 5b). The reduction in ΔSin value is related to the increase
in the restriction of movement (loss of rotational freedom or degree of randomness) of water molecules until the more available surface sites become saturated and the polar sites (strong bonds) are fully covered. The minimum values observed correspond to the formation of the monolayer, while the increase in ΔSin value observed from that moisture level onwards is attributed to the increase in mobility of water molecules and to the formation of multilayers (McMinn & Magee, 2003). A similar behavior was observed by those authors for potato moisture sorption and by Benado & Rizvi (1985) for rice sorption process.
4 Conclusion
The BG moisture sorption isotherms were classified as type OO at the temperature range studied. The increase in temperature caused a decrease in equilibrium moisture for the same aw level
and also influenced hysteresis, which was pronounced at 25 °C and virtually disappeared at 55 °C. The modified Halsey model satisfactorily described the experimental data of BG moisture sorption. A linear correlation was observed between enthalpy and entropy in the BG moisture adsorption and desorption processes. The isosteric heats of BG moisture adsorption and desorption decreased as moisture increased and reached values equivalent to the latent heat of vaporization of pure water at moisture above 30 g/100 g db. The behavior of entropy of the sorption system indicated a greater interaction of water molecules and BG for moisture levels below 20 g/100 g db. On turn, the integral sorption properties indicated an increase in surface tension at BG’s moisture sorption sites due to the water molecules adsorbed, which was more representative for the desorption than for the adsorption process. On addition, the isokinetic relationship indicated that both BG moisture adsorption and desorption are spontaneous processes.
Figure 5. Net integral (a) enthalpy and (b) entropy of (○) adsorption and (□) desorption of buriti tree gum as a function of equilibrium moisture
Porto, B. C., & Cristianini, M. (2014). Evaluation of cashew tree gum
(Anacardium occidentale L.) emulsifying properties.
Lebensmittel-Wissenschaft + Technologie, 59(2), 1325-1331. http://dx.doi.
org/10.1016/j.lwt.2014.03.033.
Porto, B. C., Augusto, P. E. D., & Cristianini, M. (2015). A Comparative study between technological properties of cashew tree gum and arabic gum. Journal of Polymers and the Environment, 23(3), 392-399. http://dx.doi.org/10.1007/s10924-014-0698-z.
Rizvi, S. S. H. (2005). Thermodynamic properties of foods in dehydration. On M. A. Rao, S. S. H. Rizvi, & A. K. Datta (Eds.), Engineering
Properties of Foods (pp. 1-88). Boca Raton: Taylor & Francis. http://
dx.doi.org/10.1201/9781420028805.ch7.
Rizvi, S. S. H., & Benado, A. L. (1984). Thermodynamic properties of dehydrated foods. Food Technology, 38, 83-92.
Slavutsky, A. M., & Bertuzzi, M. A. (2015). Thermodynamic study of water sorption and water barrier properties of nanocomposite films based on brea gum. Applied Clay Science, 108, 144-148. http://dx.doi. org/10.1016/j.clay.2015.02.011.
Smith, N. (2015). Palms and People in the Amazon (pp. 341-381). Switzerland: Springer Onternational Publishing.
Torres, M. D., Moreira, R., Chenlo, F., & Vázquez, M. J. (2012). Water adsorption isotherms of carboxymethyl cellulose, guar, locust bean, tragacanth and xanthan gums. Carbohydrate Polymers, 89(2), 592-598. http://dx.doi.org/10.1016/j.carbpol.2012.03.055. PMid:24750763. Tsami, E. (1991). Net isosteric heat of sorption in dried fruits. Journal
of Food Engineering, 14(4), 327-335.
http://dx.doi.org/10.1016/0260-8774(91)90022-K.
Tsuji, M., Nakahara, H., Moroi, Y., & Shibata, D. (2008). Water evaporation rates across hydrophobic acid monolayers at equilibrium spreading pressure. Journal of Colloid and Interface Science, 318(2), 322-330. http://dx.doi.org/10.1016/j.jcis.2007.10.047. PMid:18048050. Velázquez-Gutiérrez, S. K., Figueira, A. C., Rodríguez-Huezo, M.
E., Román-Guerrero, A., Carrillo-Navas, H., & Pérez-Alonso, C. (2015). Sorption isotherms, thermodynamic properties and glass transition temperature of mucilage extracted from chia seeds (Salvia
hispanica L.). Carbohydrate Polymers, 121, 411-419. http://dx.doi.
org/10.1016/j.carbpol.2014.11.068. PMid:25659716.
Vishwakarma, R. K., Shivhare, U. S., & Nanda, S. K. (2011). Moisture adsorption isotherms of guar (Cyamposis tetragonoloba) grain and guar gum splits. Lebensmittel-Wissenschaft + Technologie, 44(4), 969-975. http://dx.doi.org/10.1016/j.lwt.2010.09.002.
Xiao, Q., & Tong, Q. (2013). Thermodynamic properties of moisture sorption in pullulan–sodium alginate based edible films. Food
Research International, 54(2), 1605-1612. http://dx.doi.org/10.1016/j.
foodres.2013.09.019.
Yanniotis, S., & Blahovec, J. (2009). Model analysis of sorption isotherms.
Lebensmittel-Wissenschaft + Technologie, 42(10), 1688-1695. http://
dx.doi.org/10.1016/j.lwt.2009.05.010. with the analysis of van’t Hoff and Arrhenius data. Journal of Physical
Chemistry, 80(21), 2335-2341. http://dx.doi.org/10.1021/j100562a006.
Maleki Majd, K., Karparvarfard, S. H., Farahnaky, A., & Jafarpour, K. (2013). Thermodynamic of water sorption of grape seed: temperature effect of sorption isotherms and thermodynamic characteristics. Food
Biophysics, 8(1), 1-11. http://dx.doi.org/10.1007/s11483-012-9274-z.
Mazza, G., & LeMaguer, M. (1978). Water sorption properties of yellow globe onion (Allium cepa L.). Canadian Institute of Food Science
and Technology Journal, 11(4), 189-193. http://dx.doi.org/10.1016/
S0315-5463(78)73269-4.
McMinn, W. A. M., & Magee, T. R. A. (2003). Thermodynamic properties of moisture sorption of potato. Journal of Food Engineering, 60(2), 157-165. http://dx.doi.org/10.1016/S0260-8774(03)00036-0. Melo, W. S., Pena, R. S., Rodrigues, A. M. C., & Silva, L. H. M. (2011).
Hygroscopic behavior of buriti (Mauritia flexuosa) fruit. Food
Science and Technology (Campinas), 31(4), 935-940. http://dx.doi.
org/10.1590/S0101-20612011000400017.
Mishra, V. K., Doraiul, B., & Temelli, F. (1996). Physical characterization and water sorption of freeze dried dulse palmaria palmata powder.
Journal of Food Processing and Preservation, 20(1), 25-39. http://
dx.doi.org/10.1111/j.1745-4549.1996.tb00338.x.
Moreira, R., Chenlo, F., Torres, M. D., & Vallejo, N. (2008). Thermodynamic analysis of experimental sorption isotherms of loquat and quince fruits. Journal of Food Engineering, 88(4), 514-521. http://dx.doi. org/10.1016/j.jfoodeng.2008.03.011.
Mousa, W., Ghazali, F. M., Jinap, S., Ghazali, H. M., & Radu, S. (2014). Sorption isotherms and isosteric heats of sorption of Malaysian paddy. Journal of Food Science and Technology, 51(10), 2656-2663. http://dx.doi.org/10.1007/s13197-012-0799-4. PMid:25328208. Nussinovitch, A. (2010). Plant gum exudates of the world: sources,
distribution, properties, and applications. Boca Raton: CRC.
Palipane, K. B., & Driscoll, R. H. (1993). Moisture sorption characteristics of in-shell macadamia nuts. Journal of Food Engineering, 18(1), 63-76. http://dx.doi.org/10.1016/0260-8774(93)90075-U.
Paraskevopoulou, A., Boskou, D., & Kiosseoglou, V. (2005). Stabilization of olive oil - lemon juice emulsion with polysaccharides. Food Chemistry, 90(4), 627-634. http://dx.doi.org/10.1016/j.foodchem.2004.04.023. Pavan, M. A., Schmidt, S. J., & Feng, H. (2012). Water sorption behavior and thermal analysis of freeze-dried, Refractance Window-dried and hot-air dried açaí (Euterpe oleracea Martius) juice.
Lebensmittel-Wissenschaft + Technologie, 48(1), 75-81. http://dx.doi.org/10.1016/j.
lwt.2012.02.024.
Peng, G., Chen, X., Wu, W., & Jiang, X. (2007). Modeling of water sorption isotherm for corn starch. Journal of Food Engineering, 80(2), 562-567. http://dx.doi.org/10.1016/j.jfoodeng.2006.04.063. Pérez-Alonso, C., Beristain, C. O., Lobato-Calleros, C.,