Flow Measurement and Instrumentation 75 (2020) 101789
Available online 30 July 2020
0955-5986/© 2020 The Authors. Published by Elsevier Ltd. This is an open access article under the CC BY license (http://creativecommons.org/licenses/by/4.0/).
Development of an experimental setup for microflow measurement
using interferometry
Elsa Batista
a,*, Isabel Godinho
a, Rui F. Martins
b, Ricardo Mendes
a, Jo˜ao Robarts
baVolume and Flow Laboratory (LVC), Portuguese Institute for Quality, IPQ, Portugal bUNIDEMI, Faculdade de Ciˆencias e Tecnologia, Universidade Nova de Lisboa, Portugal
A R T I C L E I N F O Keywords: Microflow measurement Interferometry Calibration Measurement uncertainty A B S T R A C T
The precise measurement of micro and nanoflow of incompressible liquids (below 1 μL/h) is a complex task due to several factors involved in, namely, evaporation, adsorption and the existence of air bubbles within the system. Nevertheless, the importance of its measurement is undeniable in equipment such as insulin pumps, or medical drug delivery devices for new-born, microchip flow pumps, to mention few.
The work herein presented was developed in a partnership between the Volume and Flow Laboratory (LVC) of the Portuguese Institute of Quality (IPQ) and the Department of Mechanical and Industrial Engineering (DEMI) of The New University of Lisbon under the project MeDD II – Metrology for Drug Delivery. It had the main objective of conceiving a new Portuguese standard for the measurement of ultra-low flow using interferometry, with a target uncertainty of 1% (k = 2). Therefore, the new setup relies on an interferometer made up of a laser unit, two retroreflector cubes, one beam splitter, as well as a flow generator (a Nexus syringe pump) and a computer for data acquisition.
Experimental tests on a Flow generator and a Coriolis flow meter were carried out at different flow rates. With the innovative methodology developed during the present research, it was possible to measure flow rates of an incompressible fluid (water) down to 1 μL/h with an uncertainty of 3% (k = 2).
1. Introduction
The most common calibration method used by the National Metrology Institutes (NMI) for measuring low flow rates of fluids is the gravimetric method, which consists in the determination of the mass of a liquid during a period of time. This methodology is used by the Volume and Flow Laboratory of the Portuguese Institute for Quality in a range down to 120 μL/h with a expanded uncertainty of 3% (CMC published at BIPM-JCRB website), being well defined in several publications, such as H. Bissig et al. [1], and E. Batista et al. [2,3]; moreover, the calculation of the uncertainty is described in detail in Ref. [4,5]. The lowest flow rate measurement capability found to date in a National Metrology Institute was achieved by the Swiss Federal Institute for Metrology (METAS), the NMI in Switzerland, down to 6 μL/h with an uncertainty of 0.7%. However, there is still the need to scale-down the measurement capabilities with the appropriate uncertainty due to the working range of microflow devices already in the market and in use in medical and pharmaceutical applications. Several investigations are now focused on
the development of new calibration methodologies using novel and innovative approaches to this challenge. This is one of the objectives of the new EMPIR (European Metrology Programme for Innovation and Research) project MeDDII – Metrology for Drug Delivery, to develop new traceable techniques for measuring flow rates, from 5 nL/min to 100 nL/min, using Newtonian liquid. For steady flow rates an uncer-tainty of 1% (k = 2) or better is expected, whereas for fast changing flow rates an uncertainty of 2% (k = 2) or better is expected. This project will also investigate different flow rate regimes, liquid mixing behaviour and occlusion phenomena in multi-infusion systems with the purpose of improving dosing accuracy in each infusion line [6].
Several authors have developed work in this field, A. Donges [7] presented a sensor for measuring volume and velocity of dispensed nanolitre droplets in a non-contact manner on the fly. The principle is based on the interaction of dispensed single droplets of sample liquid passing by the electric field of an open plate capacitor. The effect de-pends on droplets parameters like volume, velocity and dielectric con-stant. The sensor enabled accurate measurement of the volumes of * Corresponding author.;
E-mail addresses: ebatista@ipq.pt (E. Batista), igodinho@ipq.pt (I. Godinho), rfspm@fct.unl.pt (R.F. Martins), ricardom@ipq.pt (R. Mendes), j.robarts@campus. fct.unl.pt (J. Robarts).
Contents lists available at ScienceDirect
Flow Measurement and Instrumentation
journal homepage: http://www.elsevier.com/locate/flowmeasinsthttps://doi.org/10.1016/j.flowmeasinst.2020.101789
dispensed nanoliter droplets in the range (26–82) nL with an accuracy of ΔV = ± 3 nL.
M. Ahrens [8] presented a setup that relied on a telecentric imaging system mounted on a high precision linear stage to track a moving liquid meniscus in a glass capillary. The method proposed by this author can be used for the continuous measurement of ultra-low flow rates, down to 0.3 μL/h, with an extended uncertainty better than ±8.3% for mea-surement times equal to or longer than 60 s. The uncertainty approached asymptotically to ±5.4% for measurement times longer than 300 s or flow rates higher than 3 μL/h.
D. Liang [9] proposed a novel measurement method based on the gravimetric principles adapted from the ASTM E542 [10] and ISO 4787 [11] standards for quantitative volume determination in the sub-microliter range. The novel method presented in this work is based on the linear regression analysis of continuously monitored gravimetric results, and, therefore, was referred to as “gravimetric regression method (GRM)”. An expanded uncertainty of about 30% was obtained for measured volumes of 40 nL.
K.J.A. Westin [12] reported an experimental system for liquid flow rate measurement of pressure-driven flow through micro-channels. The displacement of a meniscus was tracked using a laser distance meter mounted on a feed-back controlled traversing stage. Successful mea-surements of flow rates as small as 0.0018 μL/h were reported when using non-evaporative hexadecane, and evaporative fluids such as ethanol were measured at flow rates of 0.36 μL/h. This methodology spiked interest, not only for the results, but for the way flow rate was calculated, having generated the idea of determining microflow mea-surement with interferometry.
In fact, laser interferometry is used to measure the intensity of a wave resulting from the overlapping of two or more waves that have travelled over different distances and are superimposed on a single point [7].
On the broader sense, an interferometer (Fig. 1a) is an optical arrangement in which two or more light waves are caused to interfere. An incident laser beam is split into two coherent sub-beams at the beam splitter, which has a partially reflective surface (50% goes through to Mirror 2 and 50% is reflected to Mirror 1) (Fig. 1b). If mirror 2 (Fig. 1b) is moved along the x-direction, then the interference pattern, i.e., a system of bright and dark fringes, moves in the detector plane.
If the two beams are shifted exactly an integer multiple of a wave-length against each other, the interference pattern is the same as before the shift. Therefore, an interferometer can determine distances in mul-tiples of laser wavelength [7].
In the work herein presented, an interferometer was used to monitor the distance travelled by a pusher block of a flow generator connected to a glass syringe in order to determine the flow rate.
2. Experimental setup
The use of interferometry for flow measurement involved the use of
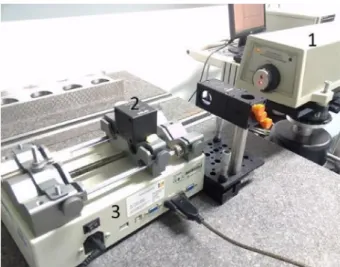
the following components: a laser unit with a detector incorporated, an optical arrangement composed by two retroreflector cubes (one of which with a beam splitter attached), a Control Unit, a pusher block, a Nexus 3000 pump (flow generator) and a glass syringe. The following Figs. 2 and 3 describes the experimental setup.
In practice, the generation of flow was accomplished by a stepper motor which drove a screw connected to a pusher block that itself pushed the syringe piston. One of the reflector cubes was added on top of this pusher block (see Fig. 2, legend 2). Therefore, knowing the internal diameter of the syringe, the travelled distance, and the time needed for that travelled distance (elapse time), it was possible to calculate the flow rate of the fluid inside the syringe and its associated uncertainty.
The laser unit used is from Hewlett-Packard, model 5528A; it
Fig. 1. a) Michelson interferometer.; b Representation of an interferometer operation).
Fig. 2. Picture of the experimental setup, where 1 is the Laser unit, 2 is one of
the retroreflector cubes, 3 is the Nexus pump.
Fig. 3. Scheme of the Nexus pump detail, where 4 is the glass syringe, and 5 is
operates at 633 nm, and the signal is processed using a LabVIEW application. The flow generator, as previously stated, is a high- performance syringe pump series Nexus 3000, conceived and designed to generate microflows down to 1.56 pL/min (equivalent to approxi-mately 0.094 nL/h).
A special component developed in polystyrene with a 3D printer (nexus adjuster - in Fig. 4) was attached to the Nexus pusher block of the syringe in order to support the retroreflector cube and an extra mass. This assembly will reduce the vibrations caused by the pusher block screw pulsations that affect the distance readings accuracy.
The final assembly of the interferometer setup is presented in Fig. 5.
3. Theoretical model and calculation of uncertainty
The flow in the presented setup is expressed by (Q) [13] and can be given by equation (1):
Q = v × A (1)
where v is the velocity of the fluid and A is the internal cross-section area of the syringe (πr2), assumed to be circular in all its range without any elliptical default. This information supplied by the manufacturer was verified through volume measurements performed gravimetrically in the Volume Laboratory. Also, during the syringe calibration no leakage was found between the piston and the cylinder and the obtained results were all according to manufacturer specifications. Moreover, velocity is obtained by dividing the displacement of the syringe piston (d) through a period (t); hence, it comes equation (2):
v =dx dt=
x2− x1
Δt (2)
Substituting equation (2) in equation (1):
Q =x2− x1 Δt ×πr
2×3.6 (mL/h) (3)
Note: flow (Q) is multiplied by 3.6 to obtain the result in cm3/h =
mL/h, because Δt in [s] and r is in [mm].
Moreover, relative error (e), in percentage [14] was assumed to be given by equation (4), where Qmeasured is the measured volume flow rate
(mL/h) at the test temperature, taken as flow rate set up point in the Nexus pump, and Qreference, is the reference volume flow rate (mL/h)
calculated using equation (3):
e =Qmeasured− Qreference Qreference
×100 (%) (4)
Concerning the main sources of uncertainty, the following were considered having into account variables of equation (3):
• Inner syringe radius determination; • Interferometer – travelled distance; • Time;
• Repeatability; • Stability.
Hence, uncertainty analysis begins with the use of equation (3), which can be rewritten as equation (5) in order to consider (d) is the travelled distance of the syringe (mm), r is the syringe radius (mm) and (t) is the elapse time (s). It is noticeable that [mm3] = [μL]:
Q = v × A =x2− x1
Δt ×πr
2= dπr2
t (μL/s) (5)
The standard uncertainty of each component can be determined, where:
u(r) = Ucalliper
2 [mm]
The syringe inner diameter (2r) was determined using a calliper and assuming uniformity along the syringe total length. Ucalliper is the expanded uncertainty associated with the calliper calibration = 0.03 mm. u(d) = ̅̅̅̅̅̅̅̅̅̅̅̅̅̅̅̅̅̅̅̅̅̅̅̅̅ u2 A+ ( u2 Ld2 ) √ [mm];
d has been assumed as the travel distance of the syringe, uA is the
un-certainty of the calibration of the interferometer, determined by the length laboratory of IPQ and uL is the uncertainty of the distance.
u(t) = Uchron
2 [s]
Uchron is the expanded uncertainty associated with the chronometer
calibration = 0.0014 s, used to give traceability to the computer time of the LABVIEW application.
u(rep) = SDm̅̅̅
n
√ [μL/s]
where SDm is the standard deviation of the measurements and n the number of measurements and includes external influence to flow mea-surement like, the temperature variation, pulsations and viscosity effects.
u(stab) = SDs̅̅̅
n
√ [μL/s]
where SDs is the standard deviation of the measurements with the Nexus motor in a stationary stage (no flow is produced in this situation) and n the number of measurements, allowing to determine the uncertainty of the stability of the setup.
The sensitivity coefficients, ci, of each component can be obtained as
follows, being 1 for repeatability and stability. Syringe inner diameter:
∂Q
∂r=
2d
t πr (6)
Fig. 4. 3 D component for pusher block.
Measured distance: ∂Q ∂d= πr2 t (7) Time: ∂Q ∂t= − πr2d t2 (8)
In this way, the combined uncertainty associated with the volume flow, u(Q) [μL/s], is expressed by equation (9):
u(Q) = = ̅̅̅̅̅̅̅̅̅̅̅̅̅̅̅̅̅̅̅̅̅̅̅̅̅̅̅̅̅̅̅̅̅̅̅̅̅̅̅̅̅̅̅̅̅̅̅̅̅̅̅̅̅̅̅̅̅̅̅̅̅̅̅̅̅̅̅̅̅̅̅̅̅̅̅̅̅̅̅̅̅̅̅̅̅̅̅ ( ∂Q ∂r )2 u2(r) + ( ∂Q ∂d )2 u2(d) + ( ∂Q ∂t )2 u2(t) √ +u2(rep) + u2(stab) (9)
and the expanded uncertainty, U(Q), is calculated using equation (10).
U(Q) = k × u(Q) × 3.6 [mL/h] (10)
where k is the coverage factor with probability of 95%. k is evaluated by the effective degrees of freedom as follows:
νeff= u4(Q) u4r νr + u4d νd + u4t νt+ u4rep n− 1+u 4stab n− 1 (11) νeff is the effective degrees of freedom by the Welch-Satterwhite
formula, n is the number of repeatable measurements, and v is the de-grees of freedom for each uncertainty value.
All symbols used are described in Table 1.
4. Setup implementation tests
Tests were carried out for 6 different flows, namely 1 mL/h, 0.5 mL/ h, 0.1 mL/h, 0.02 mL/h, 0.01 mL/h, 0.001 mL/h under the following conditions:
a) Controlled temperature equal to (20 ± 3) ◦C;
b) Humidity above 50%;
c) 1000 μL glass syringe (diameter of 4.60 mm measured using a cali-brated calliper in one point: the piston point of entrance);
d) Before any measurement starts it is important to prime the syringe and all the tubing and ensure that there is no entrapped air in the system.
e) All travelled distance values were directly obtained from the control unit of the interferometer using a LabVIEW application;
f) Time measured by the computer using LabVIEW traceable to a cali-brated digital chronometer by direct comparison;
g) The distance was collected every 30 s for 15 min;
h) Ultra-pure water was used as calibration liquid, with a conductivity of 0.05 μS/cm.
Thirty flow points were determined for each test using equation (3), and the average value was then determined along with the expanded uncertainty for each point/position. The calculated results of the inter-ferometer measurements are presented in Table 2.
An example of uncertainty calculation based on a combination of integral values of distance and time, 14.2 mm and 870 s, respectively, while repeatability is obtained from the 30 individual partial
Table 1
Label of the symbols used. Q (μL/h) Flow v (m/s) Velocity A (mm2) Area
d (mm) Travelled distance r (mm) Internal radius of the syringe t (s) Time
Ucalliper
(mm) Expanded uncertainty of the calliper; provided from the calibration certificate u(r)(mm) Standard uncertainty due to the radius
u(d) (mm) Standard uncertainty of the travelled distance u(t) (mm) Standard uncertainty due to the time
Uchron (mm) Expanded uncertainty of the chronometer; provided from the calibration certificate
uA (mm) Contribution to the standard uncertainty of the components independent of d
uL (mm) Contribution to the standard uncertainty of the components dependent of d
u (rep) Repeatability of the measurements u (stab) Stability of the measurements u(Q) (μL/s) Flow combined uncertainty U(Q) (mL/
h) Flow expanded uncertainty
Table 2
Results for the interferometer method. Measured
Flow (mL/h) Reference Flow, Q (mL/h) Uncertainty, U (Q) (mL/h) Error (%) Uncertainty (%)
0.001 0.00099 0.00015 1.4 15.2 0.01 0.0101 0.0003 −1.3 3.3 0.02 0.0196 0.0010 2.0 3.1 0.1 0.1019 0.0040 −1.8 4.0 0.5 0.5036 0.0180 −0.7 3.6 1 1.0113 0.0320 −1.1 3.2 Table 3
Uncertainty calculation for the interferometer method. Uncertainty
components Estimation u(xi) ci (ci ×xi) 2 Distance (mm) 14.2 0.008207 0.01910 2.45 × 10−08 Time (s) 870 0.000700 − 0.00031 4.76 × 10⁻¹⁴ Radius (mm) 2.3 0.015000 0.23586 1.25 × 10−05 Repeatability (μL/s) 2.49 × 10−03 0.002486 1 6.18 ×10−06 Stability (μL/s) 2.0 × 10−05 2.02 × 10−05 1 4.06 ×10⁻¹⁰ Flow (mL/h) 1.011 ucomb (μL/s) 0.004 k 2.033 Uexp (mL/h) 0.032 Uexp (%) 3.2
observations is presented in Table 3.
In addition, the running time (measurement time) was increased for the smaller flow rate (0.001 mL/h, Table 2) in order to reduce uncer-tainty of 15.2% (k = 2). Tests were performed with a duration of 5 h (18 000 s) and 20 h (72 000 s). In Fig. 6 it is represented the error and un-certainty in each running time considered. It can be verified that the increase of running time will decrease significantly the uncertainty of the measurement namely to 3.3% (k = 2) and 2.9% (k = 2), respectively,
because the larger the running time the smaller the sensitivity coeffi-cient of the radius which is the largest source of uncertainty. It can also be verified that the calculated flow errors are consistent with each other.
5. Internal validation of results
5.1. Calibration of the nexus pump
In order to validate the new interferometric methodology, the cali-bration of the Nexus pump was done simultaneously by the gravimetric method, with the aid of a Mettler balance AX26 [1]. The tests conditions were similar to the described in section 4. Also, results were collected every 30 s for 15 min in order to harmonize the data collection of both procedures. The results are presented in Table 4. Details about the use of the gravimetric method can be found in H. Bissig et al. [1,15].
The results obtained for the calibration of Nexus pump, by both gravimetric (Table 4) and interferometer method (Table 3), are compared in Fig. 7.
From the tables and figures above, it can be seen that the results from the gravimetric method and interferometer method are consistent with each other, being the uncertainty values very similar for both methods except at very small flow rates where the uncertainty is smaller for the interferometer method (15% (k = 2)), for a 15 min test. The larger un-certainty values for the gravimetric method are due to the balance and evaporation components. Also, the errors found with the interferometric method at very low flow rates are smaller than for the gravimetric method, this is especially due to evaporation effect in the balance.
From the obtain results it is also possible to verify that the gravi-metric method can be used for calibrations down to 0.01 mL/h with a reasonable uncertainty value of 5% (k = 2).
Table 4
Results for the gravimetric method. Measured
Flow (mL/h) Reference Flow, Q (mL/h) Uncertainty, U (Q) (mL/h) Error (%) Uncertainty (%)
0.001 0.0009 0.00023 8.7 25.0 0.01 0.0108 0.0005 −7.4 4.6 0.02 0.0203 0.0003 −1.5 1.5 0.1 0.0993 0.0024 0.7 2.4 0.5 0.4968 0.0058 0.6 1.2 1 0.9945 0.0237 0.6 2.4
Fig. 7. Calibration of Nexus pump by the gravimetric and the interferometric
method. Detailed view of error and uncertainty for the smallest flow rates tested.
Fig. 8. Schematic of the complete assembly, where A is the laser unit, B is the one reflector cube, C is the other reflector cube, D is the Nexus pump, E is the glass
syringe, F is the Coriolis meter, G is the 1/16 “stainless steel tube, H is the evaporation trap and I is the balance.
Fig. 9. Picture of the complete assembly, interferometer, Nexus pump, Coriolis
5.2. Calibration of a Coriolis flow meter
A BL100 Coriolis meter from Bronkhorst was calibrated using the interferometer method and the gravimetric method. This flow meter is based on micro electric mechanical system (MEMS) technology and is suitable for flow ranges from 2 g/h down to 10 mg/h [16]. The complete assembly can be found in Figs. 8 and 9.
The meter was calibrated at 2 mL/h, 1 mL/h, 0.5 mL/h, 0.1 mL/h, 0.02 mL/h, 0.01 mL/h at the same test conditions as described in 4 and the results are presented in Table 5 and Fig. 10. To the uncertainty calculation of each method it was added the resolution of the meter and the standard deviation of the meter results.
From Fig. 10 a), it can be seen that the results of the calibration of the meter using the gravimetric method and interferometer method are consistent with each other, but in general the interferometer method has a systematic offset, probably due to inner diameter calculation per-formed manually by a calliper. Also, calibration results are consistent with the error values and accuracy declared by the manufacturer when considering the uncertainty values, Fig. 10 b).
6. Conclusions
An innovative method that allow the determination of microflow rates lower than 1 mL/h using interferometry, developed by the Volume and Flow Laboratory of the Portuguese institute of Quality, was pre-sented in this research paper.
In order to obtain a smaller uncertainty value in the measurements of microflow rates, the running time was increased and results of 2.9% (k =2) on uncertainty were achieved for a set flow rate of 0.001 mL/h. It can be possible to lower the uncertainty even more if the internal radius of the syringe is measured by a more accurate method than a calliper.
Also, in order to internally validate this new methodology two different devices were calibrated using the gravimetric method and the interferometer meter, a syringe pump and a flow meter. The results obtained by both methods in both devices were consistent.
From the obtain results it is also possible to conclude that the gravimetric method can be used for flow devices calibration down to 0.01 mL/h with a reasonable uncertainty value of 5% (k = 2). Up to now it was only possible for the LVC to perform calibrations with this method down to 120 μL/h.
The interferometer method seems promising to allow obtaining reliable, reproducible, and low uncertainty measurements in the microliter flow domain.
Future work will imply a better radius measurement of the syringe, performing measurements down to 0.1 μL/h, testing other types of flow generators and validating the interferometer methodology by an inter-national comparison.
Declaration of competing interest
The authors declare that they have no known competing financial interests or personal relationships that could have appeared to influence the work reported in this paper.
Acknowledgements
This work performed under MeDDII project has received funding from the EMPIR programme co-financed by the Participating States and from the European Union’s Horizon 2020 research and innovation programme.
The authors would like to acknowledge Bronkhorst for the loan of the BL 100 meter used in the validation tests.
References
[1] H. Bissig, H.T. Petter, P. Lucas, E. Batista, et al., Primary standards for measuring
flow rates from 100 nl/min to 1 ml/min – gravimetric principle, Biomed. Tech. 60
(4) (2015) 301–316.
[2] E. Batista, et al., Comparison of infusion pumps calibration methods, Meas. Sci.
Technol. 28 (2017) number 12.
[3] E. Batista, et al., Assessment of drug delivery devices, Biomed. Tech. 60 (4) (2015)
347–357.
[4] E. Batista, N. Almeida, I. Godinho, E. Filipe, Uncertainty calculation in gravimetric
microflow measurements, AMCTM X 86 (2015) 98–104 (London: World Scientific).
[5] A. Furtado, E. Batista, M.C. Ferreira, I. Godinho, P. Lucas, Uncertainty calculation
in the calibration of infusion pumps using the comparison method, in: Book of proceedings of AMCTM XI e IMEKO TC21, Glasgow, Scotland 2017-08-29 a 31,
2017.
[6] E. Batista, et al., New EMPIR project – Metrology for drug delivery, Flow Meas.
Instrum. 72 (2020) 101716.
[7] Donges A., Noll R., Laser Measurement Technology – Fundamentals and Applications, Springer, ISBN: 978-3-662-43633-2.
[8] H. Martin, B. Nestler, et al., An experimental setup for traceable measurement and
calibration of liquid flow rates down to 5nl/min, Biomed. Eng. 60 (4) (2015)
337–345.
[9] D. Liang, L. Tanguy, A. Ernst, R. Zengerle, P. Koltay, Novel gravimetric calibration
method for nano liter liquid handling devices, Fluidic Contr. Syst. (2012) 144–147.
[10] ASTM E524:2001 - Practice for Calibration of Laboratory Volumetric Apparatus. [11] ISO 4787:2010 – Laboratory Glassware – Volumetric Glassware – Methods for Use
and Testing of Capacity;.
[12] K.J.A. Westin, C. Choi, K. Breuer, A novel system for measuring liquid flow rates
with nanoliter per minute resolution, Exp. Fluid 34 (2003) 635–642.
Table 5
BL100 calibration results. Set Flow rate
(mL/h) Interferometry Error Gravimetry En (%) Uncertainty (%) Error (%) Uncertainty (%)
0.01 3.4 3.2 8.9 5.6 − 0,9 0.02 2.0 2.9 1.5 1.5 0,2 0.1 − 1.5 2.5 1.5 2.4 − 0,9 0.5 − 2.2 3.1 0.4 1.2 − 0,8 1 − 2.3 2.9 0.3 2.4 − 0,7 2 − 1.7 3.0 1.4 2.0 − 0,9
Fig. 10. BL100 calibration, where a) is the results of calibration at IPQ by the
gravimetric and interferometer method and b) is the accuracy determination by the manufacturer.
[13] F. White, Fluid Mechanics, sixth ed., McGraw-Hill, 2007, ISBN 978-85-63308-21-4.
[14] S.H. Lee, J. Lee, W. Kang, Practical method for in situ measurement of micro flow
rates using laser diode absorption sensors, Metrologia 56 (4) (2019), 045010.
[15] E. Batista, J. Alves e Sousa, S. Cardoso, V. Silv´erio, Experimental testing for metrological traceability and accuracy of liquid microflows and microfluidics, Flow
Meas. Instrum. 71 (2020), 101691, https://doi.org/10.1016/j.
flowmeasinst.2020.101691.
[16] W. Sparreboom, et al., Compact mass flow meter based on a micro Coriolis flow