DEPARTAMENTO DE BIOLOGIA VEGETAL
Genotypic and phenotypic
characterization of HIV-1 virus found
early in infection
INÊS TRINDADE DE FREITAS
MESTRADO EM BIOLOGIA MOLECULAR HUMANA
2010
DEPARTAMENTO DE BIOLOGIA VEGETAL
Genotypic and phenotypic
characterization of HIV-1 virus found
early in infection
INÊS TRINDADE DE FREITAS
MESTRADO EM BIOLOGIA MOLECULAR HUMANA
2010
Dissertação de mestrado orientada por:
Dr. Manish Sagar
(Brigham and Women’s Hospital, Harvard Medical School) Professora Maria Filomena Caeiro
ACKNOWLEDGEMENTS
My first acknowledgements and two of my most important ones go to both my advisers Dr.Manish Sagar and Professor Maria Filomena Caeiro. I want to thank Dr.Manish Sagar first of all for the opportunity he gave me to work in his lab for the last two years. Also I want to thank him for sharing with me his knowledge, for all advice he gave me and for always having his door open when I most needed guidance. As for Professor Maria Filomena Caeiro she has been restless in helping me while I was away and without whom this whole process would have not been possible. My sincere appreciation for all the work she has done on my behalf. I also want to mention my friends and co-workers from Sagar’s and Kuritzkes’ labs who have given me not only scientific but also personal guidance throughout the whole process. I have learned immensely from every single one of them, and my scientific way of thinking will forever be influenced by them. From these I want to highlight Nikolaos Chatziandreou, Behzad Etemad, Ana Belén Araúz, Phyu Hninn Nyein, Nina Lin and Jon Lee. Another special thank you goes to my friends and roommates for the first year Mariana Fontes and Ana Queirós who not only supported me through the first year showing me nothing but sincere friendship and respect but who also motivated me to pursuit this life altering experience abroad. This whole experience would have not been the same without all the exceptional friends I have made there. I want to thank them all for the help and patience they showed, especially YinMonMon Aung, Amrita Masurkar Aaron Kuebler, Matthew Raphael, Luke Ryan and Angela Crêspo. Now for last, but not least, my greatest gracefulness goes towards my family, especially my parents João Drumond de Freitas and Paula Trindade and my younger brother Tomás Freitas as throughout my whole life they have raised me in an intellectually stimulating and safe environment which allowed me to come all the way to this degree. My most sincere appreciation for all their help and support.
ABSTRACT
In this study we raised full-length envelope sequences from HIV-1 infected patients in early phases of infection, up to three month of viral acquisition, and from their transmitting partners, who were in later stages of infection, to assess any genotypic signature(s) that would distinguish the envelope sequences that were being transmitted and correlate those signatures with viral co-receptor usage and with drugs and neutralization sensitivity. Briefly, we isolated RNA from patients plasma, retro-transcribed it into cDNA and amplified envelope. We used yeast gap repair to clone envelope sequences into our expression vectors. Vectors were then transformed into bacteria and isolated clones were subjected to PCR and sequenced. Despite small sample size, V3 loop and V1-V5 region length seem to be shorter in earlier viruses when compared to later viruses. No other fragments analyzed from envelope showed any trend to be shorter in earlier isolates; neither did full-length envelope, gp41 or gp120. Also, no statistically significant decrease in the number of potential N-glycosylation sites or on the sequences genetic distances was establish in earlier virus.
RESUMO
O Vírus da Imunodeficiência Humana (VIH), causador da Síndrome de Imunodeficiência Adquirida (SIDA), é um flagelo que já matou cerca de 25 milhões de pessoas desde que foi descoberto nos anos 80 (1). Com 100% de taxa de mortalidade, esta enfermidade não se lhe conhece cura nem medicamentos preventivos eficazes, pelo que a investigação deste patogénio se torna imperativa. O VIH pertence à família Retroviridae o que significa que o seu modo de transcrição é muito propício a erros, uma vez que a enzima transcriptase reversa não possui a capacidade de revisão de provas. Este aspecto aliado ao facto deste vírus ter um ciclo de replicação curto, uma taxa de recombinação elevada, uma imensa plasticidade genética e estar sob constante pressão selectiva, torna o versado em evasão.
O genoma de VIH-1 origina um produto transcripcional primário gag, pol, env, que é traduzido em poliproteínas. Através de clivagem, estes fragmentos vão dar origem as proteínas maturadas de que os novos vírus necessitam para se tornar infecciosos, como enzimas e proteínas estruturais. O mesmo produto transcripcional através de splicing alternativo irá dar origem a transcritos que são traduzidos em proteínas acessórias como VPR, VIF, TAT, NEF,VPU e REV(i).
Devido à enorme variabilidade que este vírus apresenta e devido ao facto de este ter transposto a barreira de espécies entre primatas e humanos em, pelo menos, três eventos isolados este encontra-se dividido em três clusters relativamente distintos: O (outlier), M (Main), N(Non M, non O). M é o mais representado mundialmente e subdivide-se adicionalmente em 9 subtipos e 43 formas recombinantes circulantes (CRF) (8). As diferenças observadas entre subtipos são significativas e os esforços para criação de uma vacina têm de considerar esses factos sob a pena de nunca ser possível criá-la. Em suma, novos estudos são urgentes para travar esta epidemia onde ela mais se faz sentir, África.
Neste projecto propusemo-nos estudar genotipicamente o gene do invólucro viral, env, e correlacionar esses dados com aspectos fenotípicos do mesmo, como utilização de co-receptores, ou sensibilidade a drogas e a neutralização. Este gene está envolvido na entrada do vírus nas células, pelo que se assume ser o gene responsável pela transmissão. Este gene codifica para as duas subunidades do invólucro viral- gp41, subunidade transmembranar e
gp120 subunidade de superfície. O invólucro funcional é um heterotrímero destas duas subunidades. A subunidade de superfície- gp120- é extremamente diversificada. Estando dividida em regiões constantes (C1-C6) e regiões variáveis (V1-V5) que se encontram sob a forma de protrusão. As regiões variáveis são ainda caracterizadas por terem mutações indel, por oposição às regiões constantes e à subunidade transmembranar do invólucro, gp41, cujas mutações são predominantemente pontuais. Esta proteína viral é ainda rica em glicosilação. Os glicanos vão proteger o vírus do reconhecimento imune e vão estar envolvidos na correcta conformação terciária da proteína. Assim, são também parcialmente responsáveis pela afinidade do vírus para o seu receptor-CD4- e para os seus co-receptores-CCR5 e CXCR4.
Os genomas virais em estudo foram obtidos de casais heterossexuais em relações monógamas seleccionados de uma cohort de serovigilância no Uganda. Nesta região, em particular, os subtipos predominantes são o D, A e CRF AD, apesar destas proporções estarem em constante evolução. Sucintamente, um dos pacientes seria detectado nos três primeiros meses de infecção e em seguida, retrospectivamente, o parceiro responsável pela transmissão seria detectado e seria obtido o plasma de ambos os indivíduos. O último parceiro descrito estaria infectado há bastante mais tempo, não estando portanto na fase aguda da infecção. Com esta abordagem pretendemos, então, elucidar o mecanismo adjacente à transmissão de VIH-1, para os subtipos virais em questão.
Brevemente, os genomas foram retro-transcriptos a partir de RNA extraído de plasma dos pacientes. O gene do invólucro foi amplificado através de nested PCR. O inserto de 2.5kb foi em seguida incorporado em levedura, para que através da técnica de yeast gap repair, descrita por Eric Arts (28), o fragmento fosse incorporado no nosso vector de expressão. O vector foi amplificado em bactéria. Não foi possível obter todas as sequências dos invólucros desta forma, uma vez que o env apresenta toxicidade em bactérias. Para tentar contornar este facto foi tentado obter o DNA directamente a partir das leveduras. Tentámos fazer colony PCR directamente das células de levedura, de forma a amplificar genomas isolados com o fim de sequenciá-los. Tentámos também fazer a extracção de DNA directamente a partir culturas de leveduras crescidas em meio líquido. Seguimos o protocolo descrito por Sobansky e Dickinson (29), e tentamos inúmeras alterações, sem resultados. Assim os únicos genes obtidos foram aqueles cuja toxicidade era aparentemente menor e cujas bactérias cresceram
com o inserto. Desta forma a amostragem estatística ficou extremamente comprometida. Ainda assim, conseguimos em certos casos ver uma tendência estatística para a significância.
Uma vez obtidas sequências, as distâncias genéticas foram analisadas. Sequências do parceiro nas fases iniciais da infecção não demonstraram ser menos diversificadas quando o teste de Mann-Whitney foi aplicado. Quando analisamos as sequências dos invólucros relativamente ao número de aminoácidos conseguimos ver então algumas tendências: o loop V3 e o fragmento V1-V5 aparentam ser mais curtos em sequências detectadas no início da infecção quando comparadas com sequências detectadas em indivíduos infectados há mais tempo. Esta mesma tendência não se verificou nas glicoproteínas inteiras, como a gp120 e gp41, nem em nenhuma outra porção do invólucro. Quanto aos locais de glicosilação nenhuma porção apresenta variabilidade com significância, no entanto, o loop V3 apresenta o p-value menor, de 0.19. Naturalmente estes resultados não se baseiam numa amostra suficientemente grande para serem significativos, mas propomos que as tendências observadas devam ser tidas em consideração. Estes resultados vêm corroborar, em parte, um estudo realizado por Sagar et al. (24) em que amostras de pares de transmissão heterossexual ugandenses também foram analisadas. No entanto, nesse estudo a população designada como inicial tinha uma média de 189 dias de infecção, média essa bastante mais elevada que na nossa amostra inicial. Nesse estudo, tal como no nosso, os padrões de glicosilação não apresentam diferenças significativas entre amostras iniciais e crónicas. No entanto, o loop V3 não apresenta a mesma tendência entre os dois estudos. Isto poderá dever-se à amostragem mais tardia do estudo de Sagar et al, pelo que se torna urgente compreender as características do invólucro viral em amostras o mais perto possível do momento de transmissão. Só desta forma será possivel desenvolver uma estratégia de prevenção da infecção eficaz.
Palavras-Chave: Invólucro, Transmissão VIH-1, loop V3, Glicosilação gp160, VIH-1
INDEX
Acknowledgements ... iii Abstract ... iv Resumo ... v Index ... viii 1. Introduction ... 1 2. Methods ... 6 2.1 Patient Samples. ... 62.2 Amplification of full-length envelope gene ... 6
2.3 Cloning and expansion of full-length envelope gene. ... 8
2.4 Sequencing of full-length envelope gene ... 9
2.5 Making pseudo-virus and replication competent virus ... 10
2.6 Virus titer ... 10
2.7 Supplementary materials ... 11
3. Results and Discussion ... 12
4. Conclusions ... 24
1. INTRODUCTION
Acquired Immunodeficiency Syndrome (AIDS) numbers are tragically and unacceptably high. With as many as 25 million people dead since it was first discovered in the early 1980’s, in 2008 alone, there were 33.4 million people living with this infection and 2.7 million have been newly infected worldwide. (1). Because most of the affected people live in developing countries with limited access to the current anti-retroviral therapies and lack of a prophylactic vaccine(2, 3) there is an increase in the urgency for developing new strategies to fight this virus.
AIDS is triggered by the infection with Human Immunodeficiency Virus (HIV), which impairs the cell mediated immune response, rendering the individual susceptible to other opportunistic infections.
HIV-1 is a Lentivirus and, as any other Retroviridae, its mode of replication is prone to errors, which partially confers this virus its astonishing variability; the error rate of retroviral reverse transcriptases is ~ 10-4 to 10-5 substitutions per site per replication cycle (4). Other factors that contribute to HIV-1 extensive diversity are its genetic plasticity, its high replication and recombination rate - Recombinants emerge in approximately 42.4% in the progeny after one round of replication with markers 1kb apart; this level of recombination is very close to rates observed during random segregation. (4, 5, 6) Within the same individual there can be found sequences up to 10% divergent (7). HIV-1 genome (Illustration 1) has three main translation products (gag, pol, env) which are the proteins necessary for productive infection, such as replication enzymes and structural proteins. All the other translational products (vif, vpr, vpu, tat, rev, nef) result from mRNA splincing and code for accessory proteins. All three main products are translated into polyproteins, and are subsequently processed to obtain mature proteins (i).
Illustration.1 Landmarks of the HIV-1 genome, HXB2 strain (above). Open reading frames are shown as rectangles. The gene start,
indicated by the small number in the upper left corner of each rectangle, normally records the position of the a in the ATG start codon for that gene, while the number in the lower right records the last position of the stop codon. For pol, the start is taken to be the first T in the sequence TTTTTTAG, which forms part of the stem loop that potentiates ribosomal slippage on the RNA and a resulting -1 frameshift and the translation of the Gag-Pol polyprotein. The tat and rev spliced exons are shown as shaded rectangles. In HXB2, *5772 marks position of frameshift in the vpr gene caused by an "extra" T relative to most other subtype B viruses; !6062 indicates a defective ACG start codon in vpu; †8424, and †9168 mark premature stop codons in tat and nef. See Korber et al., Numbering Positions in HIV Relative to HXB2CG, in the database compendium, Human Retroviruses and AIDS, 1998. (From http://www.hiv.lanl.gov/)
HIV-1 seems to have infected humans from at least three different cross species events, giving rise to three significantly different clusters: (a) M, main, responsible for the global epidemic, (b) O, outlier and (c) N, non-M non-O. Both O and N clusters are only found in restricted regions of Africa (7). M group, which is responsible for the global epidemic, can be further subdivided in 9 subtypes (A, B, C, D, F, G, H, J and K) and 43 circulating recombinant forms (CRFs). (7, 8)
In Africa, where the zoonotic transmission is thought to have taken place, nearly all M subtypes can be found. And even though Africa accounts for about 70% of the global pandemic (1), mainly only subtype B has been studied, given it is the most prevalent subtype in USA and Europe (8). It is becoming increasingly more obvious now, though, that subtype differences are greater than appreciated in the beginning. Thus, it is imperative to study all different subtypes in order to address viruses circulating in areas with the highest endemicity. I will come back to this point further in this dissertation with more relevant examples for this work.
Illustration 2: Progression of HIV-1 infection (From
Wikipedia, originally published in Pantaleo, G. et al
(February 1993) New concepts in the immunopathogenesis of human immunodeficiency virus infection. New England Journal of Medicine, Vol. 328(5).)
In this study we will be looking at samples from Uganda, where subtypes A, D and AD CRFs seem to cause the vast majority of infections (9). This distribution however is not a stable feature, as subtype D occurrence has been decreasing for the last 8 years and subtype A as well as CRFs have been increasing. Minor subtypes in this region, such as C, however, do not seem to have suffered any alterations (10). This changeability in the proportions may be due to subtype D showing a faster rate of disease progression compared to subtype A (11), but also a recent study has shown that in heterosexual transmission subtype D shows a decreased capacity to be transmitted over both CRFs and A subtypes (12) .This is particularly relevant given that heterosexual intercourse still remains the main mode of transmission in sub-Saharan Africa (1).
HIV-1 transmission varies upon the presence of several risk factors but overall, this virus does not have an extremely high rate of transmission. It varies from 0.0082/coital act (when the partner is in the first 2 to 5 month of infection when plasma virus levels are relatively high) to 0.0007/coital act (during the chronic phase of disease when the viral levels are relatively lower)(Illustration 2)(13).
At the cellular level, HIV-1 infection is very well characterized (Illustration 3), yet not much is known in relevant tissues, such as how HIV-1 penetrates an intact mucosa and leads to a generalized infection. There are several theories and now it is believed that activated CD4+ T cells, dendritic cells (DCs) or macrophages may play a role. (14,15). Some of these types of cells are susceptible to HIV infection and all of them can be found in the intact epithelium of the vagina, ectocervix and foreskin. (14, 16, 17), therefore
being good candidates to explain the infection mechanism.
Illustration 3: HIV-1 entry into cells and systemic infection hypothesis. (From
Fox, J., Fidler, S., Sexual transmission of HIV-1, Antiviral Research (2008), doi:10.1016/j.antiviral.2009.10.012)
For HIV-1 to enter cells it requires the presence of CD4, the virus receptor, and another cellular receptor that will act as a viral co-receptor. The two main co-receptors that have been described, in vivo, are CCR5 and CXCR4 (i). Based on the usage of the co-receptor virus can be designated by R5, if they use CCR5, X4, if they use CXCR4, or X5R4 if they have the ability to use both co-receptors to promote viral entry (i). Other key requirements for the viral entry are the products of the proteolytic cleavage by cellular proteins of the envelope main polyprotein, also known as glicoprotein160 (gp160). These products are gp120, the surface unit of the viral envelope and gp41, its transmembrane unit. Both these units are functional as trimmers and heterotrimeric Env spikes consist of three gp120 domains atop three gp41 domains. Gp41 has more than 80% consistency on its amino acid composition and the scarce mutations are all point mutations. Gp120, on the other hand, has highly variable regions, with 25% or less in consistency, and its variability is often due to insertions and deletions (indels) and point mutations, interspersed by highly conserved regions. None the less, despite the variation on the amino acid content especially in gp120, the glycosylation sites and β-turns are fairly conserved in both glycoproteins. Based on these properties, the envelope complex is said to have 5 variable regions (V1-V5) and 6 constant regions (C1 to C6). Variable regions are also noticeable to appear as protrusions in the gp120 surface, in the loop form, with cysteine dimmers as bridges (19). The variable loops, especially V1-V2 and V3 are readily accessible, and given their composition of mainly hydrophilic aminoacids these variable loops are highly immunogenic (19).
One way of decreasing the recognition by the immune system is to shield these regions with N-linked glycans. In the case of HIV-1 these glycans can be both high mannose and complex branched-type carbohydrates. In gp120 alone, the most exposed envelope subunit, there are over 20 potential N-linked glycosylation sites (N-gly sites) and these account for about 50% of the protein mass (20). Glycosylation seems to be important to allow gp120 to fold properly so it can bind to CD4 (20), as well as to protect the virus from immune recognition. N-glycans seem to have relatively low immunogeneticity and shield the more immune reactive epitopes of HIV envelop (21). This notion of the glycosylation pattern as something stable has been challenged as changes on glycosylation patterns over the course of infection have been reported (22).
Another aspect that had been assumed to be stable, and has also been shown to change is the length of the envelope itself. Envelopes found early in infection have been shown to have shorter variable loops (23).
None the less, both these features seem to be subtype dependent, as it hasn't been shown in all subtypes. Studies on subtype D and B viruses did not show significant differences in the number of N-gly sites among earlier and later in infection isolates (24). In Subtype A and C HIV-1, on other hand, glycosylation increases over time which potentially leads to resistance against autologous antibodies (22,23). There have been studies suggesting that virus found in male to female (MTF) transmission or female to male (FTM) do not show any difference. (22) So, I will use heterosexual transmission indiscriminately for both MTF and FTM transmission cases.
Genotypic differences in the envelope gene in early isolates versus later isolates led to hypothesize that envelope sequences present during acute infection are unique compared to those circulating in their chronically infected transmitting partner. And indeed, there is a large number of studies now, showing that there is a bottleneck effect during HIV-1 transmission. No matter how genetically diverse the virus are in the transmitting partner, the virus found in the newly infected individual always cluster together, showing a much lower genetic distance between them. This allows us to reason that they come from one or very few virus from the transmitting partner. Even with the most recent technologies if it is only one or small number of highly related viruses that are transmitted cannot be definitively proven. (25)
There is also another extremely important observation that has been made about HIV-1 virus found in earlier stages of infection. That observation concerns viral co-receptor usage. Different studies have shown that predominantly CCR5 using viruses are transmitted. CXCR4 usage emerges in some individuals who progress to AIDS. Thus, although chronically infected partners may harbor X4 viruses with their envelope forms, these are rarely transmitted. (26).
In this study, I proposed to understand envelope differences among acutely infected subjects and their transmitting partner. The goal was to sequence envelope genes from partners in a transmitting relationship when the newly infected subject was sampled within the, the first three months of HIV-1 acquisition. In addition, I proposed to correlate sequence differences
with phenotypes, such as co-receptor usage, drugs, and neutralization sensitivity. Our studies were aimed at deciphering signature(s) properties of the transmitted virus compared to the majority of variants circulating in the transmitting partner. This information could be exploited to develop targeted novel strategies to prevent heterosexual transmission of this virus.
2. METHODS
2.1 Patient Samples.
Samples used in this study are from patients from an existing Cohort in Rakai, Uganda, where more than 25000 individuals were tested for HIV-1 infection in at least two different time points. This program (Rakai Health Sciences Program) has collected data on sexual behaviors, incidence and prevalence of HIV, among others, in the region. Majority of the HIV acquisition reported on adults has been due to heterosexual sexual contact.
Individuals who had an antibody negative test, followed by an antibody positive test, had their last negative sample tested for the presence of HIV-1 RNA. 29 patients were found to be RNA+/antibody negative. From these, only 12 had HIV positive partners.
For these 12 positive couples, plasma samples are available for each individual. Plasma samples from the recently infected partner contained a median of 236 000 HIV copies/mL (range 200 to 1 185 000 copies/mL) and from the donor partner contained a median of 117 000 copies/mL (range 10 500 to 2 400 000 copies/mL).
2.2 Amplification of full-length envelope gene
RNA was extracted from patients’ plasma, using Quiagen RNA extraction kit according to the manufacturer’s specifications and was stored at -80C until used, which had already been done before I arrived at the lab. At the time of the first use, the RNA was aliquoted into 5μL aliquots to prevent further unnecessary freezing and thawing. cDNA was created through reverse-transcriptase PCR (RT-PCR) using SuperScript III enzime kit (Invitrogen Life
Technologies, Carlsbad, CA) and the manufacturers reagents, no concentrations were changed (2.5μL 2mM dNTPs, 1μL 100ng/μL primer, 5μL RNA, 4μL 5x enzyme buffer, 1μL 0.1M MDTT, 1μL RNASE OUT, 1μL superscript III enzyme, 4,5μL Rnase/Dnase free water) This reaction was incubated for 65C for 5 min, the RNA with the water, primer and dNTPs, to denature RNAs secondary structures. After the incubation the mix was put on ice After 2 min the rest of the reagents were added and the whole reaction was incubated for 1h at 50C followed by another 1h at 55C and then followed by 15 min at 70C. After this, 1μL of RNAse H was added to destroy the remaining RNA, and was incubated for 20 min at 37C. cDNA was now used directly for PCR or stored at -20C for future use. The primer used for the cDNA was a sequence specific for envelope (OF (Supplementary materials - Table1)) in the first round of attempts to amplify full-length gp160. For the subjects whose cDNA could not be obtained with this primer, oligo-d(T) was used. Subjects whose cDNA could not be obtained with one or the other were not pursued any further.
Nested PCR was used to amplify the 2500bp fragment corresponding to full-length gp160:
iProof enzyme kit was used, according to the manufacturer’s instructions (Bio Rad). 20μL reactions (4μL 5x enzyme buffer, 2.5μL 2mM deoxynucleoside triphosphates (dNTPs), 0,5μL 100ng/μL forward and reverse primers, 0,5μL 25mM MgCl2, 0,2μL iProof enzyme) PCR conditions were as following: first round: 98C for 30sec, 30cycles of 98C for 10sec, 55C for 30sec, 72C for 2min, and the last extension of 10min at 72C. Primers used were OR/OF. Second round: 98C for 30sec, 30cycles of 98C for 10sec, 56C for 30sec, 72C for 2min, and the last extension of 10min at 72C. Primers used were IR/IF (Supplementary materials – Table1).
Single genome amplification (SGA) was done as previously described by Jesus F. Salazar-Gonzalez et al. (27). Primers used were OR/OF for the first round and IR/IF for the second round. 1μL of cDNA dilluted 1:5, 1:8, 1:10, 1:100 in RNase/DNase free water were used as template for the first round. 2-5μL of first round were used as template for the second round.
Platinum Taq High Fidelity polymerase (Invitrogen, Carlsbad, CA) enzyme was used as described by Jesus F.Salazar-Gonzalez et al. (27) in the SGA protocol but this time using 2-5μL of undiluted cDNA to try and get bulk PCR amplification. Primers used were OR/OF for the first round and IR/IF for the second round
2.3 Cloning and expansion of full-length envelope gene.
Tried to use the TOPO-cloning kit from invitrogen following the manufacturer’s instructions.
Yeast gap repair, as described (28), was used to clone the full-length envelope gene into the expression vector. pcENVΔgp160URA(pacI) (supplementary material). Vector was linearized before being used for yeast transformation. 200 ng of the vector were used. Yeast cells were plated in -Leu+FOA plates and were incubated for 72h at 30C. From this step several different procedures were tried:
Bulk colonies were allowed to grow in 2mL liquid -Leu media overnight at 30C. Yeast were lysed with 10mM Tris-HCl, pH8.0, 1mM EDTA, 100mM NaCl, 1% SDS, 2%triton-X-100 and acid washed glass beads 0.045mm diameter. DNA was extracted using the Phenol-Chloroform-Isoamyl alcohol procedure (29) Electrocompetent. Top10 E.coli strain (invitrogen) were transformed and plated on LB+amp plates and let to grow overnight.
Bulk colonies and individual ones were picked and let to grow on liquid LB-Amp overnight. Plasmid was rescued using Miniprep Kit (Quiagen) according to manufacturer’s instructions.
Individual colonies were gridded in an LB+amp plate and were subjected to colony PCR for amplification of full-length envelope. Colony PCR was the same program as first round described by Jesus F. Salazar-Gonzalez et al. (27) except the first denaturation time was increased to 5 min to ensure properly disruption of the bacterial cell wall.
Bulk colonies were allowed to grow in 10mL of liquid -Leu media overnight at 30C. The next day yeast cells were pelleted and the DNA was rescued following Sobansky and Dickinson instructions' (29). The plasmid harvested this way was transfected directly into 293T cells.
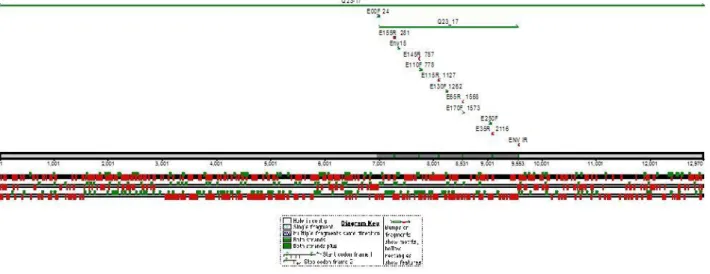
Illustration 4 – Primers used for sequencing aligned with Q23-17 reference sequence and Q23-17 env sequence.
Individual yeast colonies underwent colony PCR with the same program as described before with the exception that several different methods were assayed to help cell wall disruption prior to the PCR.
2.4 Sequencing of full-length envelope gene
Full-length gp160 was sent for sequencing with primers (Supplementary materials - Table1) that would sequence both strands as shown (Illustration 4). Sequencing fragments were analyzed and put together using Sequencher 4.9 software. Subtype was verified using RIP tool from HIV database (8).
Different consensus sequences from the same patient were aligned using HIValign tool from the HIV database (8). The alignment was manually confirmed by visual inspection using BioEdit sofware. Limits for the different V1-V2, V1-V4, V1-V5, V3, GP160, GP120 and GP41 domains was chosen manually using Modrow et al, 1987 as reference (19). Counting the number of aminoacids was done using Bioedit. Counting the number of N-gly sites was done using N-Glycosite tool from the HIV database (8). Genetic distances were analyzed using Mega 4.0 software. Phylogenetic trees were made using Mega4 software. Highlighter charts were done using highlighter tool in from HIV database (8).
2.5 Making pseudo-virus and replication competent virus
Pseudo-virus: 2.7 μg of miniprep from bulk patient colonies in the pcENVΔgp160URA(pacI)cut (supplementary materials) plus 5.3μg of the backbone plasmid NL4-3Δenv vpr- Luc (approx. 8μg of DNA in a 2:1, backbone:miniprep ratio).
Replication competent virus: 4μg of miniprep from bulk patient colonies in NL4-3CMVΔgp160URA(pacI)cut plus 4μg of CMV NL4-3 LTR-Gag4: (approx. 8μg of DNA in a 1:1, backbone:miniprep ratio).
Both reactions were transfected into 293T cells using Fugene 6, according to the manufacturer’s instructions. 2.00x10⁶ cells were plated in a T75 flask 36h before transfection. Cells were cultured in 15 mL of Dulbecco's Modified Eagle Medium (DMEM) supplemented with 100 U/mL of Penicillin, 100 U/mL of Streptomycin, 4 μM/mL of L-glutamine from, 10% of heat inactivated Fetal Bovine Serum and 20 μM/mL HEPES buffer. Cells were maintained at 37C with 5% CO2.
Cellular supernatant containing virus was collected 24h to 72h after transfection. It was filter-sterilized using Steriflip® Sterile 50mL Disposable Vacuum Filtration System from Milipore with 0.22μm filter. Supernatant was then dispensed in 500μL aliquots and stored at -80C until further use. Viruses are always frozen at least once before any use and do not undergo freeze and thawing cycles for more than three times.
2.6 Virus titer
Virus titer was accessed by luminescence reading of βgal expression in TZM-Bl cells (30). These cells, also known as JC.53bl-13, are engineered from HELA cells and express high levels of CD4 and CCR5. This line also has the βgal gene directly under control of TAT promoter, rendering them a good cell line to measure viral infection.
100μL of DMEM/well, supplemented as previously described, are added to a 96well costar clear bottom plate. 100μL virus/well is added to row A. Serial dilutions of 1:2 are done until row G. Last row (H) will be negative control. TZM-bl cells suspended at 1x10⁴ cells/well are
added to all wells. 1:1000 dilutions of 20mM DEAE is added to the cells right before adding them to the plate. Plates were incubated for 48h at 37C with 5%CO2.
After 48h supernatant is aspirated off and the plates were washed with 1xPBS. βgal was read with Galacto-Light Plus™ beta-Galactosidase Reporter Gene Assay System, Applied Biosystems, and according to manufacturer’s instructions.
2.7 Supplementary materials
PrimerName
Sequence Concentration Location on HXB2
reference sequence Primers for PCR OR 5’ TAGCCCTTCCAGTCCCCCCTTTTCTTTTA 3’ 100μg/μL 9068←9096 OF 5’ GGCTTAGGCATCTCCTATGGCAGGAAGAA 3’ 100μg/μL 5954→5982 IR 5’ TTTTGACCACTTGCCACCCAT 3’ 100μg/μL 8797←8817 IF 5’ AGAAAGAGCAGAAGACAGTGGCAATGA 3’ 100μg/μL 6202→6228
Primers for sequencing
E00F 5’ TAGAAAGAGCAGAAGACAGTGGCAATGA 3’ 10μg/μL 6201→6228
E155R 5’CTGTTCTACCATGTTATTTTTCCACATGT 3’ 10μg/μL 6505←6533
Env15 5’CCA TGT GTA AAG TTA ACC CC 3’ 10μg/μL 6579→6595
E145R 5’ CAGCAGTTGAGTTGATACTACTGG 3’ 10μg/μL 6981←7004 E110F 5’ CTGTTAAATGGCAGTCTAGCAGAA 3’ 10μg/μL 7002→7025 E115R 5’ AGAAAAATTCCCCTCCACAATTAA 3’ 10μg/μL 7351←7374 E130F 5’ ACAAATTATAAACATGTGGCAGG 3’ 10μg/μL 7487→7509 E65R 5’ AGTGCTTCCTGCTGCTCC 3’ 10μg/μL 7794←7811 E170F 5’ AGCAGGAAGCACTATGGG 3’ 10μg/μL 7799→7816 E250F 5’ GGAGGCTTGATAGGTTTAAGAATA 3’ 10μg/μL 8292→8315
E35R 5’ GGTGAGTATCCCTGCCTAACTCTATT 3’ 10μg/μL 8340←8365
IR 5’ TTTTGACCACTTGCCACCCAT 3’ 10μg/μL 8797←8817
pcENV(HIV-1)Δgp160URA-LEU: pcDNA3(invitrogen) was cut with BglII and a 3kb
fragment Leu+CRS6 amplified from prs315 (ATCC) was inserted. 3kb band from pCr3.1-Q23 Gp160 was inserted in pcENV-Leu. Plasmid was cut with SnaBI and URA amplified with a PacI site was inserted by yeast gap repair. URA was amplified from pRS315
pNL4-3Δenv vpr- Luc: was obtained through the NIH HIV reagent program.
CMV NL4-3 PBS-LTR: NL4-3 Full length in pRS315. Replaced 5' of primer binding site
(PBS) with Ura. PBS-LTR was cut with NheI and using yeast gap repair was replaced wth Ura PacI. This last insert was then replaced by CMV PCR product. CMV was amplified from pDSRed monomer C1-Vecto.
CMV NL4-3 LTR-Gag4: pCDNA3-LEU added LTR-gag PCR product.
3. RESULTS AND DISCUSSION
The first step was to retro-transcribe RNA into cDNA. To check cDNA production from the reverse transcription reaction, a small portion of gag was amplified using nested PCR. Our first attempt was with iProof enzyme kit, from Bio-Rad. In the beginning we tried to use single genome amplification (SGA), with serial dilutions on the cDNA in order to obtain 30% of positive PCR reactions. By the Poisson distribution, this percentage of positive PCR would suggest amplification from one genome (27). With this enzyme we could not amplify any genome, which prompted us to change enzymes into taq Hi-Fidelity from invitrogen. This enzyme was reported to have higher sensitivity. All sequencing attempts came back negative or unusable. As opposed to SGA, envelope sequences were amplified among using bulk PCRs and individual clones were examined for sequence. Bulk PCRs amplified a 2,5kb envelope band corresponding to full-length envelope which was transformed it into yeast as previously described (28). After 72h, if the -LEU+FOA plates that had over one hundred
colonies(approx.) and had at least ten times more colonies than in the negative control, then all colonies were incubated in –LEU liquid medium for 16 hours . The following morning DNA from yeast was rescued using the Phenol-Chloroform-Isoamyl Alcohol protocol (29).After ethanol precipitation, DNA was resuspended in RNAse/DNase free water and stored at 4C. The next day electrocompetent Top10 E.coli strain were transformed and plated in LB+amp plates and incubated overnight. The next day all colonies were picked in liquid LB+amp, and left to grow for approximately 16h. After the growth period DNA was extracted using Quiagen mini prep kit according to manufacturer's instructions and the minipreps were subjected to PCR to confirm the presence of our insert. Once confirmed, plasmids were transfected into 293T cells to make replication competent virus or pseudo-virus. Also, plasmids were retransformed into bacteria, and 8 clones were selected for sequence analysis from each subject. . We would then screen these last colonies using colony PCR. Some patients had 8 out of 8 positive colonies, but others would have no positive clone. It is to be noted however, that some of these patients whose sequences were impossible to amplify from isolated bacterial clones re-transformed from mini prep, demonstrated infectious pseudo-virus, which indicated that indeed env genes were present in the original mixture.
To expedite the protocol and avoid the potential toxicity of cloning the HIV-1 envelope in bacteria, we attempted direct yeast DNA plasmid extraction as previously described (29). We used panoply of isolation protocols but the repeatedly low quantity of yeast plasmid isolation prevented its direct use in transfections or sequencing. This suggests that this method for DNA rescue from yeast does not yield enough amount of DNA, at least at a laboratory scale, and the bacterial step was unavoidable.
All sequences obtained in this study were subtype D, confirmed by RIP tool (8). However, certain sequences were impossible to obtain because bacterial cloning produced no viable clones. There have been authors suggesting that HIV env gene is toxic for E.coli (31), hence extremely hard to clone. Potentially, envelope toxicity within E. coli may be subtype dependent although no specific finding in the literature support this claim at this time. I believe however it is safer to assume, that regardless of subtype, envelope sequences that were difficult to clone must have some features that potentially exacerbate toxicity. Circumvention of bacterial cloning or understanding the mechanism for the toxicity may
allow the cloning of more envelope sequences in the future. Another way, would be to try and clone smaller portions of envelop at a time avoiding toxicity this way. This last solution may compromise the study as a full-length envelop as interactions between different portions of envelop would be lost.
From the patients in whom we obtained high quality sequences, which have not yet been made publicly available as the work is still ongoing, even if we could not get the desired 8 different sequences, these were further analyzed. The only matched pair we sequenced both partners clustered together with 100% after 500 bootstraps, on MEGA4 software, when aligned with other Ugandan sequences (Illustration 5). Both patients were subtype D. The earlier patient sequences, H00325, had an overall average pair-wise genetic distance of 0.0038 (ranges from 0.0068595 to 0.0024100). The chronic patient´s, F00195, had an overall average pair-wise genetic distance of 0.0098137(ranges from 0.0216071 to 0.018893) Sequences from both partners together had an overall genetic distance of 0.01803 (Illustration 6 A) and B))
On average early patients had a genetic distance of 0.0071 (0.0128 – 0.0038) and the chronic patients had a genetic distance of 0.0158 (0.058-0.0004) (Illustration7 A) B) C)). Early subjects are the individuals with recently acquired infection, which includes two distinct groups. Some of the patients are in the first three weeks of infection as they are RNA+ but still have no detectable antibody responses. The rest of the patients are up to the first trimester of infection, having already mounted antibody responses to the virus. Despite being aware I may be missing some important information by making this generalization and not taking in consideration there may be relevant differences, I did not have a good enough representation of earlier samples that would allow me to analyze it as two independent groups. Having said this, according to Mann-Whitney Test early envelope sequences did not have less variability than late envelope sequences (p-value 0.29). This suggests that sequences found early in infection are as diverse as sequences found in chronic patients. These numbers need to be looked at carefully, though, as they lack sampling: I could only get sequences from 3 early patients and 5 late patients (Illustration 7 C)). So, even if these results seem to be contradictory with what other authors have found on viral genetic diversity within the earlier phases of infection, they can hardly be conclusive. A bigger sample size would definitely be required.
Illustration 5 – H00325/ F00195aligned with other Ugandan sequences to confirm transmission partnership
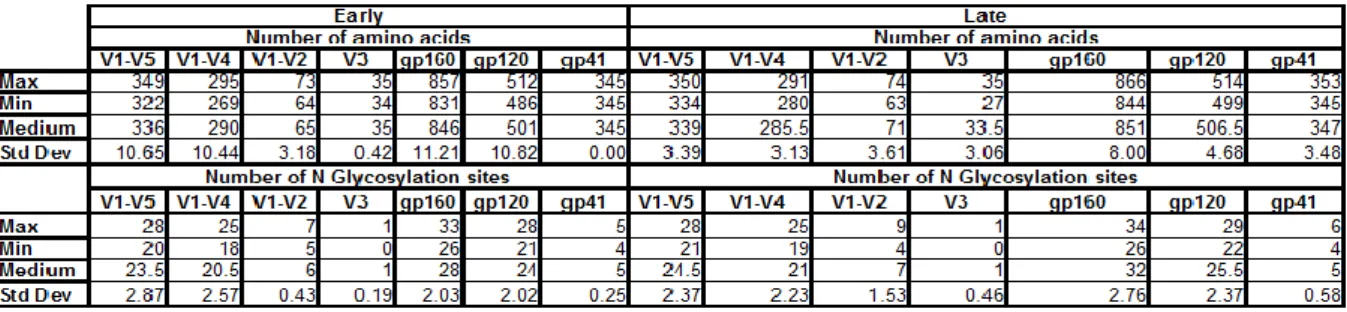
When we analyze the number of aminoacids (a.a) (Illustration 8- A)B)C)D)E)F)G)) of the envelope glycoprotein GP160, early
patients show no significant decrease in length when compared to patients in more advanced stages of infection (p-value 1.00). However, such high p-values were not observed in all the segments analyzed. No segment showed statistical significance, however the fragments V1-V5 and the V3 loop showed a trend to be shorter in earlier isolated than in later ones (p-value 0.07) by Mann-Whitney test. All other segments analyzed V1-V4, V1-V2, gp120 and gp41, did not show any statistically significant difference. Another thing that we need to keep in mind is that for envelope sequences in which we did not have full-length, V3 region was always obtained, having therefore a bigger sample size. This may or may not account for the fact that this particular segment has higher significance. In case it does, we may think that had the other regions had a few more sequences to be analyzed, we could obtain lower p-values. This is actually partially supported
by a similar study which has been done
A) Genetic distances Early late RNA+/Ab+ subject D82058 0.0050 C81963 J39956 0.0053 H39955 B86501 0.0128 A85628 J83252 0.0047 J82655 RNA+/Ab- subject H00325 0.0038 0.0098 F00195 E38363 0.0004 G21430 A54828 0.0583 F28701 0.0180346 H00325/F00195 Pair 0.0098357 F00195 Late 0.003811 H00325 Early Genetic distances A) B)
Illustration 6- A) Philogenetic tree for all sequences from one pair. B) Overall genetic distances for each individual patient and for the pair.
~ E nv -c on tig m in ip re p 10 H 86 56 5 m in ip re p 9 H 86 58 5 m in ip re p5 H 86 56 5 m in ip re p 8 H 86 56 5 M in ip re p 7 H 86 56 5 m in ip re p 6 H 86 56 5 m in ip re p3 H 86 56 5 m in ip re p 1 C ) H 3 9 9 5 5 C lo n e 5 f u ll l e n g h 5 /3 /2 0 1 0 8 :0 6 A H 3 9 9 5 5 C lo n e 7 f u ll l e n g h 5 /3 /2 0 1 0 8 :0 6 A H 3 9 9 5 5 C lo n e 6 f u ll l e n g h 5 /3 /2 0 1 0 8 :0 6 A H 3 9 9 5 5 C lo n e 1 0 f u ll l e n g h 5 /3 /2 0 1 0 8 :0 6 H 3 9 9 5 5 C lo n e 8 f u ll l e n g h 5 /3 /2 0 1 0 8 :0 6 A H 3 9 9 5 5 C lo n e 9 f u ll l e n g h 5 /3 /2 0 1 0 8 :0 7 A H 3 9 9 5 5 C lo n e 1 2 f u ll l e n g h 5 /3 /2 0 1 0 8 :0 6 B = )
Illustration7 - A) Overall genetic distances for each individual patient and its transmitting partner. Not all patients shown in the table have sequences, hence the empty cells. B) Phylogenetic tree for all isolated late sequences. C) Phylogenetic tree for all isolated early sequences.
Ugandan samples, in which the newly infected partner had a median of 189 days into infection, which is longer than our subjects. They seemed to find significant differences in the envelop length of V1-V2, V1-V4 and V1-V5 when compared early vs late envelope sequences. No difference in the V3 region alone was reported. We may then hypothesize, if indeed this trend in V3 being shorted in earlier viruses would be confirmed, that maybe V3 loop is shorter when transmitted but evolves faster than other portions of envelope, possibly to avoid immune recognition, or to improve co-receptor usage that has been reported to be less efficient in earlier isolates (32).
The analysis of the number of potential N-Glycosylation (N-Gly) (Illustration 8 H)I)J)K)L)M)N) )sites showed that virus recently transmitted do not show an overall decrease in N-Gly sites when both envelope glycoproteins were analysed. Also, in contrast with what happened with the number of aminoacids none of the smaller portions analyzed seem to change their glycosylation patterns over the course of infection. These finds corroborate the same study mentioned above in which no variance on the glycosylation patterns were observed for the regions already mentioned. The lower p-value obtained, yet quite far from significance, was on the V3 loop (p-value 0.19), that did not seem a particularly important region in the Sagar et al. study (24). This seems to point once again to a faster change of this loop when compared to others fragments.
g p 1 6 0 n u m b e r o f a m in o a c id s E3 83 63 G 21 43 0 00 H 32 5 F0 01 95 A 54 82 8 F2 87 01 B 86 50 1 85 A 62 8 86 H 56 5 E8 56 56 J39956 H 39 95 5 82 D 05 8 81 C 96 3 830 840 850 860 870 P a ti e n ts Nu mb er of am in oa cid s g p 1 2 0 n u m b e r o f a m in o a c id s E3 83 63 21 G 43 0 00 H 32 5 F0 01 95 A 54 82 8 87 F2 01 B 86 50 1 85 A 62 8 86 H 56 5 E8 56 56 J39956 H 39 95 5 82 D 05 8 81 C 96 3 490 500 510 P a ti e n ts Nu mb er o f a min oa cid s g p 4 1 n u m b e r o f a m in o a c id s E3 83 63 G 21 43 0 00 H 32 5 F0 01 95 A 54 82 8 87 F2 01 B 86 50 1 85 A 62 8 86 H 56 5 E8 56 56 J39956 H 39 95 5 82 D 05 8 81 C 96 3 345 350 355 P a ti e n ts Nu mb er o f a min oa cid s A ) B ) C )
V 1 -V 4 n u m b e r o f a m in o a c id s E3 83 63 21 G 43 0 00 H 32 5 F0 01 95 A 54 82 8 F2 87 01 B 86 50 1 85 A 62 8 86 H 56 5 E8 56 56 J39956 H 39 95 5 82 D 05 8 81 C 96 3 270 280 290 P a ti e n ts Nu mb er o f a min oa cid s V 1 -V 5 n u m b e r o f a m in o a c id s E3 83 63 21 G 43 0 00 H 32 5 F0 01 95 A 54 82 8 87 F2 01 B 86 50 1 85 A 62 8 82 D 05 8 81 C 96 3 J39956 H 39 95 5 86 H 56 5 56 E8 56 320 330 340 350 360 P a ti e n ts Nu mb er o f a min oa cid s V 1 -V 2 n u m b e r o f a m in o a c id s E3 83 63 21 G 43 0 00 H 32 5 01 F0 95 54 A 82 8 87 F2 01 86 B 50 1 85 A 62 8 86 H 56 5 56 E8 56 J39956 H 39 95 5 82 D 05 8 81 C 96 3 J83252 J82655 65 70 75 P a ti e n ts Nu mb er o f a min oa cid s V 3 n u m b e r o f a m in o a c id s E3 83 63 21 G 43 0 00 H 32 5 01 F0 95 54 A 82 8 87 F2 01 86 B 50 1 85 A 62 8 86 H 56 5 56 E8 56 J39956 H 39 95 5 82 D 05 8 81 C 96 3 J83252 J82655 26 28 30 32 34 36 P a ti e n ts Nu mb er of am in oa cid s D ) E ) F ) G )
g p 1 6 0 n u m b e r o f p o te n c ia l g ly c o s y la ti o n s it e s E3 83 63 G 21 43 0 00 H 32 5 F0 01 95 A 54 82 8 F2 87 01 B 86 50 1 85 A 62 8 86 H 56 5 E8 56 56 J39956 H 39 95 5 82 D 05 8 81 C 96 3 25 30 35 P a ti e n ts Nu mb er of N-G ly co sy la tio n s ite s
g
p
12
0
n
u
m
b
er
o
f p
o
te
n
ci
al
g
ly
co
sy
la
tio
n
s
ite
s
E3 83 63 G2 14 30 H0 03 25 F0 01 95 A5 48 28 F2 87 01 B8 65 01 A8 56 28 H8 65 65 E8 56 56 J39956 H3 99 55 D8 20 58 C8 19 63 20 22 24 26 28 30P
at
ie
n
ts
Nu m b er o f N -G ly co sy la tio n s it esg
p
41
n
u
m
b
er
o
f p
o
te
n
ci
al
g
ly
co
sy
la
tio
n
s
ite
s
E3 83 63 G2 14 30 H0 03 25 F0 01 95 A5 48 28 F2 87 01 B8 65 01 A8 56 28 H8 65 65 E8 56 56 J39956 H3 99 55 D8 20 58 C8 19 63 2 3 4 5 6 7P
at
ie
n
ts
Nu m b er o f N -G ly co sy la tio n s ite s H ) I) J)V 1 -V 2 n u m b e r o f p o te n c ia l g ly c o s y la ti o n s it e s E3 83 63 21 G 43 0 00 H 32 5 01 F0 95 54 A 82 8 87 F2 01 86 B 50 1 85 A 62 8 86 H 56 5 56 E8 56 J39956 H 39 95 5 82 D 05 8 81 C 96 3 J83252 J82655 4 6 8 10 P a ti e n ts Nu mb er o f N -G ly co sy la tio n s ite s V 1 -V 5 n u m b e r o f p o te n c ia l g ly c o s y la ti o n s it e s E3 83 63 21 G 43 0 00 H 32 5 F0 01 95 A 54 82 8 F2 87 01 B 86 50 1 85 A 62 8 86 H 56 5 E8 56 56 J39956 H 39 95 5 82 D 05 8 81 C 96 3 20 25 30 P a ti e n ts Nu mb er o f N -G ly co sy la tio n s ite s V 1 -V 4 n u m b e r o f p o te n c ia l g ly c o s y la ti o n s it e s E3 83 63 G 21 43 0 00 H 32 5 F0 01 95 A 54 82 8 F2 87 01 B 86 50 1 85 A 62 8 86 H 56 5 E8 56 56 J39956 H 39 95 5 82 D 05 8 81 C 96 3 20 25 P a ti e n ts Nu mb er o f N -G ly co sy la tio n s ite s V 3 n u m b e r o f p o te n c ia l g ly c o s y la ti o n s it e s E3 83 63 21 G 43 0 00 H 32 5 01 F0 95 54 A 82 8 87 F2 01 86 B 50 1 85 A 62 8 86 H 56 5 56 E8 56 J39956 H 39 95 5 82 D 05 8 81 C 96 3 J83252 J82655 0 .0 0 .5 1 .0 1 .5 P a ti e n ts Nu mb er of N-G ly co sy la tio n s ite s K ) L ) M ) N )
As for the functional assays such as drug sensitivity assays, I did not manage to generate virus with adequate titer. For those assays we required 50μL of viral dilution ( viral stock from 293T supernatant diluted in DMEM) and 500 infectious particles (IP). From previous experience this number seemed to be the lower threshold from which we could get consistent results throughout replicates. Less than 500IP would show a considerable amount of variation. Because these viruses had very low titers we tried and use 50μL of neat viral stock (not diluted in DMEM). This, however, did not show good results as TZM-bl, cells used for the assays, died when such large amount of neat viral stock was added, even if it did not contain 500IP. One possible explanation is that when the viral stock was harvested from the 293T, its medium had high amounts of cellular excretion, which would not be filtered out with a 0. 22μm filter, and this would be toxic for the TZM-bl. Hence, to increase viral titer we should not allow the cells to over grow, yet not leave them for a shorter period, as 48h is required for 293T to assemble the virus or virus like particle. Time constraints prevented a more detailed approach to exploit alternatives to increase viral titers, therefore compromising functional assays on these subjects.
Based on parallel research I helped develop in the lab, where functional assays, such as sensitivity to drugs and co-receptor tropism, were accessed, it is expected virus found early in infection to be more sensitive to entry inhibitors, such as CCR5 inhibitors and fusion inhibitors. Sensitivity to other drugs has not been shown to be altered over the course of infection (33). Briefly, sensitivity to T20, Maraviroc Rantes, TAK779 and soluble CD4 (entry inhibitors), to Azydothimidine (AZT), Efavirenz, Lopinavir and Raltegravir (retro-transcriptase, retro-(retro-transcriptase, protease and integrase inhibitors, respectively) was assessed. Serial dilutions of drugs were added to TZM-bl cells one hour prior to viral exposure in the case of entry inhibition or right before cells were infected in the case of enzyme inhibitors. Viral infection was assessed by βgal expression and drug concentration responsible for 50% inhibition (IC50) was determined. The patients analyzed were from a cohort of injection drug users who had plasma collected at two different time points. All the virus in this cohort were subtype B. Subtype B virus, as subtype D, do not appear to have evolving glycosylation patterns over the course of infection. As glycosylation is involved in
Illustration 8- Analysis of envelop fragments.Number of a.a obtained through BIOEDIT. A)gp160 B)gp41 C)gp120 D) V1-V5 E) V1-V4 F) V3
G)V1-V2. Number of potencial N-Gly sites obtained through HIV database‘s Glycosite tool. H)gp160 I)gp41 J)gp120 K) V1-V5 L) V1-V4 M) V3 N)V1-V2. Green represents late infection patients. Red represents RNA+/Ab- patients. Salmon represents RNA+/Ab+ patients.
co-receptor affinity (20) it is expect that virus from RAKAI cohort behave similarly to subtype B virus when entry inhibitors are concerned. Differences in mode of transmission can be perceived as potential confounding factors, but as there is in literature no consensus as for the role of mucosal immunity in the transmission process, these assumptions of a similar outcome when RAKAI virus are subjected to the same assays are very plausible.
As for co-receptor usage, according to literature, the earlier samples are expected to be R5 tropic, as for later samples it is harder to predict as subtype D virus have high rates of CXCR4 usage (12).
4. CONCLUSIONS
This study once completed will allow us to determine whether or not there are envelope signatures on subtype D, and maybe A, that could explain viral functional properties, especially the ones directly related to transmission and/or its prevention. So far, even if only as a trend, V1-V5 and the V3 loop appear to be shorter when envelope sequences are found in patients with up to three months of infection. It is interesting to note as well, that despite the length from some portions of envelope appear to be different, full-length envelope itself does not show the same trend. Glycosylation pattern remained unaltered in early and late isolates.
This study still requires a lot of work until we can get the kind of results we are expecting, none the less this statistical trends make us believe that we will be able find such signatures and get one step closer to stopping this dreadful disease.
5. REFERENCES
(1) UNAIDS 2009
(2) Surman et al. HIV-1 vaccine design, Harnessing diverse lymphocytes to conquer a diverse pathogen, Human Vaccines 5:4, 268-271; April 2009
(3) Wainberg, Two standards of care for HIV: Why are Africans being short-changed?
Retrovirology, 6:109 December 2009
(4) Overbaugh et al, Selection Forces and Constraints on Retroviral Sequence Variation,
Science New Series, vol 292, No.5519, 1106-110,9 May 2001
(5) Rambaut, The causes and consequences of HIV evolution, Nature reviews genetics,
Vol 5, 52-61, January 2004
(6) Rhodes, High Rates of Human Immunodeficiency Virus Type 1 recombination,
Journal of virology, Vol. 77, No. 20, 11193–11200 October 2003
(7) Perrin et al, Travel and the spread of HIV-1 genetic variants, Lancet Infect Dis; 3:
22–27, 2003
(8) http://www.hiv.lanl.gov
(9) Harris et al, Among 46 Near Full Length HIV Type 1 Genome Sequences from Rakai District, Uganda, Subtype D and AD Recombinants Predominate, Aids Research And
Human Retroviruses, Vol 18, No 17, 1281–1290, 2002
(10) 134LB Significant Decrease in Subtype D Prevalence in Rakai, Uganda
between 1994 and 2002, CROI 2009, poster abstract
(11) Baeten et al. HIV-1 Subtype D Infection Is Associated with faster disease
progression than subtypeA in spite of similar plasma HIV1 loads, The Journal of
Infectious Diseases; 195:1177–80, 2007
(12) Kiwanuka et al.,HIV-1 subtypes and differences in heterosexual HIV
transmission among HIV-discordant couples in Rakai, Uganda, AIDS, 23:000–000,
2009
(13) Wawer et al., Rates of HIV-1 Transmission per Coital Act by Stage of HIV-1
Infection, in Rakai, Uganda, The Journal of Infectious Diseases; 191:1403–9, 2005
(14) Gupta et al. Memory CD4(+) T cells are the earliest detectable human
immunodeficiency virus type 1 (HIV-1)-infected cells in the female genital mucosal tissue during HIV-1 transmission in an organ culture system, J Virol. 76(19):9868-76,
2002
(15) Zaitseva et al., Expression and function of CCR5 and CXCR4 on human
Langerhans cells and macrophages: implications for Primary infection, Nature Medicine, 3 (12), 1369-1375, 1997
(16) Asin et al 1 Type 1 Infection in Women: Increased Transcription of
HIV-1 Type HIV-1 in Ectocervical Tissue Explants. J Infect Dis, HIV-1HIV-1, HIV-19-25, 2009
(17) Meng et al,. Primary intestinal epithelial cells selectively transfer R5 HIV-1-1
to CCR5+ cells, Nat Med., 8(2):150-156, 2002 (18)
(19) Modrow et al., Computer-assisted analysis of envelope protein sequences of
seven human immunodeficiency virus isolates: prediction of antigenic epitopes in conserved and variable regions, Journal Of Virology, Vol. 61, No. 2, 570-578, 1987
(20) Li et al., Glycosylation Is Necessary for the Correct Folding of Human
Immunodeficiency Virus gpl20 in CD4 Binding, Journal Of Virology, Vol. 67, No. 1,
584-588, 1993
(21) Wei et al., Antibody neutralization and escape by HIV-1, Nature, Vol 422,
307-312, 2003
(22) Derdeyn et al., Envelope-constrained neutralization-sensitive HIV-1 after
heterosexual transmission, Science, 303, 2019-2022, 2004
(23) Chohan et al., Selection for Human Immunodeficiency Virus Type 1 Envelope
Glycosylation Variants with Shorter V1-V2 Loop Sequences Occurs during Transmission of Certain Genetic Subtypes and May Impact Viral RNA Levels, Journal
Of Virology, Vol. 79, No. 10, 6528–6531, 2005
(24) Sagar et al., Selection of HIV Variants with Signature Genotypic
characteristics during Heterosexual Transmission, J Infect Dis. 199(4): 580–589,
2009
(25) Fischer et al., Transmission of single HIV-1 genomes and dynamics of early
immune escape revealed by ultra-deep sequencing. PLoS ONE 5(8), 2010,
(26) Gorry et al., Changes in the V3 region of gp120 contribute to unusually broad
coreceptor usage of an HIV-1 isolate from a CCR5 Δ32 heterozygote, Virology 362,
163–178, 2007
(27) Salazar-Gonzalez et al., Deciphering human immunodeficiency virus type 1
transmission and early envelope diversification by single-genome amplification and sequencing, Journal Of Virology, Vol. 82, No. 8, 3952–3970, 2008
(28) Marozsan et al., Development of a yeast-based recombination cloning/system
for the analysis of gene products from diverse human immunodeficiency virus type 1 isolates, Journal of Virological Methods 111, 111-120, 2003
(29) Sobansky, Dickinson, A simple method for the direct extraction of plasmid
DNA from yeast, Biotechnology Techniques, Vol 9 No.3,225-230, 1995
(30) Wei et al., Emergence of resistant human immunodeficiency virus type 1 in
patients receiving fusion inhibitor (T-20) monotherapy, Antimicrobial Agents And