2016
UNIVERSIDADE DE LISBOA FACULDADE DE CIÊNCIAS
Solar Energy Potential in a Changing Climate:
Iberia and Azores Assessment Combining Dynamical and
Statistical Downscaling Methods
Doutoramento em Sistemas Sustentáveis de Energia
Clarisse Magarreiro
Tese orientada por: Professor Doutor Miguel C. Brito Professor Doutor Pedro M. M. Soares
Júri: Presidente:
● Dr. João C. C. Catalão Fernandes
Vogais:
● Dr. Eduardo M. V. Brito de Azevedo ● Dr. João C. Andrade dos Santos ● Dr. João M. de Almeida Serra ● Dr. Pedro M. M. Soares
Documento especialmente elaborado para a obtenção do grau de doutor
i
Acknowledgements
I would like to thank my two advisors, Prof. Miguel Centeno Brito and Prof. Pedro Matos Soares for their scientific guidance, friendship, motivation, for dealing with my frustrations and deadlines. To Prof. Miguel I am especially grateful for his serenity and stabilizing presence which helped me so much in moments of self-doubt and to Prof. Pedro for constantly challenging me to go beyond what I thought I was capable which lead me to grow immensely not only scientifically but also personally.
I am also thankful to Rita Cardoso for all the help in the statistical analysis, for the ideas and comments throughout the development of the thesis especially in the co-authored scientific papers.
To Ricardo Tomé, for solving the technical problems of the cluster and for providing the data of the WRF model for the Azores and also to Daniela Lima who, together with Rita, helped in obtaining the WRF data for Iberian Peninsula. Thank you.
I am grateful to Martin Widmann for hosting me at University of Birmingham during my 5 weeks visit. Thank you for being willing to share your knowledge and for making me feel welcomed in Birmingham. I have enjoyed working with you immensely.
Não existem palavras que quantifiquem o quão grata estou aos meus pais, Teresa e Manuel, e à minha irmã, Ana, que sempre me motivaram e apoiaram de todas as maneiras possíveis durante todo este processo. Viveram comigo intensamente todas as conquistas e dificuldades que encontrei nos últimos anos e, portanto, considero este trabalho como um pedaço de cada um deles.
Ao Ricardo, pela paciência inesgotável que teve ao me acompanhar em todos os momentos críticos e por ser diariamente um suporte inigualável e inquestionável durante todo o desenvolvimento do meu trabalho. Obrigado por me ajudares a tornar tudo mais fácil e por me impulsionares sempre no meu crescimento consciencial.
I extend also my appreciation to Prof. João Serra who, by being the MIT Portugal Program coordinator of the Sustainable Energy Systems at Faculdade de Ciências da Universidade de Lisboa, was always available to solve any bureaucratic situation concerning the development of the PhD.
ii
I acknowledge the funding I received from the Portuguese Science Foundation (FCT), under the doctoral grant SFRH/BD/79544/2011 and the MIT Portugal Program on Sustainable Energy Systems for the framework provided. I also acknowledge the funding obtained in the framework of the Short Term Scientific Missions of COST Action (European Cooperation in Science and Technology): Validating and Integrating Downscaling Methods for Climate Change Research (VALUE) which allowed me to develop part of my work in my 5 weeks stay at the University of Birmingham.
iii
Abstract
The proper characterization of solar radiation resource is essential for the design of any solar energy harnessing systems which aims its optimal performance. To this end, the solar resource is often quantified through solar radiation measurements at meteorological stations. Unfortunately radiation data recorded on the desired location is often inexistent. Furthermore, the actual existing solar radiation databases have also a limited temporal span and, more frequently than desired, missing values and non-uniform formats. Also, such databases consist almost entirely of global solar radiation; variables such as the nature of the solar energy (direct or diffuse) are rarely recorded.
Atmospheric models can add value to solar energy applications by enabling solar resource assessments as they easily overcome the limited spatial and temporal coverage of irradiance measuring networks. Furthermore, climate models can be used for any region of the planet to assess the solar resource for not only present climate conditions but also to analyse its long-term past evolution and future tendency. Nowadays such models are a popular approach on the field of solar radiation forecasting but the quality evaluation of the solar radiation representation by such models is first of all a fundamental step to understand its usefulness. Having this in mind, in this thesis, a dynamical downscaling approach is used to evaluate simulated solar radiation at the Earth’s surface which will then enable the characterization of the solar resource. The model output is also combined with a statistical downscaling approach used in its simplest form to minimize the model biases. The work focuses primarily in the Iberian Peninsula as its large climate gradients are representative of diverse meteorological conditions, enabling therefore the adaptation of the presented methods to other regions. Then, following the same methodology, the solar resource of the Azores archipelago is also addressed. The Azores region is often neglected in solar resource assessments and solar resource maps of the Earth’s surface or even of Europe region. These methods are used to characterize the present climate renewable solar resource and analyse the impact of climate change on its projections for the end of the 21st century for both Iberia Peninsula and Azores archipelago.
iv
Atmospheric numerical models are however limited in the sense that they only provide global solar radiation, the direct normal radiation and diffuse components are not common outputs to the user. Given this, the separation of global radiation into its diffuse and direct components is analysed in this thesis through models of diffuse solar radiation fraction. One important characteristic of these models is that they are empirically derived from site-specific measurements and a model developed and validated in a very site-specific climate type region may not hold its suitability to other regions. This thesis focuses on the assessment of such models only for the Azores region which has not been object of this type of analysis before.
Keywords:
Solar Resource; Iberian Peninsula; Azores; Dynamical downscaling; Bias Correctionv
Resumo
A viabilidade técnica e económica de qualquer sistema energético solar que visa o seu desempenho óptimo é sustentada na existência de informação confiável e exacta sobre o recurso solar disponível no local pretendido para a sua implementação. Idealmente, a informação de recurso solar deve reunir características tais como valores médios e sua variabilidade no espaço e no tempo. Além disso três componentes da radiação solar são fundamentais na análise do recurso: radiação difusa, directa e global. A radiação difusa diz respeito à radiação dispersa existente como resultado das interacções da radiação extraterrestre com a atmosfera terrestre. A radiação directa é radiação que atinge a superfície terrestre directamente em linha com o disco solar e ao conjunto de radiação difusa e directa é chamado de radiação global (ou total). Os dados de radiação global são necessários para cálculos de cargas de aquecimento e arrefecimento em arquitectura; sistemas solares térmicos e fotovoltaicos mas, quando estão em causa sistemas de concentração, é indispensável possuir informação sobre a radiação directa.
Devido aos elevados custos de implementação e manutenção de estações meteorológicas que façam recolha de dados de radiação solar de forma consistente e fiável a probabilidade de pré-existirem dados de radiação registados nesse mesmo local é baixa. Como consequência a este facto, a densidade de pontos de medidas desta variável é limitada o que implica então que se recorra a métodos alternativos de avaliação do recurso. Uma base de dados de recurso solar pode ser construída com técnicas de interpolação aplicadas a dados climatológicos mas a estimação de dados através deste processo introduz erros nos dados espacialmente estimados que aumentam com a distância entre os pontos de interesse e o ponto onde foram realmente recolhidas as medidas de radiação solar.
Quando existentes, as medidas de radiação solar dizem respeito a, maioritariamente, valores de radiação solar global. Variáveis como radiação directa ou radiação difusa são pouco frequentes em bases de dados desta variável.
Hoje em dia também dados obtidos via satélite são usados para obter informação relativa à radiação solar que alcança a superfície terrestre. Os dados podem ser recolhidos
vi
por satélites de órbita polar ou geoestacionários. Como os satélites de órbita polar facultam imagens com baixa resolução temporal, as imagens obtidas por satélites geoestacionários são as normalmente usadas em estudos de radiação solar. Este tipo de satélites garante imagens com uma resolução temporal que pode chegar aos 15 minutos e resolução espacial que pode atingir 1 km no ponto imediatamente abaixo do posicionamento do satélite. No entanto, dado que este tipo de satélites são posicionados num ponto longitudinal fixo acima do equador, a sua resolução espacial decai com a latitude e a sua relevância em latitudes acima dos 60-70° norte ou sul é bastante limitada. Os modelos atmosféricos podem então ser considerados como uma mais valia para estudos de recurso solar por facilitarem a obtenção de dados regularmente espaçados na superfície terreste e consistentes em termos temporais e formatação dos mesmos. Estes modelos simulam o sistema climático e quantificam a resposta climática às interacções entre os seus vários componentes. Entre os modelos atmosféricos é feita a distinção entre modelos globais e modelos regionais. Os modelos globais reproduzem as principais características do sistema climático, mas uma vez que são de demasiada baixa resolução para descrever adequadamente os processos de mesoescala, para aplicações regionais é então apropriado usar modelos regionais. Os modelos regionais simulam então o sistema climático em domínios espaciais limitados. Estes últimos requerem para a sua execução informação para as condições fronteira do sistema que é por sua vez fornecida pelos modelos globais. Ao processo de usar modelos regionais para representar subdomínios de modelos globais é denominado dynamical
downscaling (redução de escala dinâmico). Uma vez que estes modelos são formulados
usando princípios físicos, possuem grande potencial para capturar as características não lineares de mesoescala e fornecer informação coerente entre múltiplas variáveis meteorológicas. Além disto, os modelos atmosféricos são úteis não só para analisar as condições de clima presente mas também para estudo de tendências passadas e de clima futuro.
As simulações numéricas destes modelos não são no entanto imunes à existência de erros. No caso dos modelos regionais além dos erros inerentes da formulação do modelo (parametrização de processos de pequena escala) também estão susceptíveis a erros herdados através das condições fronteiras que são o resultado de simulações de modelos globais. Dado isto, é frequentemente usado uma qualquer abordagem estatística que constitua o pós-processamento dos resultados obtidos através dos modelos dinâmicos. Os modelos estatísticos usados envolvem tipicamente o desenvolvimento de relações entre os preditores adquiridos através dos modelos dinâmicos e a variável desejada (o preditante). Este processo além de ser conhecido como um simples pós-processamento estatístico é também referido neste contexto como statistical downscaling (redução de escala estatístico). Esta última definição evidencia que os resultados dos modelos atmosféricos, mesmo que se referindo a simulações de elevada resolução, podem ser submetidos a processamento adicional para obter um valor que foi sujeito a uma redução de escala ao ponto de ser equiparável a um valor obtido localmente.
vii
Na presente tese, uma abordagem de dynamical downscaling é usada para avaliar simulações de radiação solar à superfície terrestre. No âmbito do presente trabalho este processo é representado pelo modelo atmosférico WRF (Weather Research and
Forecasting). O WRF é um modelo de mesoescala de simulação de sistema climático com
capacidade para funcionar tanto para a operacionalidade dos centros meteorológicos como para pesquisas atmosféricas. Reúne várias e diferentes escolhas em termos de parametrizações físicas incluindo microfísica; parametrização de cumulus; camada limite planetária; modelos de superfície terrestre e radiação de grande e pequeno comprimento de onda. Os resultados das simulações do modelo são combinados com uma abordagem de
statistical downscaling. Em termos práticos, na tese, esta abordagem é representada por
métodos que visam a correcção do viés dos dados simulados através da abordagem de
dynamical downscaling. Estes métodos são usados para caracterizar o recurso solar em
clima presente e para analisar o impacto do clima futuro nas projecções de recurso solar para o final do século XXI. O trabalho desenvolvido foca primeiramente a Península Ibérica dado que os seus gradientes de clima são representativos de diversas condições meteorológicas proporcionando assim a adaptação dos métodos apresentados a outras regiões. Além disto, a Península Ibérica é identificada como uma das regiões mais responsivas à mudança de clima futuro. O trabalho foca também, usando a mesma metodologia, a caracterização do recurso solar no arquipélago dos Açores. A região dos Açores é frequentemente negligenciada em estudos de recurso solar ou em publicações de mapas solares da Terra ou até mesma da Europa.
Uma vez que as simulações de radiação solar do modelo WRF irão ultrapassar as limitações encontradas em dados medidos in situ no que diz respeito à consistência espacial e temporal dos mesmos, há que considerar o facto de que os dados simulados dizem respeito apenas a radiação solar global. Assim, a separação da radiação solar global nas suas componentes difusa e directa é também analisada no âmbito da presente tese através de modelos de fracção de radiação difusa. Estes modelos têm como objectivo a estimação de radiação difusa numa superfície horizontal baseando se em dados de radiação solar global medidos na mesma superfície. Através da relação fundamental entre as componentes difusa, directa e global é então possível inferir não só os valores de radiação difusa como também os valores de radiação directa. A variedade existente deste tipo de modelos é consequência, principalmente, do tipo de parâmetros de entrada usados nos mesmos. Os mais simples e comuns são modelos que usam apenas informação da radiação global. Modelos mais sofisticados podem no entanto requerer parâmetros e variáveis meteorológicas tais como informação de nebulosidade, turbidez atmosférica ou temperatura. No geral, a maioria dos modelos de fracção de radiação difusa dependem de correlações entre o índice de céu limpo e a fracção de radiação difusa. Estas correlações são expressas em termos de polinómios de 1° a 4° grau, modelos logísticos ou até exponenciais. No entanto há que considerar uma importante limitação dos modelos de fracção de radiação difusa. Como são derivados empiricamente a partir de medidas in situ, um modelo desenvolvido e validado numa região com um clima muito específico pode não ser
viii
adequado para uma outra qualquer região. No presente trabalho, este tópico é apenas explorado para o arquipélago dos Açores. Para a Península Ibérica é possível encontrar na literatura vários estudos onde este tipo de modelos foi desenvolvido e validado. No entanto, a região dos Açores não foi até então considerada neste tipo de estudos. Além disso, a região dos Açores é conhecida por ter um padrão de condições meteorológicas diferentes da Península Ibérica, caracterizado com uma maior ocorrência de estados nebulosos.
Palavras-Chave:
Recurso solar; Península Ibérica; Açores; Dynamical downscaling; Correcção viésix
Contents
Acknowledgements i
Abstract iii
Resumo v
List of Acronyms, Abbreviations and Symbols xiii
List of Figures xv
List of Tables xix
1 - Introduction 1 1.1 Introduction ... 1
1.2 Solar radiation at Earth’s surface ... 3
1.3 Solar radiation data simulated by atmospheric models ... 5
1.4 Models of diffuse solar fraction ... 6
1.5 Aims and outline ... 7
1.6 Publications ... 8
2 – Description of the data sets used 11 2.1 Ground based observations and study regions ... 11
2.2 Cloud fractional cover ... 13
2.3 WRF climate simulations ... 14
3 – Methodology fundamentals 17 3.1 Standard statistical errors ... 17
3.2 Statistical downscaling ... 18
x
3.4 Validation framework of the MOS ... 21
4 - Energy resource from dynamical and statistical downscaling methods: an Iberian solar irradiance assessment 23
4.1 Background ... 24
4.2 Data and methods ... 26
4.3 Results and discussion ... 27
4.4 Iberian Peninsula solar resource maps ... 33
4.5 Conclusions ... 36
5 - Combining high resolution dynamical downscaling and quantile mapping for future projections of the Iberian Solar Resource 39
5.1 Background ... 40
5.2 Model data and observations ... 42
5.3 Biases in mean and variance of the historical reference model simulation ... 42
5.4 Combining high resolution dynamical downscaling and quantile mapping: MOS on WRF solar radiation ... 44
5.5 Iberian solar resource in a changing climate ... 45
5.5.1 Iberian solar resource in a changing climate: station-wise evaluation results ... 45
5.5.2 Iberian solar resource in a changing climate: broadening station-wise results to a gridded evaluation ... 50
5.6 Conclusions ... 51
6 – Azores solar energy resource from bias-corrected regional climate simulation: present climate and future projections 53
6.1 Background ... 54
6.2 Data sets used ... 55
6.3 Present Climate ... 56
6.3.1 Evaluation of WRF simulation in presente climate conditions ... 56
6.3.2 Model Output Statistics in present climate conditions ... 57
6.3.3 Azores solar resource maps ... 59
6.4 Future Climate ... 61
6.4.1 Biases in mean and variance of the historical reference WRF simulation ... 62
6.4.2 Model Output Statistics in future climate conditions ... 62
6.4.3 Azores solar resource for future climate ... 63
6.5 Conclusions ... 69
7 - Assessment of diffuse radiation models for cloudy atmospheric conditions in the Azores region 73
xi
7.2 Models and methods ... 75
7.2.1 Diffuse fraction – clearness index regression models ... 75
7.2.2 Diffuse fraction – clearness index and additional parameters regression models ... 77
7.3 Data ... 78
7.4 Performance results and discussion ... 79
7.5 Conclusions ... 87
8 – Final conclusions and future work 89
Appendix A 95
Appendix B 97
Appendix C 101
xiii
List of Acronyms, Abbreviations and Symbols
BIAS Bias Error
CDF Cumulative Distribution Function
D Diffuse radiation
G Global radiation
GCM Global climate model
Gex Global extraterrestrial radiation
I Direct normal radiation
IP Iberian Peninsula
kd Diffuse fraction
kt Clearness index
LR Linear Regression
m Air mass
MAE Mean Absolute Error
MAPE Mean Absolute Percentual Error
MOS Model output statistics
PDF Probability Density Function
PV Photovoltaic
QM Quantile mapping
r Correlation coefficient
RCM Regional climate model
RMSE Root Mean Square Error
S Skill Score
WRF Weather Research and Forecasting
θ Zenith angle
ρ Clear sky index
σn Normalized standard deviation
xv
List of Figures
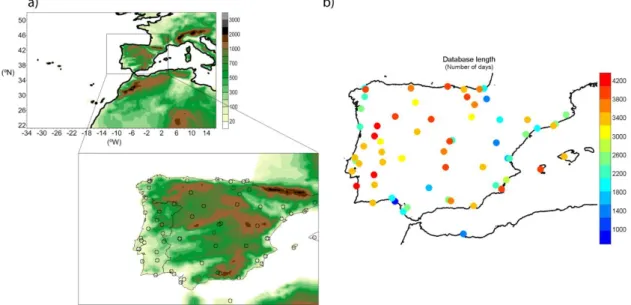
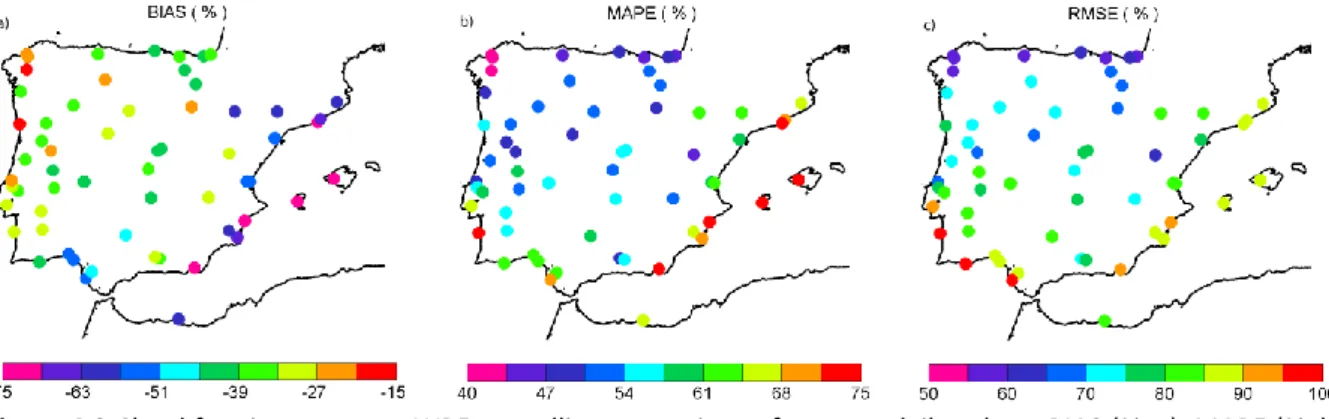
Figure 2.1. (a) WRF model outermost (full, dx = 27 km), and inner (zoomed area, dx = 9 km) domains with corresponding WRF topography and (b) location of ground measurements stations with corresponding number of valid days used in this study. ... 15 Figure 2.2. (a) WRF model outermost (dx = 24 km, orange), and inner (dx = 6 km) domains (cyan: western group; purple: central group; green: eastern group) and (b) location of the ground measurements stations used in the present study (red crosses). ... 16 Figure 3.1. Schematic representation of the QM method. Solid black dots shows observations CDF and dashed line shows model simulation CDF. Illustration from Teutschbein and Seibert (2012). ... 21 Figure 4.1. Statistical performance results for daily observations of global solar radiation versus WRF simulated data obtained for the Iberian Peninsula: BIAS (a), MAPE (b) and RMSE (c) are shown in relative magnitude (%, top row). Correlation coefficient (d), normalized standard deviation (e) and PDF skill score (%, f) results are also shown (bottom row)... 28 Figure 4.2. Cloud fraction coverage WRF – satellite comparison of average daily values: BIAS (%, a), MAPE (%, b) and RMSE (%, c). ... 30 Figure 4.3. From left to right columns: relative BIAS, normalized standard deviation (𝝈𝒏) and
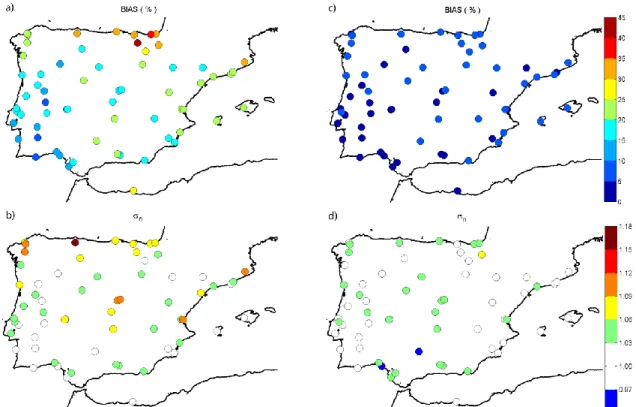
skill score (S) for the MOS-corrected WRF: quantile mapping (QM, top row), linear regression (LR, middle row), and normalized frequencies of the values at the stations (bottom row). . 32 Figure 4.4. Annual and seasonal averages of daily simulated WRF solar radiation for present climate combined with MOS on the analysed locations. ... 33 Figure 4.5. Annual and seasonal corrected WRF global solar radiation and solar electricity potential for the Iberian Peninsula present climate. Values are shown in W/m2 indicating the mean (annual and seasonal) global solar radiation and in kWh/kWp for the sum (annual and seasonal) of solar electricity generated by a 1kWp system with performance ratio 0.75. .... 35 Figure 5.1. Relative BIAS and normalized standard deviation (ratio of standard deviation from historical simulation values and observations, σn) between historical simulation and
observations: (left panel: a and b) uncorrected historical data and (right panel: c and d) corrected historical data. ... 43
xvi
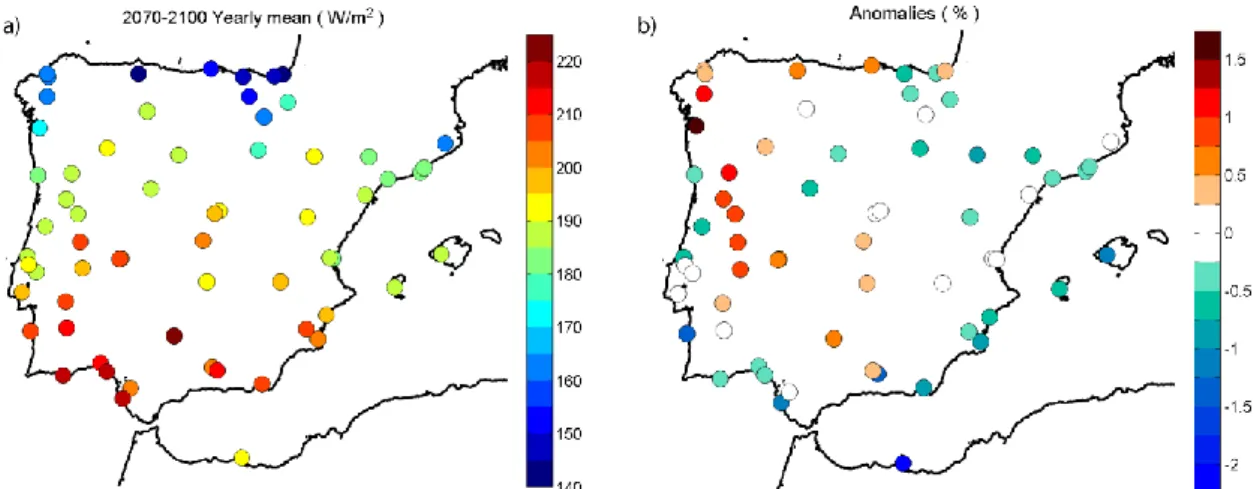
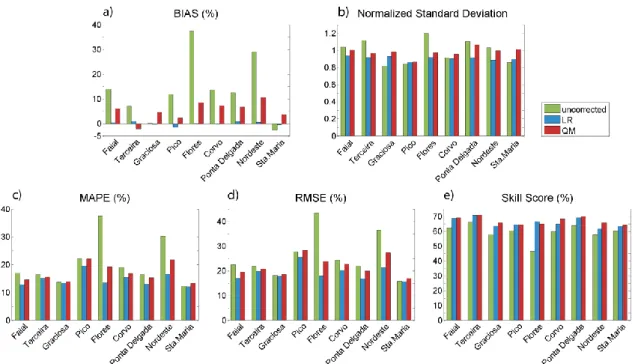
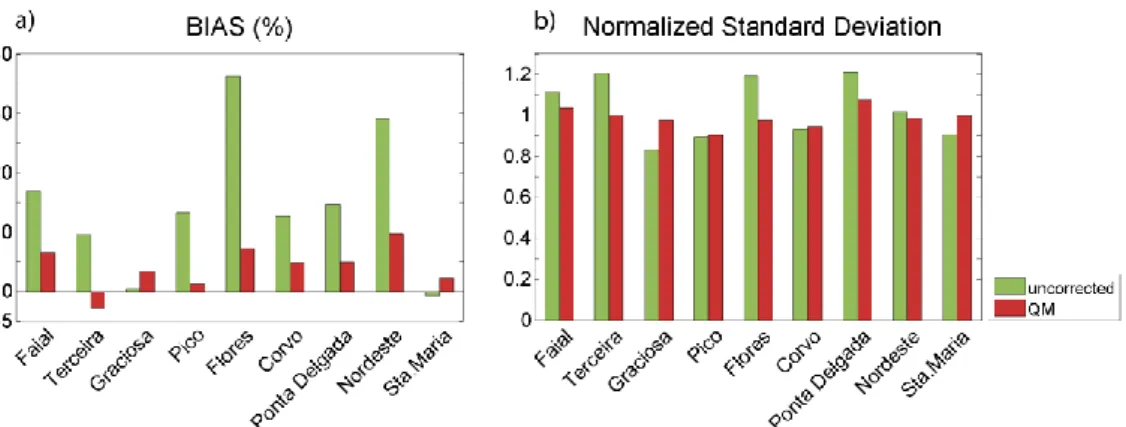
Figure 5.2. Yearly mean of (a) projected WRF solar radiation for the end of the century (2070-2100) after correction and (b) respective anomalies considering historical climate run (1970-2000) as baseline. ... 47 Figure 5.3. Monthly mean of (a) projected WRF solar radiation for the end of the century (2070-2100) after correction and (b) respective anomalies using historical climate simulation as baseline. ... 49 Figure 5.4. (a) Yearly mean map of projected WRF solar radiation for the end of the century (2070-2100) with interpolated probability-dependent correction function and (b) respective anomalies considering historical climate run (1970-2000) as baseline. ... 51 Figure 6.1. Statistical performance results for multi-year daily mean data obtained for Azores islands and the MOS-corrected WRF. (a) BIAS, (c) MAPE and (d) RMSE are shown in relative magnitude (%) for linear regression (LR, blue) and quantile mapping (QM, red). (e) Skill score and (b) normalized standard deviation are also presented. The results of both methods are plotted next to the statistical results obtained from the uncorrected solar radiation WRF values (green). ... 58 Figure 6.2. Annual corrected WRF global solar radiation for the Azores archipelago 1989-2010 present climate. Values are shown in W/m2. ... 60 Figure 6.3. Seasonal corrected WRF global solar radiation for the Azores archipelago 1989-2010 present climate. Values are shown in W/m2. ... 61 Figure 6.4. a) Relative BIAS and (b) normalized standard deviation results for multi-year daily mean data obtained for Azores islands and the QM-corrected (red) WRF historical reference. The results are plotted next to the statistical results obtained from the uncorrected solar radiation WRF historical reference values (green). ... 63 Figure 6.5. (a; b) Annual mean maps (W/m2) of projected WRF solar radiation for the mid (2040-2059, left panel) and end of the century (2080-2099, right panel) after correction and (c; d) respective anomalies (%) considering the historical climate run (1989-2010) as baseline. ... 65 Figure 6.6. Seasonal mean maps (W/m2) of projected WRF solar radiation for the mid (2040-2059, left panel) and end of the century (2080-2099, right panel) after MOS correction. .. 67 Figure 6.7. Anomalies (%) of projected WRF solar radiation for the mid (2040-2059, left panel) and end of the century (2080-2099, right panel) after MOS correction considering the historical climate run (1989-2010) as baseline. ... 69 Figure 7.1. Hourly global and diffuse irradiance: values corrected with QCRAD. ... 79
xvii
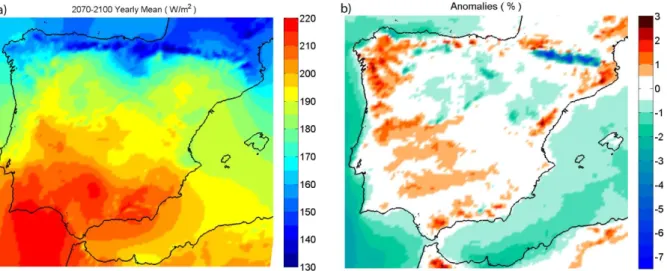
Figure 7.2. The hourly diffuse fraction kd (measured values) as a function of clearness index kt. Grey region represents the band between the 25th and 75th quantile and in red is the mean line. ... 80 Figure 7.3. Diffuse irradiance measured vs. diffuse irradiance predicted trough the different models. Straight lines represent diagram diagonal. ... 81 Figure. 7.4. Location of kt-kd pair’s which correspond to diffuse radiation above 300 W/m2 (red dots) in the clearness index kt – diffuse fraction kd scatter plot. ... 83 Figure 7.5 Probability density functions for the tested models and the measured data. ... 84 Figure 7.6. Statistical performance of the models for calculating the diffuse irradiance in different bins of cloud cover: a) RMSE and b) MBE. ... 86 Figure 7.7. a) - Diffuse irradiance measured vs. Diffuse irradiance predicted trough the proposed model. Straight line represent diagram diagonal. b) – Probability density function for the RBL model (blue), measured diffuse irradiance (black) and BRL model with the proposed modification in this work (red). ... 87 Figure A1. Statistical performance results for daily data obtained for the Iberian Peninsula: BIAS (a), MAE (c) and RMSE (e) are shown in absolute magnitude (W/m2). ... 95 Figure A2. MAPE (left column) and relative RMSE (right column) after implementation of the MOS methods: quantile mapping (QM, top row) and linear regression (LR, middle row). Normalized frequencies of the respective statistical values with overlapping of the LR (orange) and QM (blue) results (bottom row). ... 95 Figure A3. Annual average of (a) simulated uncorrected WRF solar radiation and (b) corrected with MOS for the Iberian Peninsula present climate. a) and b) were determined using interpolated probability-dependent correction function in all the individual grid points of the WRF IP domain obtained from the station-wise QM method. c) represents the localized analysis and is plotted side by side the solar radiation maps with equivalent colour scheme for illustration purposes. ... 96 Figure B1. Spanish provinces and regions (Tardío et al. 2006). ... 97 Figure B2. Relative BIAS between corrected historical simulation and observations. ... 97 Figure B3. Yearly anomalies (W/m2) of corrected WRF solar radiation projections for the end of the century (2070-2100) using historical climate simulation as baseline. ... 98 Figure B4. Monthly anomalies (W/m2) of corrected WRF solar radiation projections for the end of the century (2070-2100) using historical climate simulation as baseline (b). ... 98
xviii
Figure B5. (top panel) Yearly mean solar radiation map and (bottom panel) anomalies of projected WRF (a and d) uncorrected and (b; e; c and f) corrected data in the WRF IP domain for the end of the century (2070-2100). b) and e) were determined using interpolated probability-dependent correction function obtained from the station-wise equidistant CDF mapping method in all the individual grid points of the WRF IP domain. c) and f) represent the localized analysis and are plotted side by side the solar radiation maps for illustration purposes. In f) stations flagged with a cross indicate the locations where baseline and future annual means are, at 90% significance level, not equal in both corrected and uncorrected WRF data. ... 99 Figure B6. (top panel) Monthly means solar radiation map and (bottom panel) anomalies of projected WRF (a and d) uncorrected and (b; e; c and f) corrected data in the WRF IP domain for the end of the century (2070-2100). b) and e) were determined using interpolated probability-dependent correction function obtained from the station-wise equidistant CDF mapping method in all the individual grid points of the WRF IP domain. c) and f) represent the localized analysis and are plotted side by side the solar radiation maps for illustration purposes. The monthly plots are displayed in way to each column represent a given season: Winter; Spring; Summer and Autumn from left to right. ... 100 Figure C1. Land mask of WRF 6km resolution. Cross signs represent the points that the model considers as land. ... 101 Figure C2. Annual (a) uncorrected and (b) MOS corrected WRF global solar radiation for the Azores archipelago 1989-2010 present climate. Values are shown in W/m2. ... 101 Figure C3. Annual (a; b) uncorrected and (b; d) MOS corrected WRF global solar radiation for the Azores archipelago at the mid (2040-2059, top panel) and end of the century (2080-2099, bottom panel). Values are shown in W/m2. ... 102 Figure C4. (a; c) uncorrected and (b; d) MOS corrected WRF solar radiation anomalies (%) for the mid (2040-2059, top panel) and end of the century (2080-2099, bottom panel) considering the historical climate run (1989-2010) as baseline. ... 103
xix
List of Tables
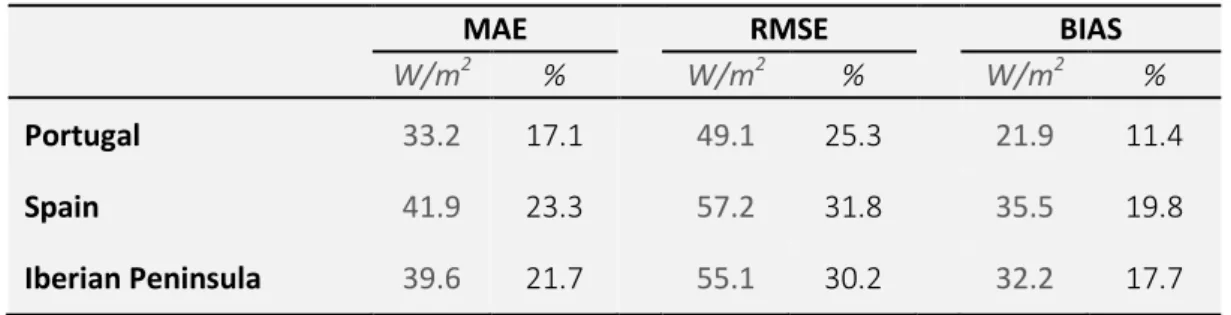
Table 4.1. Statistical performance results for annual average data obtained from Iberian Peninsula after pooling together the individual stations datasets. Results from Portugal and Spain individual set of stations are also shown. MAE, RMSE and MBE are shown in absolute (W/m2) and in relative magnitude (%). ... 29 Table 6.1. Statistical performance results for multi-year daily mean data obtained for Azores islands and WRF 6km resolution. MAE, RMSE and BIAS are shown in absolute (W/m2) and in relative magnitude (%). Correlation coefficient (r), skill score (S) and normalized standard deviation (𝝈𝒏) are also presented. (The superscripts C; W and E indicate Cental; Western or
Eastern Group.) ... 56 Table 6.2. BIAS, shown in absolute (W/m2) and relative magnitude (%), and normalized standard deviation (𝝈𝒏) results for multi-year daily mean data obtained for Azores islands
and WRF 1989-2010 historical reference simulation. (The superscripts C; W and E indicate Cental; Western or Eastern Group.) ... 62 Table 7.1. Coefficients and kt intervals of the polynomial models applied. ... 76 Table 7.2. Statistical performance of the diffuse irradiance models analysed. The new model is presented further on this section. ... 83 Table C1. Statistical performance results for multi-year daily mean data obtained for Azores islands and the MOS-corrected WRF. MAPE, RMSE and BIAS are shown in relative magnitude (%) for linear regression (LR) and quantile mapping (QM). Skill score (S) and normalized standard deviation (𝝈𝒏) are also presented. (The superscripts C; W and E indicate Cental;
Western or Eastern Group.) ... 104 Table C2. Annual mean (W/m2) of projected WRF solar radiation for the mid (2040-2059) and end of the century (2080-2099) after correction and respective anomalies (%) considering the historical climate run (1989-2010) as baseline. (The superscripts C; W and E indicate Cental; Western or Eastern Group.) ... 104
1
Chapter 1
Introduction
1.1
Introduction
The technical and economic viability of a system deployment of any solar energy harnessing technology is directly dependent on the corresponding resource availability. Hence it is essential to have better understanding of the resource characteristics, such as means and variability in space and time, which will enable the appropriate design of the harnessing technology and the maximization of its performance. To this end, the solar resource is often quantified through solar radiation measurements at meteorological stations. However, deploying and maintaining a measuring network for solar radiation is costly and thus the spatial coverage of measured irradiance values is frequently limited and sparse. Furthermore, the existing solar radiation databases have also a limited temporal span and, more frequently than desired, missing values and non-uniform formats which may hinder their usefulness (Paulescu et al., 2013). Also, such databases consist almost entirely of global solar radiation; variables such as the nature of the solar energy (direct or diffuse) or the total cloud cover amount are rarely recorded on hourly basis.
Due to high initial investment and maintenance costs of deploying a solar radiation measurement network, and due to the limitations of the database spatial coverage, interpolation (or extrapolation) of available data for estimating a given location is often required. This estimation however introduces errors on the spatially simulated data which will increase with the distance between the point of interest and the data acquisition spot (Journée & Bertran, 2010).Presently, also satellite data is used to retrieve information over solar radiation at Earth’s surface. The methods used to derive solar radiation from satellite imagery are often categorized into empirical or physical models (Badescu, 2008). Physical models rely on radiation-transfer equations to analyse the brightness seen by the satellite in different wavelengths using for that end precise information about the composition of the
1. Introduction
2
atmosphere which must be acquired by accurately calibrated satellite sensors. Empirical models may, on the other hand, consist of only a simple regression between the satellite visible channel’s recorded intensity and a measuring station at the Earth’s surface (Kleissl, 2013). Nowadays however, most of currently used models contain both empirical and physical information (Badescu, 2008). Since polar orbit satellites provide a low temporal frequency of images, geostationary satellites are often used when information about solar radiation variability is required. Such satellites can offer a temporal resolution of up to 15 min and a spatial resolution reaching approximately 1 km at satellite nadir (subsatellite point) (Paulescu et al., 2013). However, geostationary satellites are always positioned above a fixed longitudinal point over the equator and consequently the spatial resolution decreases with the latitude (Badescu, 2008; Kleissl, 2013). Their use in latitudes beyond 60-70 degrees north or south is therefore rather limited (Badescu, 2008; Kleissl, 2013).
Atmospheric models can add value to solar energy applications by enabling solar resource assessments as they easily overcome the limited spatial and temporal coverage of irradiance measuring networks. Furthermore, climate models can be used for any region of the planet, have associated relatively low costs and missing data is not an issue. For regional applications it is appropriate to use regional climate models (RCMs), which are limited-area high-resolution models driven by boundary conditions from either standard simulations with global general circulation models (GCMs) or atmospheric reanalysis, which assimilate observational information (Giorgi, 1990; Rummukainen, 2010). Reanalysis-driven simulations aim to represent the actual weather during the last few decades, while standard GCM simulations are typically used to investigate the response of past and future climate to natural and anthropogenic forcing (Meehl et al., 2007). GCMs though are appropriate to capture the large-scale atmospheric circulations but, for understanding the local effects on regional areas RCMs must come into play. Local features that affect the atmospheric flow such as topography and coastal processes require finer resolution simulations to reproduce the observed weather (Soares et al., 2012a). The process of using high-resolution RCMs to represent regional sub-domains which assimilate beforehand either reanalysis or lower-resolution GCMs data as their boundary conditions is denominated dynamical downscaling. Since these models are formulated using physical principles, dynamical downscaling has the potential for capturing mesoscale to small-scale nonlinear effects and providing coherent information among multiple climate variables. Besides, such models can reliably reproduce a broad range of climates around the world which gives confidence in their ability to downscale realistically future climate (Christensen et al., 2007). Numerical models can then be useful not only to assess the solar resource for present climate conditions but also to analyse its long-term past evolution and future trends.
Simulations with RCMs, by relying on global models for their initial and boundary conditions, may inherit the biases of the global model on which it relies and besides, the RCM itself may cause bias on its output. A variety of errors may arise due to the necessary parameterizations for the numerous atmospheric small-scale processes that have to be parameterized in the dynamical downscaling process. Even without considering the
1. Intoduction
3
complexity of cloud simulation and its impact on the proper representation of solar radiation by the numerical models, deficiencies in water-vapour absorption, inaccurate representation of ozone and aerosols play an important part on possible causes of error on the simulation of irradiance (Kleissl, 2013). It is however extremely difficult to pinpoint the source of model errors due to the strong feedback and interactions among physical processes in the atmosphere (Kleissl, 2013). In reanalysis-driven simulations the errors from the driving conditions are reduced, but substantial RCM-generated biases are still present (Kotlarski et al. 2014; Soares et al., 2012b; van der Linden and Mitchell, 2009). Given this, statistical approaches are used to post-process the results of the dynamical models. In addition to offering a way to deal with model biases, they can also provide quantities not represented by the numerical model or be used for downscaling from the grid-cell scale to a given location (Wilks, 2006). The statistical methods typically involve the establishment of links between the grid-scale or large-scale predictors and the desired predictand variable. This process is referred to as statistical post-processing or statistical downscaling. This latter term highlights that the atmospheric numerical model output, even if referring to a high-resolution dynamical downscaling, can be further processed to obtain a downscaled value of the desired variable at a given location from the grid-cell scale of the model. The statistical downscaling concept in the scope of the present thesis is discussed in detail in Chapter 3.
Atmospheric numerical models are becoming a popular approach on the field of solar radiation forecasting and resource assessment but the quality evaluation of the solar radiation representation by such models is first of all a fundamental step to understand its usefulness. In this thesis, a dynamical downscaling approach is evaluated and used to simulate solar radiation at the Earth’s surface. The model output is also combined with a statistical downscaling approach to minimize the model biases. These methods are used to characterize the present climate renewable solar resource and analyse the impact of future climate on its projections for the end of the 21st century. The work focuses primarily in the Iberian Peninsula, since its large climate gradients are representative of diverse meteorological conditions, enabling therefore the adaptation of the presented methods to other regions. Furthermore, the Iberian Peninsula has been identified as one of the most vulnerable regions to global climate change (Giorgi, 2006). The present work also addresses, with the same methodology, the solar resource of the Azores archipelago. The Azores region is often neglected in solar resource assessments and solar resource maps of the Earth’s surface or even in Europe region.
The following sections included in this chapter describe some basic concepts and background for the motivation and aims of the thesis, which are collected in Section 1.5.
1.2
Solar radiation at Earth’s Surface
At the top of Earth’s atmosphere, the beam of nearly parallel incident sunrays is referred to as extraterrestrial radiation. The integration of the extraterrestrial spectrum
1. Introduction
4
over all wavelengths defines the solar constant. The solar constant represents the averaged flux density of incoming solar radiation on a unitary surface perpendicular to the rays at the mean Sun–Earth distance (Paulescu et al., 2013). The actual power density of the solar constant varies slightly since the Earth-Sun distance changes as the Earth moves in its elliptical orbit around the sun, and because the sun's emitted power is not constant. However since this variations are typically small this value is considered as constant. The currently accepted value for solar constant is 1366 W/m2 (Kleissl, 2013; Badescu, 2008; Paulescu et al., 2013) but some oscillation on this number may be found on literature of around ± 7W/m2 (Kleissl, 2013). When the solar radiation flux passes through the Earth’s atmosphere, its spectral distribution is modified by absorption and scattering processes. Thus the radiation at the Earth's surface varies widely. Also, local variations in the atmosphere, such as water vapour, clouds, pollution, geographic location of the region in interest, season of the year and the time of day are factors that contribute to its variation.
Solar energy resource assessments typically require the knowledge of the two components of solar radiation at the Earth’s surface: diffuse radiation (D), the scattered radiation, resulted from the interactions of the extraterrestrial radiation with the Earth’s atmosphere, and the direct or beam radiation (I) arriving on the ground directly in line from the solar disk. The sum of the direct and diffuse components is called global (or total) radiation (G). When combined, these quantities are often referred to the horizontal plane and are related according to the following:
𝐺ℎ𝑜𝑟𝑖𝑧𝑜𝑛𝑡𝑎𝑙 = 𝐼𝑛𝑜𝑟𝑚𝑎𝑙× cos(𝜃𝑧) + 𝐷ℎ𝑜𝑟𝑖𝑧𝑜𝑛𝑡𝑎𝑙 (1) where 𝜃𝑧refers to the solar zenith angle which is used to convert the direct normal radiation
to direct horizontal. The term ‘‘global’’ is associated to the fact that the solar radiation is received from the entire 2π solid angles of the sky. When solar radiation on a tilted (non-horizontal) surface is being analysed, an additional term describing the reflected radiation from the ground has to be considered. This additional term is the diffuse hemispherical radiation affected by a conversion coefficient taking into account the sky view factor. In the scope of the present thesis the focus lies on horizontal quantities only and, henceforth, when referring to global or diffuse radiation it is implied that it concerns to the horizontal plane.
The most common instrumentation used for solar radiometric measures consist of pyrheliometers and pyranometers. The former records direct beam radiation and have an angle field of view restricted to admit only beam radiation with some inadvertent circumsolar contribution from the Sun’s aureole. Pyranometer measure the total hemispherical (global) horizontal radiation. They may be coupled with a shading device (to obstruct the sun disk and therefore the beam irradiation) in order to measure diffuse horizontal radiation. This though requires tracking the Sun with the blocking device throughout the day. A lower cost alternative is often used which consist of a fixed band or ring of opaque material placed to shadow the pyranometer throughout the day. Either way, the deployment and maintenance cost of these types of instruments are high and often,
1. Intoduction
5
solar radiation measurements include only records of global horizontal radiation. Nonetheless, direct and diffuse radiation characteristics are also important, in particular when concentrating solar energy systems are considered.
Since direct and diffuse radiation data are relatively uncommon, models for estimating these solar components from the more prevalent global radiation data are available. This topic is further developed in Section 1.4.
1.3
Solar radiation data simulated by atmospheric models
Historical solar radiation data have already been examined in several studies with focus on the investigation of trends (Gilgen et al., 1998) and possible causes for the global dimming/brightening of the solar radiation at the Earth’s surface (Liang and Xia, 2005; Che et al.,2005; Liepert, 2002; Power, 2003; Ohmura, 2009; Stanhill, 1998; Stanhill and Ianetz, 1997; Romanou et al., 2007; Wild et al., 2005, Sanchez-Lorenzo et al., 2009 , Chiacchio et al., 2015). Solar radiation data obtained from atmospheric models have been used as a solar resource assessment tool (reviewed in Chapter 4) and to analyse future projections (reviewed in Chapter 5). A considerable number of studies have also employed numerical atmospheric models in the context of short-term forecasting (Lorenz et al.,2009 ; Rincón et al., 2010 ; Lara-Fanego et al., 2012 ; Perez et al., 2013 ; Ohtake et al., 2013 ; Pelland et al., 2013 ; Kosmopoulos et al., 2015). These studies have been emerging in recent years because since renewable solar energy is inherently variable, its integration on the grid presents a major challenge to grid operators and utilities (Kleissl, 2013).
In atmospheric models, global radiation is required for predictions of the model’s energy budget and therefore direct normal radiation and diffuse components are not common outputs. Also, since often these models do not account for the atmospheric aerosols in the radiative transfer equation, global radiation is a more accurate radiometric value to be available to the user as is a much less sensitive variable to the aerosol optical properties than direct and diffuse radiations (Jimenez et al., 2015). Presently some efforts have already being made to overcome this issue. Jimenez et al. (2015) developed a model built on the WRF (Weather Research and Forecasting) modelling framework – WRF-Solar – with the aim to fulfil the needs of the solar energy industry focusing the forecast of solar radiation quantities including global, diffuse and direct radiation. This WRF extension has been validated for clear-sky conditions. Solar radiation simulations for partly cloudy and cloudy conditions are yet to be explored. The WRF-Solar adds the surface irradiance components to the model output when the existing shortwave parameterization in WRF calculates the direct and diffuse radiative transfer equations. When the shortwave scheme do not explicitly solves the direct and diffuse components but provides global radiation at the surface, the WRF-Solar estimates the direct and diffuse radiation using a regression model which takes into account not only the simulated global radiation but also the optical air mass and the clearness index (Jimenez et al., 2015).
1. Introduction
6
Despite these recent advances made by WRF-Solar, most atmospheric models only provide global horizontal radiation. Also, one should underline that even in this specific model in situations where the shortwave parameterization does not calculate the direct and diffuse radiative transfer equations, there is the need to resort to models for partition of global radiation into its diffuse and direct components.
1.4
Models of diffuse solar fraction
As pointed out in Sections 1.2 and 1.3, the diffuse component of global solar radiation is not generally measured in meteorological stations and it is not provided in the majority of atmospheric models. Consequently, it is very useful to have a method to estimate the diffuse radiation on a horizontal surface based on the available data of global solar radiation (measured or simulated) on a surface. These models are often referred as to separation models (Gueymard and Ruiz-Arias, 2016). They aim to estimate the diffuse fraction (portion of diffuse component from global radiation) and then use the fundamental equation (Eq. 1) between global radiation and its components to also obtain the value of the direct radiation.
The range of diffuse solar radiation models differ mainly on the parameters used as input. The simplest, and most commons, are models which only use global radiation information (e.g. Liu & Jordan, 1960; Erbs et al., 1982). More sophisticated models may require meteorological parameters such as information from clouds, atmospheric turbidity, temperature or precipitable water content (e.g. Kasten, 1983; Hollands and Crha, 1987). Overall, most models rely on correlations with the clearness index (ratio of horizontal extraterrestrial radiation and horizontal global radiation measured at the Earth’s surface) to estimate the diffuse fraction. These are expressed in terms of 1st to 4th degree polynomials, logistic or exponential models (Miguel et al., 2001; Jacovides et al., 2006). Models available in literature and some of their formulations are further reviewed in Chapter 7.
One important drawback of such models is that they are empirically derived from site-specific measurements and so, a model developed and validated in a site-specific climate type region may not hold its suitability for other regions.
Recently Gueymard and Ruiz-Arias (2016) undertook an unprecedented level of effort to gather and analyse the available separation models existing in literature until present date. The authors assessed the performance of 140 models using data from 54 stations which they clustered into four different climate zones of the world (tropical; temperate; arid and high-albedo). The object of their work was the validation and climate sensitivity analysis of direct normal radiation estimations obtained via the separation models. One major finding of the authors was that most separation models that were developed using hourly radiation data are not properly designed to operate correctly under high clearness index conditions: the errors of the models are exacerbated by cloud enhancement and high-albedo induced effects. Cloud enhancement is associated to situations when the clearness
1. Intoduction
7
index reaches high values, sometimes even over-unity values (Gueymard and Ruiz-Arias, 2016). This behaviour of the clearness index is attributed to cases in which global irradiance exceeds its theoretical clear sky value. It can occur due to reflection from the sides of clouds or in cases where a thin high-level cloud deck scatters at high intensity while permitting some beam radiation to still penetrate it (Engerer, 2015).
1.5
Aims and outline
The main objective of the current thesis is to assess the solar radiation resource provided by the combination of dynamical and statistical downscaling methods for present and future climate. With this it will be provided a quality solar resource map for the Iberian Peninsula and the Azores archipelago. Along the thesis, the statistical downscaling approach will only be represented by bias correction methods applied to the dynamical downscaled simulations.
As already mentioned, the work focuses primarily in the Iberian Peninsula as its large climate gradients are representative of diverse meteorological conditions, enabling therefore the adaptation of the presented methods to other regions. Besides, the Iberian Peninsula has been identified as one of the most responsive regions to global climate change (Giorgi, 2006). Afterwards, the same methodology is used to assess the solar resource of the Azores archipelago. The Azores region has been often neglected in solar resource assessments and solar resource maps of the world or even for the European region.
In this thesis the atmospheric model used for simulation of high-resolution global solar radiation data is WRF. The WRF is a state-of-the-art, mesoscale numerical weather prediction system designed to function for both operational forecasting and atmospheric research. It gathers many different choices for physical parametrizations including microphysics, cumulus parameterization, planetary boundary layer, land surface models, longwave and shortwave radiation (Skamarock et al., 2008). The WRF extension WRF-Solar is not considered in the present thesis because, as already mentioned in Section 1.3 it has been validated for only clear-sky conditions and its performance for partly cloudy and cloudy conditions is yet to be explored.
Given that the combination of bias correction with the simulated solar radiation data provided by WRF will overcome the limitations found in observations regarding the temporal and spatial consistency of data availability, one additional topic should be addressed: the fact that its output consists of global radiation only. Thus, it requires the implementation of separation of global radiation into its diffuse and direct components, which in this work is performed by developing a model of diffuse solar radiation fraction. This latter issue is only discussed for the Azores archipelago since diffuse solar radiation fraction models for the Iberian Peninsula have already been thoroughly considered in the literature (Reindl et al., 1990; Miguel et al., 2001; Boland et al., 2008; Ridley et al., 2010;
1. Introduction
8
Ruiz-Arias et al., 2010). The Azores region, on the other hand, has not been object of this type of analysis before. Furthermore, mid latitude islands are not abundant and the typical Atlantic climate of Azores Islands is not very common in other regions.
The aims of the thesis are addressed and presented following the structure below:
•
The solar radiation simulated by the WRF model for Iberian Peninsula presentclimate is evaluated through comparison with measured values of global radiation gathered across the region. The WRF output is then combined with bias correction methods and a solar resource map is presented (Chapter 4).
The future projections of solar radiation for the end of the 21st century in Iberia Peninsula are analysed. The simulated WRF values are also subjected to bias correction and a solar resource map is obtained, but in this case for future climate (Chapter 5).
Following the methodologies used in the analysis of the WRF solar radiation values for Iberian Peninsula, the same process is used to assess the solar resource of the Azores archipelago. The simulated values for present climate and future projections for the mid and end of the 21st century are addressed (Chapter 6).
Focusing on the Azores archipelago, the separation of global radiation into its diffuse and direct components is analysed using models of diffuse solar fraction. Several models available in literature are tested using high-quality measured data of global and diffuse radiation. The model with best performance is then adapted to further minimize the errors on the simulation of the diffuse fraction (Chapter 7). For the better organization of the thesis, the data sets used in the thesis are detailed in Chapter 2 and a description of the methodology fundamentals are presented in Chapter 3. Finally, the main conclusions and future work are collected in Chapter 8.
Henceforth, throughout the thesis, “solar radiation” and “solar resource” should be interpreted as referring to global solar radiation. The term “radiation” and “irradiance” are used as referring to the same quantity which is the power per unit area (W/m2) received from the Sun in a given horizontal surface.
1.6
Publications
This thesis is sustained by three original publications on international peer-review journals which are, at the time the thesis was printed, published or under review:
1. Intoduction
9
Magarreiro C., Widmann M., Soares P.M.M., Cardoso R. and Brito M.C. (2016) Solar energy resource from bias-corrected regional climate simulations: an Iberian irradiance assessment. Submitted to Energy. (Chapter 4)
Magarreiro C., Cardoso R., Widmann M., Brito M.C. and Soares P.M.M (2016) Combining high resolution dynamical downscaling and quantile mapping for future projections of the Iberian Solar Resource. Under review in International Journal of
Climatology. (Chapter 5)
Magarreiro C., Brito M.C. and Soares P.M.M. (2014) Assessment of diffuse radiation models for cloudy atmospheric conditions in the Azores region, Solar Energy, 108, 538-547. (Chapter 7)
A collaboration made during the development of the PhD led to an additional co-authored publication which is not included in the thesis and which is also under review at the time the thesis was printed:
Perdigão J., Salgado R., Magarreiro C., Soares P.M.M., Costa M.J. and Dasari H. (2016) An Iberian Climatology of solar radiation obtained from WRF regional climate simulations for 1950-2010 period. Under review in Solar Energy.
Finally, the main results from Chapter 7 are also part of a Conference Proceedings:
Magarreiro C., Brito M., Soares P.M.M., Azevedo E., (2014) Assessment of diffuse radiation models in Azores, Geophysical Research Abstracts, 16, EGU2014-5748, EGU General Assembly 2014, Vienna, Austria, 27 April – 02 May 2014.
Note: Parts of the text included in Chapters 1, 2 and 3 are taken from the three publications in which this thesis is sustained and that are listed above. For coherence and to avoid replication of information, the correspondent sections of the chapters 4, 5 and 7 which relate to the chapters mentioned above were updated to a shorter version. For a complete version of the published papers, the reader may want to consult the papers themselves.
1. Introduction
11
Chapter 2
Description of the data sets used
2.1
Ground based observations and study regions
As in any evaluation experiment, high quality observational data sets are essential to avoid misleading conclusions.
Iberian Peninsula
The geomorphological complexity and the climate gradients influenced by the Atlantic Ocean and Mediterranean Sea characterize the large weather variability of Iberian Peninsula. The highlands of the northwest are among the wettest regions in Europe and a significant North-South precipitation gradient is present in Iberia (Cardoso et al., 2013). Also, like in other Mediterranean regions, Iberia climate is characterized by large interannual variability (Soares et al., 2012b). The Köppen climate classification (Peel et al., 2007), divides the Iberian climate into temperate climate without dry season and mild/warm summers in the north and the Iberian cordillera; temperate climate with hot and dry summers in the center, south and southwest region; steppe climate in the Ebro valley and southeastern region and continental climate without dry season and mild summers in the Pyrenees.
For the assessment of the Iberian Peninsula solar resource in Chapters 4 and 5, local observations of global solar radiation gathered at 64 meteorological stations over Iberia were used. For Portugal, data was provided by IPMA (Portuguese Weather Service, 16 stations) while for Spain, by AEMET (Spanish Weather Service, 48 stations). The pyranometers used to obtain data in the Portuguese stations were Kipp and Zonen models CM11 (Kipp & Zonen, 2000) and CMP11 (Kipp & Zonen, 2015) and in the Spanish stations Kipp and Zonen models CM11 and CM21 (Kipp & Zonen, 2000). The time period of the
2. Description of the data sets used
12
observations varies amongst stations. Data from Portuguese stations cover the period from January 2000 – December 2011 and data from Spanish stations cover the period January 2000 – December 2010. The datasets used are daily mean values of global solar radiation (W/m2). From AEMET, the data featured daily mean records of solar radiation values while from IPMA, data was provided on hourly records. In this case daily means were determined only for days where no missing hourly value was existent between the sunrise and sunset hour. The data sets present different amounts of missing values among the stations but, given the nature of the meteorological variable here analysed (highly influenced by clouds presence/absence), no interpolation technique was considered to fill the missing data as that could lead to misleading conclusions. It is a fact that measures of global solar radiation at a specific site continuously and accurately over the long term (measured by pyranometers) are far from being abundant and so all available measures were included in this study (even in the locations where data was available for only 2 years). The locations of the local measurements stations with respective number of valid daily values (from 686 to 4366) are shown in Figure 2.1 in Section 2.3.
Azores
The Azores archipelago is constituted by 9 islands which are clustered in 3 groups: the western group with the islands Flores and Corvo; the central group with the islands Graciosa, Terceira, São Jorge, Faial and Pico and the eastern group with the islands São Miguel and Santa Maria. The Azores has a mild climate highly conditioned by the Atlantic Ocean in terms of temperature and it is frequently under the influence of low pressure systems linked to weather fronts with high humidity content which cross the ocean. The climate is classified as humid subtropical, rainy between September and March due to the presence of low pressure systems from the polar front and less rainy on the remaining months as a result of the Azores High. The Azores climate is also shaped by the topography of each island and the mutual influence among the closest islands as is the case of Pico, São Jorge and Faial (Tomé, 2013).
The global solar radiation measurements datasets available and used in the assessment of the Azores solar resource for present and future climate presented in Chapter 6 are multi-year daily mean data for the islands Faial; Terceira; Graciosa; Pico; Flores; Corvo; Sta Maria and two locations in São Miguel, Ponta Delgada and Nordeste (Fig. 2.2b). The multi-year daily mean data is available at the Green Islands Project website (Green Islands Azores Project, 2015) and was constructed from measurements made by the Azores delegation of the Portuguese Weather Service (IPMA) with pyranometers Kipp & Zonen CM11(Kipp & Zonen, 2000) during the period 1999-2009. An average daily value was determined for each day of the year according to the available measurements at the correspondent site. The measurements used cover different parts of 1999-2009 time period among the locations analysed.
2. Description of the data sets used
13
In Chapter 7, the applicability of a set of models for prediction of hourly diffuse fraction from global radiation is tested for the Azores region. In this specific study the analysis was performed with global and diffuse solar radiation data from Graciosa Island available from the Atmospheric Radiation Measurements (ARM) Climate Research Facility, and collected in the field campaign - Clouds, Aerosol and Precipitation in the Marine Boundary Layer (CAP-MBL). The ARM Mobile Facility was deployed from May 2009 to December 2010 and included, among others, measurements of broadband shortwave downwelling irradiances (global, diffuse and direct). The ARM instrument SKYRAD used consisted of: Black&White Pyranometer, Model 8-48; Normal Incidence Pyrheliometer, Model NIP; Precision Spectral Pyranometer, Model PSP, all manufactured by Eppley Laboratories, Inc. The tracker is the Kipp and Zonen Model 2AP.
The data available in ARM includes a quality assessment for radiation measurements which uses climatological analysis of the surface radiation to define reasonable limits for testing the data for unusual data values (Long and Shi, 2006). The correction is applied not only to diffuse but also to global radiation measurements. The irradiance variables are available with a time step of 60 seconds, but were aggregated to hourly mean values. The location of the ARM station matches the location of the Graciosa Island multi-year daily mean data described above.
2.2
Cloud fractional cover
Satellite observations of cloud fractional coverage is used to assess the skill of the WRF – ERA-Interim simulation in the process of representing cloudy condition, in particular in the Iberian region (Chapter 4).
Iberian Peninsula
Cloud fractional coverage (percentage of cloud presence in the sky) is obtained from the CM SAF cloud property data set using SEVIRI (CLAAS) derived from the EUMETSAT Satellite Application Facility on Climate Monitoring (Stengel et al., 2014). This pixel-based CLAAS dataset has approximately 4km spatial (0.05° x 0.05° latitude-longitude grid) resolution for daily averages spanning from 2004 to 2011. The cloud detection obtained in this product is presented as cloud fractional coverage defined as the fraction of cloudy pixels per grid square compared to the total number of analysed pixels in the grid square. The detailed definition of the cloud fractional coverage product is presented by Kniffka et al. (2013) and Stengel et al. (2014). Since the simulated cloud fraction is provided for every model level and the satellite data is simply a 2D representation of a 3D field, the approach proposed by Sundqvist et al. (1989) and Morcrette et al. (2000) is followed to derive the