R E S E A R C H A R T I C L E
Open Access
PNPase is involved in the coordination of
mRNA degradation and expression in
stationary phase cells of
Escherichia coli
Clémentine Dressaire
1, Vânia Pobre
1, Sandrine Laguerre
2, Laurence Girbal
2*, Cecilia Maria Arraiano
1*and
Muriel Cocaign-Bousquet
2Abstract
Background: Exoribonucleases are crucial for RNA degradation in Escherichia coli but the roles of RNase R and PNPase and their potential overlap in stationary phase are not well characterized. Here, we used a genome-wide approach to determine how RNase R and PNPase affect the mRNA half-lives in the stationary phase. The genome-wide mRNA half-lives were determined by a dynamic analysis of transcriptomes after transcription arrest. We have combined the analysis of mRNA half-lives with the steady-state concentrations (transcriptome) to provide an integrated overview of the in vivo activity of these exoribonucleases at the genome-scale. Results: The values of mRNA half-lives demonstrated that the mRNAs are very stable in the stationary phase and that the deletion of RNase R or PNPase caused only a limited mRNA stabilization. Intriguingly the absence of PNPase provoked also the destabilization of many mRNAs. These changes in mRNA half-lives in the PNPase deletion strain were associated with a massive reorganization of mRNA levels and also variation in several ncRNA concentrations. Finally, the in vivo activity of the degradation machinery was found frequently saturated by mRNAs in the PNPase mutant unlike in the RNase R mutant, suggesting that the degradation activity is limited by the deletion of PNPase but not by the deletion of RNase R.
Conclusions: This work had identified PNPase as a central player associated with mRNA degradation in stationary phase.
Keywords: RNA decay, PNPase, RNase R, E. coli, Transcriptome, Gene expression regulation
Background
Intracellular RNA levels are a result of both transcription and degradation rates. Although transcription is import-ant, RNA degradation is also a key factor in the regulation of gene expression [1–3]. Ribonucleases can either de-grade the RNA internally (endoribonucleases) or dede-grade the RNA from one of the extremities (exoribonucleases). In Escherichia coli RNA degradation involves mainly two endoribonucleases (RNase III and RNase E) and three 3′-exoribonucleases (PNPase, RNase II and RNase R) [1]. In this bacterium, no 5′-exonuclease activity has been detected unlike in Bacillus subtilis [4, 5]. These RNases
can either act alone or they can form RNA degradation complexes with other proteins [1,3]. In prokaryotes there are two main RNA degradation pathways. One starts with an endoribonucleolytic cut followed by the exoribonucleo-lytic degradation of the smaller fragments and the other only requires exoribonucleases for the degradation of the full-length RNA [1,3,6]. Therefore, exoribonucleases are crucial for RNA degradation.
PNPase is a phosphorolytic exoribonuclease but under some conditions such as low inorganic phosphate or in the absence of poly(A) polymerase, PNPase can add polynucleotide tails to RNAs [7–9]. PNPase activity is blocked by double stranded RNA structures [10], but it can form complexes with other proteins allowing it to degrade through extensive structured RNA [1]. RNase II and RNase R are both hydrolytic exoribonucleases and * Correspondence:girbal@insa-toulouse.fr;cecilia@itqb.unl.pt
2LISBP, Université de Toulouse, CNRS, INRA, INSA, Toulouse, France 1Instituto de Tecnologia Química e Biológica António Xavier, Universidade
Nova de Lisboa, Av. da República, 2780-157 Oeiras, Portugal
© The Author(s). 2018 Open Access This article is distributed under the terms of the Creative Commons Attribution 4.0 International License (http://creativecommons.org/licenses/by/4.0/), which permits unrestricted use, distribution, and reproduction in any medium, provided you give appropriate credit to the original author(s) and the source, provide a link to the Creative Commons license, and indicate if changes were made. The Creative Commons Public Domain Dedication waiver (http://creativecommons.org/publicdomain/zero/1.0/) applies to the data made available in this article, unless otherwise stated.
belong to the RNase II family of enzymes [11]. RNase II degrades only single stranded RNA while RNase R is able to degrade structured RNA as long as there is a 3’end overhang. RNase R is a stress-induced protein
[12–14] and it is the only exoribonuclease able to
degrade highly structured RNA without the help of other
factors [14]. RNase II, RNase R and PNPase seem to
have some overlapping roles in the cell. The deletion of any of the exoribonucleases does not affect cell viability and a double mutant RNase R/RNase II is also viable. However, the double mutants PNPase/RNase R and PNPase/RNase II are not viable [15,16].
All these exoribonucleases have been extensively studied, mostly in exponential phase of growth in laboratory conditions. However, both RNase R and PNPase are active in other conditions. As an example, PNPase and RNase R are involved in the virulence process in several organisms [17–21]. More particularly, PNPase and RNase R are active in E. coli in stationary phase. Under such conditions, PNPase participates in the degradation of small RNAs [22–24]. The levels of RNase R increase in stationary phase [12]. In exponential phase most of the RNase R is associated with ribosomes [25, 26] and therefore there is less amounts of enzyme available for RNA degradation. On the other hand in stationary phase RNase R is no longer associated with the ribosomes and the protein level is also increased due to protein stabilization [27]; therefore in stationary phase there is more RNase R available for RNA degradation.
In bacteria the role of exoribonucleases in RNA degradation has been mostly studied at the mechanistic level, with only a few genome-wide analyses of the exori-bonuclease activity [28–33]. To date, in E. coli, only four genomics studies of exoribonuclease activity were reported and they were all done in exponential phase [28, 29, 32, 33]. These large-scale studies generally consider transcriptomic analysis which represents the steady-state levels of the mRNAs in the different RNase mutants. Transcriptomic data do not necessarily repre-sent only the direct result of the processing and degrad-ation activities of RNases since there are many possible indirect effects (e. g. changes in transcription). Although RNase activity is expected to directly modify RNA decay, genome wide-quantification of RNA stability is only rarely undertaken.
In this work we studied the role and the overlap of RNase R and PNPase exoribonucleases in stationary phase. We compared in this phase the mRNA half-lives for E. coli MG1655 and the mutants deleted for PNPase or RNase R. We then combined the analysis of mRNA stabilities with the steady-state concentrations (transcriptome) to provide an inte-grated overview of the in vivo activity of these exoribonucleases at the genome-scale.
Results
mRNAs are very stable in stationary phase
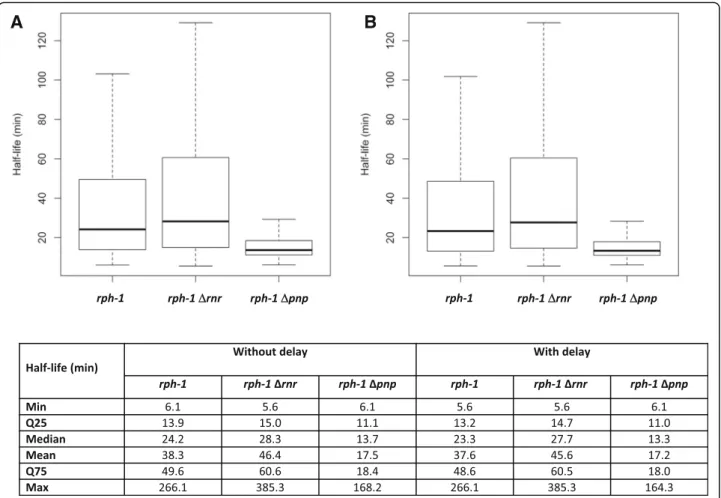
The deletion strains of RNase R or PNPase (the rph-1 Δrnr and rph-1 Δpnp double mutant strains, respectively) were constructed in the E. coli K-12 MG1655 background referred as the rph-1 control strain. The E. coli rph-1 control strain and the rph-1Δrnr double mutant displayed similar growth profiles in LB medium while the rph-1 Δpnp double mutant led to slower growth. Since this work aimed at comparing the role of PNPase and RNase R exor-ibonucleases during the stationary phase of growth, sam-plings for genome scale mRNA stabilities were performed at late stationary phase in standardized conditions, i.e. 3 h after the growth stopped (Additional file 1: Figure S1). Using our calculation and quality control method (see ma-terial and methods for details), 2856 half-lives were avail-able for all the three strains. This dataset was retained for further analysis (Fig.1a). Half-lives have been determined with classical linear model fitted on log concentration of mRNA (see example of a set of 50 randomly selected
mRNAs in Additional file 2: Figure S2). The half-lives
obtained (Fig.1, median value > 13 min) were higher than previously published in the rph-1 control strain and the
rph-1 Δpnp double mutant [2, 29, 34], however our
growth conditions were different (prolonged stationary phase versus exponential phase), and this could justify in part the discrepancy in the results. We also hypothesized that a delay in the transcription arrest during the mRNA half-life measurement could lead to an increase in the determination of the general values of half-lives. Such a delay, probably due to RNA polymerase elongation activ-ity in presence of rifampicin, was first demonstrated by
Chen and coworkers [34] and modelled more recently
[35]. We have subsequently re-estimated the half-lives taking into account the delay using a model composed of a stable baseline level during the delay followed by an
exponential decay (as described by [35]). The boxplot
obtained with the delay (Fig. 1b) is similar to the one obtained without delay, meaning that the half-life values are very similar with and without delay (see correlation coefficient close to 1 in Additional file3: Figure S3).
The values of half-life were confirmed by Northern-blot experiments with 3 different mRNAs (osmB, ompA and nlpl) measured in the 3 strains. Although the absolute values differed, the two sets of mRNA half-lives were in the same range of magnitude
(Additional file 4: Figure S4). A perfect match was
even found for the half-life of osmB in the 3 strains. The high mRNA half-lives obtained for the control strain and for the two exoribonuclease mutant strains were not related neither to the measurement method nor to the fitting estimation. These values were thus rather linked to the E. coli physiology in prolonged stationary phase. Here we demonstrated that mRNAs
are very stable in non-growing cells. Stabilization of mRNAs at zero growth is in agreement with the recent demonstrations of mRNA stabilization at low growth rates [2, 34, 36]. Overall our results show an important stabilization of mRNAs associated to E. coli adaption to unfavorable growth conditions.
Only a few mRNAs are stabilized in therph-1 Δrnr and rph-1 Δpnp double mutants
It was expected that mRNAs would be stabilized at the genome-wide level in the absence of the ribonu-cleases RNase R or PNPase. The half-lives in the
rph-1 Δrnr and rph-1 Δpnp double mutants were
compared to the rph-1 control strain at the global level (comparison of statistical distribution of data) and for individual mRNAs applying the statistical test defined in the material and methods section. In
the rph-1 Δrnr double mutant, the median of the
mRNA half-lives was 28.3 min while for the rph-1 control strain the median of the half-lives was 24.2
min (Fig. 1). Between rph-1 Δrnr and the rph-1
control there was no mRNA with a significant vari-ation of stability suggesting only a small systematic
increase in global mRNA stability in the rph-1 Δrnr
double mutant. In the rph-1 Δpnp double mutant
there is a global destabilization (see the lower mean and median half-lives compared to the rph-1 control
in Fig. 1) but 214 mRNAs were found to be
signifi-cantly stabilized. These stabilized mRNAs belonged to several functional categories. Functional enrich-ment analyses processed with AMIGO or KEGG Mapper revealed a significant enrichment of mRNAs involved in the central carbon metabolism. The
functional categories “glycolysis” and “TCA cycle”
were indeed enriched. More specifically, important genes of these processes were stabilized in the rph-1 Δpnp double mutant (pgi, pfkA, pgk, pck, acp, gltA,
sdaA, sucA, sucC, ldhA, agp, talB and yccx).
Interestingly, Bernstein et al. similarly reported the stabilization of pgi, pfkA, pgk, pckA, gltA and talB in
a rph-1 Δpnp double mutant strain compared to a
rph-1 strain in exponential phase [29] (data for the
A
B
Fig. 1 Statistics associated with the calculated half-lives of 2856 genes in the rph-1 control strain and the two RNase mutants. Two different models were tested: the model without delay corresponding to classical linear model fitted on log concentration of mRNA a and the model with delay previously described [35] corresponding to a piecewise model composed of a stable baseline level during the delay followed by an exponential decay b. Results for each strain are represented as boxplots and the related statistics are described below in numbers
other genes mentioned here were not available). Recent papers also pointed out the link between PNPase and the regulation of the expression of genes related to the central carbon metabolism [33,37].
We did not observe any massive stabilization in the
rph-1 Δrnr and rph-1 Δpnp double mutants, neither
taking in consideration the results of mRNA stability all together nor at the individual scale.
mRNAs are extensively destabilized in therph-1 Δpnp double mutant
Many mRNAs displayed decreased half-lives in the
rph-1 Δpnp double mutant compared to the rph-1
control strain. In comparison only five mRNAs, namely osmB, cstA, uspB, ycgB and ychH, were
desta-bilized in the rph-1 Δrnr double mutant. Deletion of
pnp thus led to an overall loss of stability, suggesting that the PNPase could be involved in a protective mechanism of mRNAs.
Modifications of mRNA stabilities in the pnp mutant may be related to an indirect effect notably via sRNAs. PNPase was shown to have a significant role in the degradation and also in the protection of
sRNAs [23, 24, 28]. Considering that a single sRNA
can regulate the expression of several targets [24], it is possible that, in the absence of PNPase, the stabil-ity of sRNAs would be changed leading to the destabilization of their targets. We obtained the levels of ncRNAs in stationary phase by RNA-Seq and found important variations in ncRNA levels in
the rph-1 Δpnp double mutant in comparison to the
rph-1 control strain (Table 1). Indeed many ncRNA
expressions were up- or down-regulated in the rph-1 Δpnp double mutant. This is notably the case for the sRNA CsrB with a 7 fold higher level in the
rph-1 Δpnp double mutant. PNPase was previously
demonstrated to be involved in the degradation of
the sRNA CsrB in Salmonella [38] but not yet in E.
coli. By sequestrating CsrA [39], CsrB is expected to
control various CsrA-targeted mRNAs. The flhDC mRNA protected by CsrA from RNase E-mediated
cleavage [40] as well as 696 mRNAs previously
shown as destabilized by CsrA attenuation [41] were
indeed destabilized in the rph-1 Δpnp double
mutant. A large number of the mRNAs destabilized
in the rph-1 Δpnp double mutant (44%) could thus
be related to a CsrA-dependent destabilization.
Massive reorganization of genome-wide mRNA levels in therph-1 Δpnp double mutant
Modification of RNase activity in the different RNase mutants is expected to directly change mRNA stabilities, therefore altering mRNA concentrations. However, many indirect effects on mRNA concentrations are also likely
to occur, for instance when RNases targeted the stability of transcriptional regulators [32, 33]. We have notably found in this work that 70 transcriptional regulators (among the 162 identified according to RegulonDB)
exhibited a modified stability in the rph-1 Δpnp double
mutant (Additional file 5: Table S1). Therefore, in order to decipher the role of RNase R and PNPase, we have estimated the genome-scale mRNA concentrations by transcriptomic analysis and compared the data in the different strains. Raw data of steady-state transcriptome before addition of rifampicin were recomputed with a RMA-derived method (see material and methods for details). Dramatic changes were observed in the rph-1 Δpnp double mutant whereas only a minor
transcrip-tional reorganization occurred in the rph-1 Δrnr double
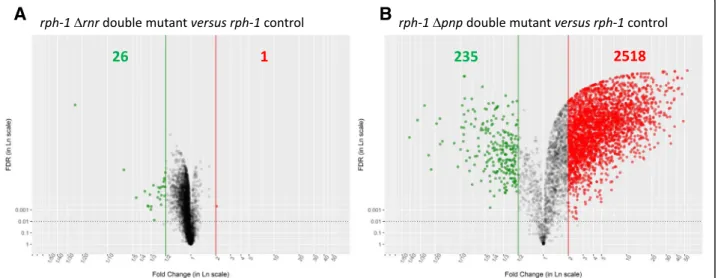
mutant (Fig.2). Indeed, applying the statistical criteria as defined in material and methods, only 27 genes were
differentially expressed between the rph-1 Δrnr double
mutant and the rph-1 control strain whereas 2753 displayed significantly different levels between the rph-1 Δpnp double mutant and the rph-1 control. Most of the
genes were up-regulated in the rph-1 Δpnp double
mutant compared to the rph-1 control strain (Fig. 2).
Our transcriptome results are in agreement with recently published RNA-Seq data showing that, in expo-nential phase, PNPase deletion led to more up-regulated transcript concentrations compared to RNase R deletion
[33]. Such changes in mRNA levels in the rph-1 Δpnp
double mutant were corroborated by the 4-fold increase of the total mRNA concentration and by the 2-fold increase of the total RNA (mRNA, rRNA and tRNA) content in this strain in comparison to the rph-1 control strain (Additional file6: Table S2).
Overall, the deletion of PNPase led to a massive reorganization of the gene expression most probably due to indirect transcriptional regulations. The global up-regulation of mRNA concentrations observed in the
rph-1 Δpnp double mutant is in the opposite direction
to the down-regulation of mRNA stabilities also found in this strain.
PNPase affects the relationship between mRNA stability and concentration
The role of exoribonuclease activities was thus complex, combining effects on both mRNA stability and mRNA concentration. This suggests a delicate balance between regulations of mRNA stability and concentration in cells.
Until now, we have compared the behavior of
genome-wide mRNA concentrations and half-lives
between two strains. We focus now on the relationship between mRNA concentrations and half-lives within the same strain. The overall relationship between mRNA stability and concentration characterizes the in vivo activity of the degradation machinery (at the level of
Table 1 List of the ncRNAs differentially expressed in the rph-1Δpnp double mutant vs the rph-1 control strain in stationary phase. ncRNAs were quantified with the RNAseq technology in the rph-1Δpnp double mutant and the rph-1 control strain. FC is the fold-change of expression in the rph-1Δpnp double mutant compared to the rph-1 control
ncRNA Description FC
rph-1Δpnp double mutant vs rph-1 control
agrA Inactive antisense sRNA 6.1
arcZ sRNA positive antisense regulator of rpoS; binds Hfq 0.5
arrS Antisense sRNA regulator of gadE and acid resistance; Gad E-regulated
0.4 csrB CsrA-binding sRNA. antagonizing CsrA regulation; blocks the
CsrA binding of hundreds of mRNAs
7.0
cyaR sRNA effector of ompX mRNA instability, cAMP-induced; hfq-dependent
2.3 dsrA Regulatory sRNA enhances translation of rpoS; component of
acid resistance
regulatory circuit; also antagonist of H-NS function by decreasing H-NS levels
0.5
gadY sRNA regulator of gadAB transcriptional activator GadX mRNA 3.2
gcvB GcvB sRNA gene divergent from gcvA; represses oppA, dppA, gltI and livJ
expression; regulated by gcvA and gcvR; this is gcvB-L, terminated at T2, 90%
of gcvB RNA is from gcvB-S, encoding a 134 nt RNA termina ting at T1
5.3
glmY sRNA activator of glmS mRNA, glmZ processing antagonist 0.5
glmZ sRNA antisense activator of glmS mRNA, Hfq-dependent 6.1
micA sRNA regulator of ompA, lamB, ompX and phoP,
Hfq-dependent
1.7 micF Regulatory antisense sRNA affecting ompF expression;
member of soxRS regulon
1.7 omrA sRNA downregulating OM proteins and curli; positively
regulated by OmpR/EnvZ; binds Hfq
0.3 omrB sRNA downregulating OM proteins and curli; positively
regulated by OmpR/EnvZ; binds Hfq
0.2
psrD Novel sRNA, function unknown 3.7
rdlA Antisense sRNA RdlA affects LdrA translation; proposed addiction module in LDR-A repeat, with toxic peptide LdrA
0.5 rnpB RNase P, M1 RNA enzyme component; involved in transfer
RNA and 4.5S RNA-processing
5.7
rprA Positive regulatory antisense sRNA for rpoS translation 0.6
rybB sRNA effector of ompC and ompW mRNA instability; requires Hfq
0.4
rydC sRNA regulator of csgD and yejABEF 2.3
ryeA Novel sRNA, function unknown 1.9
ryjB Novel sRNA, function unknown 2.1
sgrS sRNA that destabilzes ptsG mRNA; regulated by sgrR 9.8
sibA Antisense sRNA regulator of toxic IbsA protein; in SIBa repeat 26.0
sibB Antisense sRNA regulator of toxic IbsB protein; in SIBb repeat 3.2
sibC Antisense sRNA regulator of toxic IbsC protein; in SIBc repeat 11.3
sibD Antisense sRNA regulator of toxic IbsD protein; in SIBd repeat 13.0
sibE Antisense sRNA regulator of toxic IbsE protein; in SIBe repeat 1.9
sokB Antisense sRNA blocking mokB, and hence hokB, translation 0.5
enzyme-substrate interaction) [42]. In order to deter-mine the impact of PNPase or RNase mutations on the in vivo degradation activity, we have analyzed the stability -concentration relationship for all mRNAs of each strain using a genome-wide correlation analysis. We have com-bined on Fig. 3, the three plots of the degradation rate constant k (k = ln2/ half-life) versus the mRNA concentra-tion obtained for the rph-1 control strain and the rph-1 Δrnr and rph-1 Δpnp double mutants, respectively. This figure allowed the visualization of a global negative relation-ship between degradation rate constant and the mRNA concentration for each individual strain but the level of cor-relation differed with the mRNA concentration. Three correlation phases were differentiated using a K-means clustering algorithm on the combined three datasets (see the correlation coefficients and p-values in the
legend of Fig. 3). In phase I, for the lowest mRNA
concentrations, the correlation was very strong; in phase II for intermediary mRNA concentrations, the correlation was less strong and in phase III for the highest mRNA concentrations, the correlation was
not significant. Phases determined with combined data of the three strains were also relevant for individual strains (see correlation coefficient for individual strains in the three phases in Table 2). For each of the three strains, most of the genes showed a negative correlation between the degradation rate constant (k) and the mRNA concen-tration (85, 88 and 72% of genes were in phases I and II for the rph-1 control strain and the rph-1Δrnr and rph-1 Δpnp double mutants, respectively) (Table 2). This result shows that in a strain mRNA stability and concentration are generally tightly linked in vivo. However in the rph-1 Δpnp double mutant, a more than 2-fold higher number of genes with uncorrelated degradation rate constant and concentration was observed (1144 genes in the rph-1 Δpnp double mutant were in the phase III against about 400 genes in the two other strains) (Table2). Most of the genes in phase III in the rph-1Δpnp double mutant (779) belonged to phases I or II in the rph-1 control strain. This
was not the case in the rph-1Δrnr double mutant since
nearly all the genes found in phase III were also found in this phase in the rph-1 control.
A
B
Fig. 2 Volcano representation of the transcriptomic comparisons of the RNase mutant strains with the rph-1 control strain. Volcano plots representing the transcriptome results corresponding to the rph-1Δrnr double mutant (left side) and the rph-1 Δpnp double mutant (right side) compared to the rph-1 control strain. Genes associated to a FDR lower than 1% (represented by the scattered horizontal line) and a fold change lower than 0.5 or higher than 2 represented the down- (green spots) and up-regulated genes (red spots), respectively
Table 1 List of the ncRNAs differentially expressed in the rph-1Δpnp double mutant vs the rph-1 control strain in stationary phase. ncRNAs were quantified with the RNAseq technology in the rph-1Δpnp double mutant and the rph-1 control strain. FC is the fold-change of expression in the rph-1Δpnp double mutant compared to the rph-1 control (Continued)
ncRNA Description FC
rph-1Δpnp double mutant vs rph-1 control ssrA tmRNA, 10Sa RNA; acts as tRNA-Ala and mRNA template for
tagging proteins resulting from premature transcription termination for degradation, a process known as trans-translation
1.4
mRNA concentration was thus negatively correlated to stability for a large majority of mRNAs (phase I and
II) even in the rph-1 Δpnp double mutant which
displayed an unexpected swing in mRNA concentra-tions and stabilities when compared to the rph-1 con-trol strain. However, the number of mRNAs in phase III with unrelated stability and concentration values
increased significantly in the rph-1 Δpnp double
mutant. PNPase mutation thus affected significantly the relationship between mRNA concentration and stability unlike the RNase R mutation. This suggests that PNPase is a key enzyme of the RNA degradation machinery and the implication on the regulation of the in vivo kinetics of mRNA degradation will be presented more in details in the discussion section.
Discussion
RNase R and PNPase are two of the main exoribonu-cleases that have important roles in the degradation of RNAs in stationary phase. In this study we used the MG1655 background. In this genetic background, the rph-1 allele results in a truncated functionally inactive RNase PH, a 3′-5′ exoribonuclease primarily involved in
tRNA maturation and rRNA degradation [43]. In this
work we were able to determine the genome-wide mRNA stabilities for E. coli MG1655 (the rph-1 control strain) cells and for the rnr and pnp deletion mutants in stationary phase. This is the first report where the genome-wide mRNA half-lives were determined to compare how exoribonucleases affect the stability of all mRNAs in E. coli in stationary phase.
Fig. 3 Plot of the degradation rate constant as a function of the mRNA concentration for the rph-1 control strain, the rph-1Δrnr and rph-1 Δpnp double mutants. For the 2856 genes with available half-lives in the three strains, the degradation rate constant k was plotted against the average mRNA concentration (normalized value) at T0 (before rifampicin addition). The rph-1 control is represented in black, the rph-1Δrnr double mutant in red and the rph-1Δpnp double mutant in green. Appling a K-means clustering algorithm, three correlation phases were distinguished: phase I, zone of highly significant (p-value < 10− 100) and very strong negative correlation (correlation coefficient ~− 0.8) associated with low mRNA concentrations; phase II at intermediary mRNA concentrations with strong and significant negative correlation (correlation coefficient ~− 0.65 and p-value < 10− 15); phase III, lack of correlation at high mRNA concentrations (correlation coefficient ~ 0)
Our results showed that the deletion of RNase R did not affect much the overall stability of mRNAs, when compared to the rph-1 control strain. A wide response affecting most of the mRNA stabilities was however observed in the PNPase mutant. This difference in the two exoribonuclease mutant strains was further sup-ported by our transcriptomic results. They showed that in the RNase R mutant there were only a few differen-tially expressed transcripts when compared to the rph-1 control strain, while for the PNPase mutant more than two thousand transcripts were differentially expressed. PNPase and RNase R are both known to be mainly
expressed in stationary phase [12, 22, 23]. Single
mutants are viable but the double mutant RNase R/ PNPase is not viable [16]. From this result, one would expect that in the absence of PNPase, RNase R would compensate and vice versa. Our results argue in favour of the compensation of RNase R loss by PNPase exonuclease activity whereas the reverse does not seem to happen. Unlike RNase R, PNPase is a key enzyme of the E. coli degradosome, a multiprotein complex that is able to degrade RNAs very fast due to the cooperation of the different enzymes [44]. There is also the important role of PNPase in the metabolism of sRNAs [22, 28,45]. So far, RNase R does not appear to have any significant role in sRNA decay [46]. Therefore, PNPase has several roles in the cell that cannot be fully compensated by RNase R and it could provide one possible explanation as to why the deletion of this enzyme has a greater effect on mRNA concentration and half-life in stationary phase, than the deletion of RNase R.
It was expected that in the absence of these ribonucle-ases the mRNAs would be stabilized. The reality was far different. Indeed only in the PNPase mutant, about two hundred mRNAs were significantly stabilized (more particularly mRNAs from genes involved in the central carbon metabolism). The few mRNAs stabilized in the PNPase mutant attest the degradation activity of
PNPase. On the other hand, the general destabilization of bulk mRNAs in the PNPase mutant suggests that PNPase would have also a role in mRNA protection. A parallel could be drawn between this dual role in degradation and protection and the two known antagonistic PNPase’s func-tions of exoribonuclease and polymerase [7]. An indirect mechanism due to the impact of PNPase over several key RNAs in the cell can be involved in this apparent mRNA protection. The variations of the level of ncRNAs and not-ably CsrB in absence of PNPase support such an indirect regulation of mRNA stabilities. PNPase is negatively con-trolled by CsrA through its binding to the pnp mRNA, preventing its translation [47]. In reverse, the destabilisa-tion of CsrB by PNPase observed in this work suggests the positive control of CsrA by PNPase. Such opposite regula-tions create a feedback regulation loop that is likely to coordinate Csr system and PNPase in vivo to tightly con-trol mRNA stabilities. A second mechanism involving direct binding of PNPase on mRNAs can also be assumed to contribute to this apparent protection of mRNAs by PNPase. We have first observed that mRNAs previously demonstrated to physically interact with PNPase [28] are
mainly destabilised in the rph-1 Δpnp double mutant
(Table3). Secondly, RNase II protects mRNA in E. coli by removing poly(A) tails and diminishing mRNA
accessibil-ity of other exonucleases [48]. Without PNPase, the
corresponding mRNA might thus be more prone to deg-radation by other ribonucleases, including RNase R. This hypothesis is further supported by the presence of ompA, a well-studied RNase R target [12] in the list of genes supposedly protected by PNPase. Additional genes pro-tected by PNPase, namely fliA, thiL, purN and ihfA were identified as RNase R targets in Pseudomonas putida [30].
The transcriptomic data for PNPase mutant showed that most transcript concentrations were up-regulated compared to the rph-1 control strain. Our results show that these increases in concentration were probably not due to RNA stabilization since many RNAs were
Table 2 Phase by phase analysis of the correlation between the degradation rate constant k and the mRNA concentration for the rph-1 control strain and the rph-1Δrnr and rph-1 Δpnp double mutants. Number of genes, correlation coefficients and the associated p-value are given in the three zones defined in Fig.3for the rph-1 control strain and the rph-1Δrnr and rph-1 Δpnp double mutants
Data PHASE I PHASE II PHASE III
rph-1 control Number of genes 1889 834 476
Correlation coefficient −0.80 −0.60 0.27
p-value 4.14E-108 1.07E-16 9.87E-09
rph-1Δrnr double mutant Number of genes 1957 750 369
Correlation coefficient −0.80 −0.69 0.04
p-value 9.66E-107 1.88E-23 4.23E-01
rph-1Δpnp double mutant Number of genes 1150 1747 1144
Correlation coefficient −0.83 −0.70 0.28
destabilized in the PNPase mutant. To further decipher the roles of PNPase and RNase R, we have analysed the correlation between the genome-wide mRNA concentra-tions and half-lives within each of the three strains. At low and intermediate mRNA concentrations, a negative relationship between mRNA concentration and deg-radation rate constant existed which is consistent with other omics works performed in the MG1655 strain of
E. coli and wild-type strains of other micro-organisms
[2,36, 49, 50]. Recently it was shown that the stability of an mRNA can be influenced by its concentration and therefore substrate-enzyme interactions can
gov-ern this negative relationship [42]. The correlation
represents in fact the strong dependency of in vivo degradation activity on the mRNA concentration. When the mRNA concentration is low, the degrad-ation machinery is limited by the substrate availability. However, at high mRNA concentration the degrad-ation rate constant and the mRNA concentrdegrad-ation were not correlated anymore. The in vivo mRNA degrad-ation became nearly independent of the mRNA concentration revealing an unexpected phenomenon of enzymatic saturation at high mRNA concentration. It is thus possible to speculate that when the mRNA concentration is low, the in vivo degradation activity is limited by the substrate availability while when the mRNA concentration is high the in vivo degradation activity is more prone to be limited by the enzyme (RNase) activity/quantity. Therefore, in the rph-1 con-trol strain, the mRNA degradation appeared to be mainly limited in vivo by the mRNA concentration and more rarely by the in vivo degradation activity. A similar behavior was found for the RNase R mu-tant. In the contrary, in the PNPase mutant, mRNA degradation was more frequently limited by the in vivo degradation activity. Deletion of the PNPase activity was thus demonstrated to shape the RNA degradation towards a substrate saturation of the
degradation machinery. This could be a direct
consequence of the pnp deletion on the in vivo degradation activity or due to indirect changes in mRNA concentration provoked by the mutation.
PNPase was thus evidenced as a central player of the degradation machinery.
Conclusions
The combined analysis (between two strains or within the same strain) of the genome-wide mRNA concen-trations and half-lives has provided substantial know-ledge on the impact of PNPase activity on the mRNA metabolism. The understanding of the mRNA concen-tration and degradation relationship allows a wider comprehension of the in vivo activity of RNase point-ing out the crucial role of PNPase. In the future, such an approach connecting mRNA degradation, mRNA concentration and the exoribonuclease activity will allow the role and the complementarity of several other RNases to be elucidated.
Methods
Strains and growth conditions
The double E. coli mutant strains with rnr or pnp
deletion (rph-1 Δrnr and rph-1 Δpnp, respectively) in
the MG1655 background (F− λ−rph-1) were respectively
obtained by phage transduction from donor strains in
the MG1693 background (F− λ−rph-1) [12, 32, 51].
P1-mediated transductions were performed as previously
described [52]. 50μL of an overnight culture of the
donor strains were used to inoculate 5 mL of LB with
0.4% glucose and 10 mM CaCl2. After 30 min of growth
at 37 °C, phage P1 lysate (100μL) was added. After 2 h
incubation at 37 °C, cell lysis was performed by
chloro-form (100μl) addition. Cells were centrifuged at 13500
rpm for 10 min, the supernatant (transducing lysate)
transferred to a new tube with 30μl chloroform and
kept at 4 °C. An overnight culture of the recipient strain was centrifuged and the pellet resuspended in 2.5 ml LB
with 10 mM MgSO4and 5 mM CaCl2. Cells (100μl) were
incubated with 10 to 200μl of transducing lysate during 30 min at 30 °C. 300μl of sodium citrate 1 M were added and the cells were incubated another hour at 30 °C.
In-fected cells were centrifuged and resuspended in 100μL
of the supernatant. Transductants were selected by plating
Table 3 Distribution of PNPase mRNA targets identified by co-immunoprecipitation (corresponding to the 278 mRNAs listed in Table S3 of reference [28]) in the different classes of mRNAs categorized by their changes in half-life in the rph-1Δpnp double mutant vs the rph-1 control strain (p-value < 0.05)
Bandyra’s target (number) Bandyra’s target (%)
significantly DESTABILIZED in the rph-1Δpnp double mutant 178 65%
significantly STABILIZED in the rph-1Δpnp double mutant 8 3%
non significantly DESTABILIZED in the rph-1Δpnp double mutant 59 22%
non significantly STABILIZED in the rph-1Δpnp double mutant 29 11%
on LB agar plates containing kanamycin (50μg·ml− 1) for the rph-1 Δrnr strain and streptomycin (50 μg·ml− 1) for
the rph-1 Δpnp strain. The rph-1 control strain and the
rph-1Δrnr and rph-1 Δpnp double mutants were grown
in baffled flasks in LB medium at 37 °C and 180 rpm. Ini-tial pH was set to 7. All cultures were inoculated at a low OD of 0.1 to maintain cells in exponential phase of growth for many generations prior to entry into stationary phase to dilute out any RNAs and proteins provided by the inoculum. Inoculation was performed from overnight pre-cultures per-formed in similar conditions. Biomass was estimated from absorbance at 600 nm. Each culture was repeated three times to provide independent biological replicates.
RNA extraction protocol
Three hours after the stationary phase of growth was reached, samples were collected for transcriptomic analysis; this time point was also the reference time point (T0) for the half-life determination procedure. Subse-quently, rifampicin (500μg.mL− 1) was added to inhibit the initiation of transcription, and cells were harvested at three different time points after this addition. Cultures were performed in triplicate. Samples were taken at either at 0′, 2′, 8′ and 15′, or 0′, 5′, 10′ and 18′ or 0′, 3′, 12′ and 30′ min after rifampicin addition. Samples were im-mediately frozen in liquid nitrogen upon collection. After thawing and centrifugation steps, total RNA was extracted with TRIZOL® Reagent (Ambion) according to the
manu-facturer’s instructions. DNA contamination was
elimi-nated with Turbo DNase kit (Ambion). Total RNA concentration and integrity were measured using a Nano-drop® spectrophotometer and Agilent BioAnalyzer, re-spectively. Total RNA extraction profiles were checked to be similar for all the three tested strains.
Microarray procedures
A double-stranded cDNA synthesis kit (InvitroGen) was
used to produce cDNA from 2μg aliquots of total RNA.
Aliquots of 1μg of cDNA were labeled using the one
color DNA labeling kit and 2μg of labeled cDNA were
hybridized onto E. coli K-12 gene expression arrays (Nimblegen, Roche) for 17 h at 42 °C according to the manufacturers’ instructions. Arrays were washed and then scanned with a MS200 Microarray Scanner (Nimblegen, Roche). The images were analyzed with DEVA 1.2.1 software. Only raw data were used for further analyses. All array procedures were performed by the GeT-Biopuces platform (http://get.genotoul.fr).
Transcriptome and genome-wide mRNA half-life measurements
For transcriptomic analysis, raw probe intensities were processed and analyzed with the R computing environment
using the affy [53] and limma [54] packages of Bioconduc-tor. Raw data were submitted to a RMA-based background correction [55]. After background correction, intra-replicate quantile normalization was performed for each strain. A set of probes in the background for which the ranks were roughly invariant across all nine arrays was selected. The median value of the invariant probe set inten-sities in each condition was used as a scaling factor for normalization between the three strains. After normalization, the intensity of a transcript was
cal-culated by a RMA-summarization procedure [55]
within each condition. Intensity values were
multi-plied by the total RNA extraction yield (in μg total
RNA per mg of dry cell weight) to provide the mRNA concentration value in arbitrary units per mg of dry cell weight. RNA extraction yields were 15.6
± 3.0, 17.2 ± 2.3 and 35.9 ± 7.3μg RNA per mg of dry
cell weight for growth of the rph-1 control strain
and the rph-1 Δrnr and rph-1 Δpnp double mutants,
respectively. The multiplication step by the total RNA extraction yield allowed to take into account differences in total RNA content (rRNA, tRNA and mRNA) per cell weight between the strains. Differ-ences in mRNA concentration were evaluated with a modified t-test in conjunction with an empirical
Bayes method [54]. The p-values were adjusted for
multiple testing by the “BH” False Discovery Rate
(FDR) method [56]. A p-value threshold of 1% and a
fold change higher than 2 or lower than 0.5 were
used for significance of differences in mRNA
concentration.
For mRNA half-life determinations, twelve arrays (three reference T0 samples, and nine time points after addition of rifampicin) were used. Only the normalization between arrays according to the invariant probeset intensities was performed. In each array, transcript-specific intensity was computed as the median value of the 16 targeting probe in-tensities. The linear regression coefficient, k, of ln(mRNA) versus time (12 points) and its associated coefficient of variation (standard error of slope/estimation of slope) were calculated for each mRNA species. The determination of k was considered as reliable only if the associated coefficient of variation was below 30%. The linear regression coeffi-cient k corresponding to the degradation rate constant was inversely proportional to the mRNA half-life t1/2, k¼ tln 2
1=2.
The statistical significance of differences in half-life was evaluated using the probability value of interaction be-tween time and growth rate in a global model of linear re-gression. A statistical threshold of 10% was used for adjusted p-values by the“BH” FDR method [56].
For functional analyses, GO and KEGG enrichment analyses were performed on the differentially expressed genes as well as on the genes with differential stabilities. Enrichment signifi-cance was set with a cut-off of 5% for the associated p-value.
ncRNAs were quantified by RNA-Seq technology in the rph-1 Δpnp double mutant and the rph-1 control strain
RNA samples (20μg) were sent to Vertis
Biotechnolo-gie AG, Germany, for library preparation and sequen-cing of libraries using an Illumina HiSeq platform (single end, 50-bp read length). For the library preparation Vertis Biotechnologie AG depleted the ribosomal RNA molecules from the total RNA prepa-rations using the MICROBExpress Bacterial mRNA Enrichment Kit (Ambion). The rRNA depleted RNAs were then fragmented with RNase III and the 5’PPP structures were removed using RNA 5’ Polyphospha-tase (Epicentre). Afterwards, the RNA fragments were poly(A)-tailed using poly(A) polymerase and a RNA adapter was ligated to the 5′-phosphate of the RNA frag-ments. First-strand cDNA synthesis was performed using an oligo(dT)-adapter primer and M-MLV reverse tran-scriptase. The resulting cDNA was PCR-amplified to about 30 ng/μl using a high fidelity DNA polymerase and sequenced. The reads were mapped against E. coli genome (NC_000913 downloaded from NCBI genome database). The ncRNAs expression was quantified using Artemis [57] and the Log2 Fold change was calculated for each of the ncRNAs.
Confirmation of mRNA half-life data by northern blot
Three genes osmB, ompA and nlpl were selected for
additional calculation of their associated mRNA
half-life using Northern blot method. Northern blots
were performed using the total RNA samples
extracted for microarrays. Briefly, 10–30 μg of total RNA were fractionated under denaturing conditions in 1.2% agarose formaldehyde gel in MOPS buffer. RNAs were transferred onto Hybond-N+ membrane (GE Healthcare) and cross-linked by UV irradiation using a UVC 500 apparatus (Amersham Biosciences). Membranes were hybridized overnight with radiola-beled specific probes in PerfectHyb Plus Hybridization Buffer (Sigma Aldrich) at 68 °C. Specific probes
(primers are given in Additional file 4: Figure S4)
were obtained by in vitro transcription reactions with
PCR DNA templates carrying a T7 promoter
sequence through the use of 32P-UTP and T7 RNA polymerase (Promega). Radiolabeled probes were puri-fied on G25 Microspin columns (GE Healthcare).
Availability of supportive data
The data discussed in this publication have been
depos-ited in NCBI’s Gene Expression Omnibus [58] and are
accessible through GEO SuperSeries accession number GSE116652 and the GEO Series GSE60107 for microar-rays and RNA-Seq data, respectively. Other supportive data are included as additional files.
Additional files
Additional file 1:Figure S1. Growth curves. The semilog plot shows the mean value and the standard deviation of three independent cultures. The sampling point in stationary phase is shown by an arrow. (A). The rph-1 control, (B) the rph-1Δrnr double mutant and (C) the rph-1 Δpnp double mutant. (PPTX 91 kb)
Additional file 2:Figure S2. mRNA half-life measurement with classical linear model fitted on decay of log concentration of mRNA over the time (expressed in minutes). Example of 50 random mRNAs selected among the 2856 available for all the three strains (Blue = the rph-1 control, Green = the rph-1Δpnp double mutant and Red = the rph-1 Δrnr double mu-tant). (PPTX 91 kb) (PPTX 430 kb)
Additional file 3:Figure S3. Correlation of half-lives with and without delays in the three strains. The coefficient of correlation is 1 and the slope of the linear model 0.98. (JPG 553 kb)
Additional file 4:Figure S4. Confirmation of mRNA half-life data by Northern blot experiments. Three mRNAs, ompA, osmB and nlpI were se-lected in the three strains for mRNA half-life measurements by Northern blot experiments. The list of primers used is given in the table and the T7 promoter sequences in the oligonucleotides are in bold. (PPTX 58 kb)
Additional file 5:Table S1. Selection of transcriptional regulators with a modified stability in the rph-1Δpnp double mutant. Fold-change (FC) of half-lives in the rph-1Δpnp double mutant compared to the rph-1 control strain is given with the associated p-value. The 6 stabilized mRNAs in the rph-1Δpnp double mutant are in red whereas the highest destabi-lized mRNAs defined with FC < 0.3 are in green. (DOCX 50 kb)
Additional file 6:Table S2. Total RNA yield and mRNA concentration in the 3 strains. AU: arbitrary unit, DCW: dry cell weight. (DOCX 39 kb)
Acknowledgements Not applicable. Funding
This work was supported by grants from the collaborative INTERREG Interbio project (2011–2012). This work was also supported by Fundação para a Ciência e Tecnologia (FCT-Portugal), Project LISBOA-01-0145-FEDER-007660
(Microbiologia Molecular, Estrutural e Celular - R&D Unit, UID/CBQ/04612/2013) funded by FEDER funds through COMPETE2020 - Programa Operacional Competitividadee Internacionalizacao (POCI) and project PTDC/BIA-MIC/1399/ 2014. This work also received funding from the European Union’s Horizon 2020 research and innovation program under grant agreement No 635536. Clémentine Dressaire and Vânia Pobre were recipient of FCT Post-Doctoral Fellowships (SFRH/BPD/65528/2009 and SFRH/BPD/87188/2012, respectively). Availability of data and materials
The datasets analyzed during the current study are available from the corresponding author on reasonable request.
Authors’ contributions
CD and VP carried out the experiments. CD, SL and LG performed the bioinformatics analyses of the data. CD, CMA and MCB designed the experiment. CD, VP, LG, CMA and MCB wrote the manuscript. All authors read and approved the final manuscript.
Ethics approval and consent to participate Not applicable.
Consent for publication Not applicable. Competing interests
The authors declare that they have no financial competing interests.
Publisher’s Note
Springer Nature remains neutral with regard to jurisdictional claims in published maps and institutional affiliations.
Received: 6 February 2018 Accepted: 16 November 2018
References
1. Arraiano CM, Andrade JM, Domingues S, Guinote IB, Malecki M, Matos RG, Moreira RN, Pobre V, Reis FP, Saramago M, et al. The critical role of RNA processing and degradation in the control of gene expression. FEMS Microbiol Rev. 2010;34(5):883–923.
2. Esquerre T, Laguerre S, Turlan C, Carpousis AJ, Girbal L, Cocaign-Bousquet M. Dual role of transcription and transcript stability in the regulation of gene expression in Escherichia coli cells cultured on glucose at different growth rates. Nucleic Acids Res. 2014;42(4):2460–72.
3. Silva IJ, Saramago M, Dressaire C, Domingues S, Viegas SC, Arraiano CM. Importance and key events of prokaryotic RNA decay: the ultimate fate of an RNA molecule. Wiley Interdiscip Rev RNA. 2011;2(6):818–36.
4. Bechhofer DH. Messenger RNA decay and maturation in Bacillus subtilis. Prog Mol Biol Transl Sci. 2009;85:231–73.
5. Mathy N, Benard L, Pellegrini O, Daou R, Wen T, Condon C. 5′-to-3′ exoribonuclease activity in bacteria: role of RNase J1 in rRNA maturation and 5′ stability of mRNA. Cell. 2007;129(4):681–92.
6. Andrade JM, Hajnsdorf E, Régnier P, Arraiano CM. The poly(a)-dependent degradation pathway of rpsO mRNA is primarily mediated by RNase R. RNA. 2009;15(2):316–26.
7. Mohanty BK, Kushner SR. Polynucleotide phosphorylase functions both as a 3′ right-arrow 5′ exonuclease and a poly(a) polymerase in Escherichia coli. Proc Natl Acad Sci U S A. 2000;97(22):11966–71.
8. Godefroy T. Kinetics of polymerization and phosphorolysis reactions of Escherichia coli polynucleotide phosphorylase. Evidence for multiple binding of polynucleotide in phosphorolysis. Eur J Biochem. 1970;14(2):222–31. 9. Grunberg-Manago M, Oritz PJ, Ochoa S. Enzymatic synthesis of nucleic
acidlike polynucleotides. Science. 1955;122(3176):907–10.
10. Spickler C, Mackie A. Action of RNases II and polynucleotide phosphorylase against RNAs containing stem-loops of defined structure. J Bacteriol. 2000; 182:2422–7.
11. Frazao C, McVey CE, Amblar M, Barbas A, Vonrhein C, Arraiano CM, Carrondo MA. Unravelling the dynamics of RNA degradation by ribonuclease II and its RNA-bound complex. Nature. 2006;443(7107):110–4. 12. Andrade JM, Cairrão F, Arraiano CM. RNase R affects gene expression in
stationary phase: regulation of ompA. Mol Microbiol. 2006;60(1):219–28. 13. Cairrão F, Cruz A, Mori H, Arraiano CM. Cold shock induction of RNase R
and its role in the maturation of the quality control mediator SsrA/tmRNA. Mol Microbiol. 2003;50(4):1349–60.
14. Chen C, Deutscher MP. Elevation of RNase R in response to multiple stress conditions. J Biol Chem. 2005;280(41):34393–6.
15. Cheng ZF, Zuo Y, Li Z, Rudd KE, Deutscher MP. The vacB gene required for virulence in Shigella flexneri and Escherichia coli encodes the
exoribonuclease RNase R. J Biol Chem. 1998;273(23):14077–80.
16. Donovan WP, Kushner SR. Polynucleotide phosphorylase and ribonuclease II are required for cell viability and mRNA turnover in Escherichia coli K-12. Proc Natl Acad Sci U S A. 1986;83:120–4.
17. Clements MO, Eriksson S, Thompson A, Lucchini S, Hinton JC, Normark S, Rhen M. Polynucleotide phosphorylase is a global regulator of virulence and persistency in Salmonella enterica. Proc Natl Acad Sci U S A. 2002;99(13): 8784–9.
18. Erova TE, Kosykh VG, Fadl AA, Sha J, Horneman AJ, Chopra AK. Cold shock exoribonuclease R (VacB) is involved in Aeromonas hydrophila pathogenesis. J Bacteriol. 2008;190(10):3467–74.
19. Haddad N, Tresse O, Rivoal K, Chevret D, Nonglaton Q, Burns CM, Prévost H, Cappelier JM. Polynucleotide phosphorylase has an impact on cell biology of Campylobacter jejuni. Front Cell Inf Microbiol. 2012;2:30.https://doi.org/ 10.3389/fcimb.2012.00030.
20. Tobe T, Sasakawa C, Okada N, Honma Y, Yoshikawa M. vacB, a novel chromosomal gene required for expression of virulence genes on the large plasmid of Shigella flexneri. J Bacteriol. 1992;174(20):6359–67.
21. Haddad N, Matos RG, Pinto T, Rannou P, Cappelier JM, Prevost H, Arraiano CM. The RNase R from Campylobacter jejuni has unique features and is involved in the first steps of infection. J Biol Chem. 2014;289(40):27814–24. 22. Andrade JM, Arraiano CM. PNPase is a key player in the regulation of small RNAs that control the expression of outer membrane proteins. RNA. 2008; 14(3):543–51.
23. Andrade JM, Pobre V, Matos AM, Arraiano CM. The crucial role of PNPase in the degradation of small RNAs that are not associated with Hfq. RNA. 2012; 18(4):844–55.
24. Andrade JM, Pobre V, Arraiano CM. Small RNA modules confer different stabilities and interact differently with multiple targets. PLoS One. 2013;8(1): e52866.
25. Liang W, Deutscher MP. Ribosomes regulate the stability and action of RNase R. J Biol Chem. 2013;288(48):34791–8.
26. Malecki M, Bárria C, Arraiano CM. Characterization of the RNase R association with ribosomes. BMC Microbiol. 2014;14:34.
27. Liang W, Malhotra A, Deutscher MP. Acetylation regulates the stability of a bacterial protein: growth stage-dependent modification of RNase R. Mol Cell. 2011;44(1):160–6.
28. Bandyra KJ, Sinha D, Syrjanen J, Luisi BF, De Lay NR. The ribonuclease polynucleotide phosphorylase can interact with small regulatory RNAs in both protective and degradative modes. RNA. 2016;22(3):360–72. 29. Bernstein JA, Lin PH, Cohen SN, Lin-Chao S. Global analysis of Escherichia
coli RNA degradosome function using DNA microarrays. Proc Natl Acad Sci U S A. 2004;101(9):2758–63.
30. Fonseca P, Moreno R, Rojo F. Genomic analysis of the role of RNase R in the turnover of Pseudomonas putida mRNAs. J Bacteriol. 2008;190(18):6258–63. 31. Liu B, Deikus G, Bree A, Durand S, Kearns DB, Bechhofer DH. Global analysis of
mRNA decay intermediates in Bacillus subtilis wild-type and polynucleotide phosphorylase-deletion strains. Mol Microbiol. 2014;94(1):41–55.
32. Mohanty BK, Kushner SR. Genomic analysis in Escherichia coli demonstrates differential roles for polynucleotide phosphorylase and RNase II in mRNA abundance and decay. Mol Microbiol. 2003;50(2):645–58.
33. Pobre V, Arraiano CM. Next generation sequencing analysis reveals that the ribonucleases RNase II, RNase R and PNPase affect bacterial motility and biofilm formation in E. coli. BMC Genomics. 2015;16:72.
34. Chen H, Shiroguchi K, Ge H, Xie XS. Genome-wide study of mRNA degradation and transcript elongation in Escherichia coli. Mol Syst Biol. 2015;11(5):808 n/a.
35. Moffitt JR, Pandey S, Boettiger AN, Wang S, Zhuang X. Spatial organization shapes the turnover of a bacterial transcriptome. Elife. 2016:5.https://doi. org/10.7554/eLife.13065.
36. Dressaire C, Picard F, Redon E, Loubiere P, Queinnec I, Girbal L, Cocaign-Bousquet M. Role of mRNA stability during bacterial adaptation. PLoS One. 2013;8(3):e59059.
37. Nurmohamed S, Vincent HA, Titman CM, Chandran V, Pears MR, Du D, Griffin JL, Callaghan AJ, Luisi BF. Polynucleotide phosphorylase activity may be modulated by metabolites in Escherichia coli. J Biol Chem. 2011;286(16): 14315–23.
38. Viegas SC, Pfeiffer V, Sittka A, Silva IJ, Vögel J, Arraiano CM. Characterization of the role of ribonucleases in Salmonella small RNA decay. Nucleic Acids Res. 2007;35(22):7651–64.
39. Liu MY, Gui G, Wei B, Preston JF 3rd, Oakford L, Yuksel U, Giedroc DP, Romeo T. The RNA molecule CsrB binds to the global regulatory protein CsrA and antagonizes its activity in Escherichia coli. J Biol Chem. 1997;272(28):17502–10. 40. Yakhnin AV, Baker CS, Vakulskas CA, Yakhnin H, Berezin I, Romeo T, Babitzke P. CsrA activates flhDC expression by protecting flhDC mRNA from RNase E-mediated cleavage. Mol Microbiol. 2013;87(4):851–66.
41. Esquerre T, Bouvier M, Turlan C, Carpousis AJ, Girbal L, Cocaign-Bousquet M. The Csr system regulates genome-wide mRNA stability and transcription and thus gene expression in Escherichia coli. Sci Rep. 2016;6:25057. 42. Nouaille S, Mondeil S, Finoux AL, Moulis C, Girbal L, Cocaign-Bousquet M.
The stability of an mRNA is influenced by its concentration: a potential physical mechanism to regulate gene expression. Nucleic Acids Res. 2017; 45(20):11711–24.
43. Bowden KE, Wiese NS, Perwez T, Mohanty BK, Kushner SR. The rph-1-encoded truncated RNase PH protein inhibits RNase P maturation of pre-tRNAs with short leader sequences in the absence of RppH. J Bacteriol. 2017;199(22).https://doi.org/10.1128/JB.00301-17.
44. Carpousis AJ. The RNA degradosome of Escherichia coli: an mRNA-degrading machine assembled on RNase E. Annu Rev Microbiol. 2007;61:71–87. 45. De Lay N, Gottesman S. Role of polynucleotide phosphorylase in sRNA
function in Escherichia coli. RNA. 2011;17(6):1172–89.
46. Saramago M, Bárria C, Dos Santos RF, Silva IJ, Pobre V, Domingues S, Andrade JM, Viegas SC, Arraiano CM. The role of RNases in the regulation of small RNAs. Curr Opin Microbiol. 2014;18:105–15.
47. Park H, Yakhnin H, Connolly M, Romeo T, Babitzke P. CsrA participates in a PNPase autoregulatory mechanism by selectively repressing translation of pnp transcripts that have been previously processed by RNase III and PNPase. J Bacteriol. 2015;197(24):3751–9.
48. Marujo PE, Hajnsdorf E, Le Derout J, Andrade R, Arraiano CM, Régnier P. RNase II removes the oligo(a) tails that destabilize the rpsO mRNA of Escherichia coli. RNA. 2000;6(8):1185–93.
49. Rustad TR, Minch KJ, Brabant W, Winkler JK, Reiss DJ, Baliga NS, Sherman DR. Global analysis of mRNA stability in Mycobacterium tuberculosis. Nucleic Acids Res. 2013;41(1):509–17.
50. Esquerre T, Moisan A, Chiapello H, Arike L, Vilu R, Gaspin C, Cocaign-Bousquet M, Girbal L. Genome-wide investigation of mRNA lifetime determinants in Escherichia coli cells cultured at different growth rates. BMC Genomics. 2015;16:275.
51. Arraiano CM, Yancey SD, Kushner SR. Stabilization of discrete mRNA breakdown products in ams pnp rnb multiple mutants of Escherichia coli K-12. J Bacteriol. 1988;170(10):4625–33.
52. Sambrook J, Russell D. Molecular cloning: a laboratory manual, 3rd edn. Cold Spring Harbor: Cold Spring Harbor Laboratory Press; 2001. 53. Gautier L, Cope L, Bolstad BM, Irizarry RA. Affy--analysis of Affymetrix
GeneChip data at the probe level. Bioinformatics. 2004;20(3):307–15. 54. Smyth GK, Michaud J, Scott HS. Use of within-array replicate spots for
assessing differential expression in microarray experiments. Bioinformatics. 2005;21(9):2067–75.
55. Irizarry RA, Hobbs B, Collin F, Beazer-Barclay YD, Antonellis KJ, Scherf U, Speed TP. Exploration, normalization, and summaries of high density oligonucleotide array probe level data. Biostatistics. 2003;4(2):249–64. 56. Benjamini Y, Hochberg Y. Controlling the false discovery rate: a practical
and powerful approach to multiple testing. J R Stat Soc Ser B Methodol. 1995;57(1):289–300.
57. Rutherford K, Parkhill J, Crook J, Horsnell T, Rice P, Rajandream MA, Barrell B. Artemis: sequence visualization and annotation. Bioinformatics. 2000;16(10):944–5. 58. Edgar R, Domrachev M, Lash AE. Gene expression omnibus: NCBI gene
expression and hybridization array data repository. Nucleic Acids Res. 2002; 30(1):207–10.