Universidade de Aveiro 2012
Departamento de Economia, Gestão e Engenharia Industrial
BAISHALI SARKAR
ATITUDE E INTENÇÕES EM RELAÇÃO A
ESTÍMULOS DE MENSAGENS VERBAIS E MARCAS
EM ANÚNCIOS
ATTITUDE AND INTENTIONS TOWARDS VERBAL
MESSAGE AND BRAND STIMULI IN PRINT AD
Universidade de Aveiro 2012
Departamento de Economia, Gestão e Engenharia Industrial
BAISHALI SARKAR
ATITUDE E INTENÇÕES EM RELAÇÃO A
ESTÍMULOS DE MENSAGENS VERBAIS E MARCAS
EM ANÚNCIOS
ATTITUDE AND INTENTIONS TOWARDS VERBAL
MESSAGE AND BRAND STIMULI IN PRINT AD
Dissertação apresentada à Universidade de Aveiro para cumprimento dos requisitos necessários à obtenção do grau de Mestre em Gestão, realizada sob a orientação científica da Doutora Sandra Maria Correia Loureiro, Professora Auxiliar do Departamento de Economia, Gestão e Engenharia Industrial da Universidade de Aveiro.
o júri
presidente Prof. Doutor António Carrizo Moreira
Professor auxiliar da Departamento de Economia, Gestão e Engenharia Industrial da Universidade do Aveiro
Prof. Doutor Eduardo Manuel Machado de Moraes Sarmento Ferreira
Professor associado da Universidade Lusófona de Lisboa
Prof. Doutora Sandra Maria Correia Loureiro
Professora auxiliar da Departamento de Economia, Gestão e Engenharia Industrial da Universidade do Aveiro
agradecimentos A very special thanks to Snehashis for supporting me strongly from the beginning of this journey; being an inspiration you brought the courage in me. No word is sufficient to thank you!
Lots of supports from my respectable Professor Sandra Loureiro. Thank you for guiding me.
Aveiro! Thanks because of the environment you gave me here, for introducing with so many beautiful hearts, I met in two years.
palavras-chave Perseção do consumidor, anúncios impressos, prazer, estímulo, Índia, Portugal, marca, café.
resumo Atualmente, torna-se muito importante para as empresas decidirem como o anúncio do bem ou serviço deve ser. Atrair clientes até um determinado limite não é muito difícil, mas para alcançar um grande número de clientes o processo de atração não é muito fácil com fortes concorrentes. Neste estudo, vamos analisar o impacte de mensagens escritas e de marcas como estímulos em anúncios impressos para os consumidores Índianos e Português.
Propomos um modelo para analisar como um anúncio impresso motiva a mente do cliente para ter uma atitude positiva e intenções favoráveis para o produto em dois países com culturas differentes: Portugal e Índia.
Selecionamos um produto: Café, que é muito popular e “famoso”,
especialmente para a geração de jovens de ambos os países. Os resultados mostram que a presença da marca pode ser mais eficaz do que mensagens impressas em anúncios publicitários.
keywords Consumer perception, print ad, pleasure, arousal, India, Portugal, brand, coffee.
abstract Nowadays, it becomes very important for the companies to decide how the advertisement of the goods or service should be. Attract customers to a certain limit is not very hard, but to gain the feedback from a huge number of
customers with strong existing competitors is not very easy. In this study, we are going to analyze the impact of print statements (messages) and brands as stimuli in print advertisements on Indian and Portuguese consumers. We propose a model to analyze how a print advertisement motivates the consumer mind to have a positive attitude and intentions to the product in two different cultural countries: Portugal and India. We have selected one product: coffee, which is very popular and famous especially for young generation of both countries. Findings show that brand presence could be more effective than messages printed in advertisements.
Content
Figures’ index ...ii
Tables’ index ... iii
Introduction ... iv
Part 1-Theoretical Background ... 1
Chapter1: S-O-R Theory ... 2
Chapter2: Stimuli advertising... 3
2.1 Information ... 3 2.2 Entertainment ... 3 2.3 Colour ... 3 2.4 Design ... 4 2.5 Presentation ... 4 Chapter3: Emotions ... 5
3.1 Arousal and pleasure ... 5
Chapter4: Outcomes or responses ... 7
4.1 Attitude ... 7
4.2 Purchase or Behavioural Intension ... 7
Chapter5: Gender Differentiation ... 9
Chapter6: Cultural differentiation ... 10
6.1 Hofstede and the five dimensions of culture ... 10
6.2 Cultural values of Schwartz ... 13
6.3 Cultural influence on visual persuasion ... 14
Chapter7: Visual persuasion... 16
Part 2-Empirical Study ... 17
Chapter8: Proposed model and hypotheses ... 18
Chapter 9: Methodology... 20
Chapter 10: Results ... 22
10.1 Descriptive statistics for Indian consumers ... 24
10.2 Descriptive statistics for Portuguese Consumers ... 29
10.3 Mean differences between Indian and Portuguese consumers ... 35
Part 3-Conclusion ... 87
Limitation and Further Research ... 87
Managerial implications ... 88
References ... 89
Annex ... 99
Figures’ index
Figure 1: Structure of the dissertation ... viFigure 2: example of print add ... 4
Figure 3: Global advertising research-understanding cultural values of consumers ... 12
Figure 4: Hofstede Cultural Dimension between India and Portugal ... 12
Figure 5: Cultural Values from Schwartz ... 14
Figure 6: Proposed model ... 19
Figure 7: background of the manipulated print advertising ... 21
Figure 8: Mean difference between Portugal and India: Picture 1 ... 38
Figure 9: Mean difference between Portugal and India: Picture 2 ... 41
Figure 10: Mean difference between Portugal and India: Picture 3 ... 44
Figure 11: Mean difference between Portugal and India: Picture 4 ... 47
Figure 12: Mean difference between Portugal and India: Picture 5 ... 50
Figure 13: Mean difference between Portugal and India: Picture 6 ... 52
Figure 14: Mean difference between Portugal and India: Picture 7 ... 56
Figure 15: Mean difference between Portugal and India: Picture 8 ... 60
Figure 17: Mean difference between male and female: Picture 2 ... 66
Figure 18: Mean difference between male and female: Picture 3 ... 69
Figure 19: Mean difference between male and female: Picture 4 ... 72
Figure 20: Mean difference between male and female: Picture 5 ... 75
Figure 21: Mean difference between male and female: Picture 6 ... 77
Figure 22: Mean difference between male and female: Picture 7 ... 81
Tables’ index
Table 1: Descriptive statistics- Gender (India) ... 22
Table 2: Descriptive statistics- Gender (Portugal) ... 22
Table 3: Indian Consumers Picture 1 (A cup that makes you a helping person) ... 24
Table 4: Indian Consumers Picture 2 (A cup for a very exclusive person) ... 25
Table 5: Indian Consumers Picture 3 (Same cup, same taste, as always...) ... 25
Table 6: Indian Consumers Picture 4 (A cup that makes you feel a winner)... 26
Table 7: Indian Consumers Picture 5 (A cup for sharing with friends) ... 26
Table 8: Indian Consumers Picture 6 (A cup of coffee makes you confident) ... 27
Table 9: Indian Consumers Picture 7 (BRU) ... 27
Table 10: Indian Consumers Picture 8 (DELTA) ... 28
Table 11: Portuguese consumers: picture 1 (A cup that makes you a helping person)... 29
Table 12: Portuguese Consumers Picture 2 (A cup for a very exclusive person) ... 30
Table 13: Portuguese Consumers Picture 3 (Same cup, same taste, as always...) ... 30
Table 14: Portuguese Consumers Picture 4 (A cup that makes you feel a winner) ... 31
Table 15: Portuguese Consumers Picture 5 (A cup for sharing with friends) ... 31
Table 16: Portuguese Consumers Picture 6 (A cup of coffee makes you confident) ... 32
Table 17: Portuguese Consumers Picture 7 (BRU) ... 33
Table 18: Portuguese Consumers Picture 8 (DELTA) ... 34
Table 19: PLEASURE compared between Portuguese and Indians ... 35
Table 20: AROUSAL compared between Portuguese and Indians ... 35
Table 21: Mean differences between India and Portugal, Picture 1 (A cup that makes you a helping person) 36 Table 22: Mean differences between India and Portugal, Picture 2 (A cup for a very exclusive person) ... 39
Table 23: Mean differences between India and Portugal, Picture 3 (Same cup, same taste, as always…) ... 42
Table 24: differences between India and Portugal, Picture 4 (A cup that makes you feel winner) ... 45
Table 25: Mean differences between India and Portugal, Picture 5 (A cup for sharing with friends) ... 48
Table 26: Mean differences between India and Portugal, Picture 6 (A cup of coffee makes you confident) .. 51
Table 27: Mean differences between India and Portugal, Picture 7 (BRU) ... 53
Table 28: Mean differences between India and Portugal, Picture 8 (DELTA) ... 57
Table 29: PLEASURE compared between male and female ... 61
Table 30: AROUSAL compared between male and female ... 62
Table 31: Mean differences between Male and Female, Picture 1 (A cup that makes you a helping person) . 62 Table 32: Mean differences between Male and Female, Picture 2 (A cup for a very exclusive person) ... 65
Table 33: Mean differences between Male and Female, Picture 3 (Same cup, same taste, as always…) ... 67
Table 34: Mean differences between Male and Female, Picture 4 (A cup that makes you feel winner) ... 70
Table 35: Mean differences between Male and Female, Picture 5 (A cup for sharing with friends) ... 73
Table 36: Mean differences between Male and Female, Picture 6 (A cup of coffee makes you confident) .... 76
Table 37: Mean differences between Male and Female, Picture 7 (BRU) ... 78
Introduction
Advertising (ad) is one of the most important things in present society and present era. Our research is about the incentive process of advertisement that coffee companies use according to the different cultural mind to persuade customer mentally to buy their products. To point out how they measure (or they have to measure) the psychological effects and changes by visualizing an ad, is our main subject.
Advertising (ad) is a form of communication used to encourage or persuade audience (viewers, readers or listeners) to continue or take some new action. It helps to keep the consumers informed about whatever new products or services are available in the market at their disposal. It helps to spread awareness about products or services that are of some use to consumer and potential buyers. Most commonly, the desired result is to drive consumer behaviour with respect to a commercial offering, although political and ideological advertising is also common.
The main objective of advertisement is to help the product gain maximum success by reaching maximum audience. Advertising campaign to impress the client is very important for a firm to take a strategic position against the competitor. So, nowadays, company without any advertisement, cannot reach to the targeted audience and the most important thing is, it can be wiped out from the market. So, the increasing competition to make a good ad among the competitors lead the companies think the consumer behaviour and their perceptions to buy a product. Designing a print ad or video or text messages- every single part is considered very sophistically to hit the main goal, consumer mind. Stimulating consumer mind towards the product by making them aware of the positive sides of the product or new product development or new design is very common to affect their thinking. Janssens, Wim & De Pelsmacker, Patrick (2005) has already proved that emotional ads have more impact towards purchase intention and it Works even in case of existing product more than a new one. A positive emotional context appeared to be more supportive for advertisements for existing products.
The current study analyse the effect of ads on consumer behaviour based on S-O-R theory. This theory is based on the environmental psychology proposed by Mehrabian and Russell (1974). This model is operationalized in a stimulus–organism–response (S–O–R) framework. The S–O–R framework suggests that the stimuli as antecedents affect the consumers’ emotional states (organism), whose response may result in their retail behaviours (responses) such as re-patronage, store search and in-store behaviour (Thang & Tan, 2003). The stimuli are operationalized as the atmospheric cues, organism as emotional and cognitive states of consumers, and response as approach/avoidance behaviours (Donovan & Rossiter, 1982). Traditionally retail environment uses the stimuli such as social, design, and ambient factors of fashion stores positively affect organism
variables such as pleasure and arousal of consumers, which have a positive impact on the amount of money spent in-store, store liking, the number of items purchased, and the time spent in-store. In this case also, consumers watch the advertisements through websites have the same factors. Sherman et al. (1997) showed that while social and design factors have a positive effect on pleasure, ambient factor has a positive impact on arousal. In addition, they found that pleasure has a positive impact on the amount of money spent and store liking, arousal has a positive effect on the amount of money spent and the number of items purchased.
The stimuli in the S–O–R framework are represented by a set of attributes that affect the perceptions of the consumer (Mazursky & Jacoby, 1986). These attributes are the starting point of the consumer behavioural process, and are cues that enter a consumer’s cognition and arouse or incite him (as a recipient) consciously or subconsciously into action. Visual cues are very important here along with the using of colour. We are describing the main points found in the articles below. The purpose of advertising may also be to reassure employees or shareholders that a company is viable or successful. It is viewed via various traditional media such as: Newspaper, Magazine, Websites, SMS, Social networking, TV, Web ads.
Regarding the print ads, the main goal of this study is:
-Compare the attitude towards the ad (pleasure, arousal, negative emotions and intentions) and the attitude towards the brand (positive attitude, negative attitude, and intentions) between male and female;
-Compare the attitude towards the ad (pleasure, arousal, negative emotions and intentions) and the attitude towards the brand (positive attitude, negative attitude, and intentions) between Indian and Portuguese people.
Our selected product is coffee. We have chosen this particular product because this is common and known to every citizen of India and Portugal and they have gained popularity also in these two countries. For such, we will start with theoretical background. Our proposed model is constructed mainly by S-O-R model. Still, we will apply the knowledge of Hofstede dimensions to differentiate the cultural values.
According to the previous study, different culture has different norms, habits and value judgements, which affect their intensity towards a product, differently. For an example, most of the Indian advertisements are not related to showing sex or nudity directly onscreen, but they use sounds or music or something else to create the situation indirectly. Contradictory, European ads are more free to use these.
In order to achieve our goal, this dissertation comprises 3 major parts beyond introduction: theoretical background, empirical study and conclusions. Figure 1 provides the structure of this dissertation by showing the main topics presented.
Figure 1: Structure of the dissertation
INTRODUCTION
Part1: Theoretical background
Stimuli advertising
Emotion
Outcome
Part2: Empirical study
Methodology
Results
Part3: Conclusions
Limitations
Further research
Source: Own elaborationPart 1-Theoretical Background
Mehrabian and Russell’s (1974) proposed environmental psychology’s S-O-R model is our base to assemble this study. Our proposed framework is also going through the same stimuli, organism and response-process. According to this framework, stimuli affects the consumers’ emotional states, which is organism, and as a result, consumers response through searching in the store, watching with a long time or/ and purchasing the product. According to Thang & Tan (2003), the customers give response in their retail behaviours such as re-patronage, store search and in-store behaviour. In this study, we are using two moderate variables: gender and culture. As male and female clients has different needs and different mentality of thinking, the presentation of publicity also should be thought in different way without harming anyone’s sentiment for the common product. For an example, Chhabra et al. (2011) have analysed in their study that tourism advertising of United States has used different kind of picture (using male female equity/ inequity) in different region. By analysing total 394 pictures they have concluded that different postures of male-female (and sometimes child is also included) elicits the different dominant system of society and culture.
According to Klink (2008) gender differences are in 1.colour perception, 2.psychological and social development affects like Females respond more favourably than males to brand names with front vowels and males back vowels. Or, Females will demonstrate greater sensitivity than males to brand name vowels. So, in case of choosing words for the brand-name also, the companies should be careful, because brand name can bring a good image to new customer.
Chapter1: S-O-R Theory
S-O-R is a combined process of stimuli, organism and response. Stimuli means those thing, set from outside, which work as catalyst to the attract consumer-mind positively towards the product or service. For instance, we can say that the cover of chocolates designed such way to attract the eyes. In this case, we are working on colour and messages used in advertisement, how it attracts the customer.
Organism is the middle process of stimuli and the reaction of consumer. Stimuli makes consumer react. But before consumer react, they have some feelings towards the product; that is organism. It is physiological or psychological (feelings, thinking etc), which cause a change in the emotional state of consumer. For an example, after watching an ad, somebody can think “I like it” or “o, I love this chocolate” or “wow, it’s nice (ad)” etc. This change of mind is organism. The present study adopts the emotional responses in two dimensions: pleasure and arousal. Pleasure is defined as ‘‘the degree to which a person feels good, joyful, happy, or satisfied in a situation (Menon & Kahn, 2002, p. 32).” This concept is usually measured with items such as happy/ unhappy, pleased/annoyed, and contented/melancholic (Eroglu et al., 2003); and it can be extended to joyful, happy or satisfaction. Arousal is defined as ‘‘the degree to which a person feels stimulated, active, or alert. Arousal is measured with items such as stimulated/relaxed, excited/calm, and aroused/un-aroused (Eroglu et al., 2001, 2003).
Response is perceptual activity, which is represented by value judgement, by customer. This is final action of customer as a reaction. Interestingly, it can be psychological reaction such as attitudes or behaviour. As per the organism process, the mental state can influence the consumers’ tendency to continue. Intention to stay, explore, and affiliate, avoidance behaviours concern the opposite (Mehrabian & Russell, 1974) are some of the probabilities of response. Example: after watching a new advertisement in television, person can settle up his mind to buy the coffee for trial. If he buys that, then it is his positive response towards the company.
Chapter2: Stimuli advertising
In this chapter several stimuli will be presented based on previous studies on advertising field: information, entertainment, colour, design, and presentation.
2.1 Information
Advertisements always pass some information to the customer about the product or service as a part of marketing. A company always has to explain why their product is different or unique from their competitors. It can be about the taste of coffee, or can be colour of coffee or added crème and less fat etc. The main factor is they have to share something unique, which will give the customer knowledge (can be, health consciousness) and the benefits of the product.
Bruce L. Stern et al.(1981) has showed 14 types of information that companies use in advertisement of a product: Price-value, Quality, Performance, Components or contents, Availability, Special offers, Taste, Nutrition, Packaging or shape, Guarantees and warranties, Safety, Independent research, Company research, New ideas.
2.2 Entertainment
This is very important for the selected two types of company. The way of presentation shouldn’t be only informatics. Customers will be bored if they are compelled to listen to that information like lectures. The companies push the injection of their opinion (information) in such way that customer will never think that they are affected by the fact. This brainstorming is possible very easily if the company makes the ads as an entertainment and customers would love to see the ads again and again. This may cause a positive intention to buy the product.
Videos often use song or music and sometimes, a background voice, explaining the situation when you need the product. For an example, Nescafé ad of Malaysia (2011) shares “lovely day” slogan with saying “make the moment” (with Nescafé). The customers will be really enchanted by the music and its lyrics as it is very simple and clean to remember. Thus, different happy modes from our daily life are collected in this ad to assure a customer that Nescafé will bring them a lovely day.
2.3 Colour
Clarke and Honeycutt, Jr. (2000) et a1. have determined that different cultures use different colour schema due to the amount of sun received, natural selection, biological factors (number of cones
conventions among the cultures around the world. The impact of using colour is different for different gender, different region and different social culture. Using colour in ads is very important because it effects strongly to the consumer mind and perceptions. For instance, girls love pink and now pink is concerned like a girlish colour. A boy or a man will never want to use pink mobile, but it seems to be favourite for a girl. So, in case of ad also, pink colour is used mostly to highlight the products used by girls or women, because it stimulates the girls’ mind with keen interest.
2.4 Design
Design is another item to stimulate the consumer mind. Here, design can be any kind of things to structure the base of an ad. An ad can be made by photography or animation, or collage, or variation of colour, or background effects of graphic design and etc. To impress the consumer, creating the moment(s) is very important. Sometimes, companies make it very simple, just using one colour in background and an obligatory message to hit the customer mind. For an example, see figure 2.
Figure 2: example of print add
Source: http://aext.net/2010/06/creative-print-advertisement-designs/
The figure 2 depicts a nice idea about advertising. This is a Canadian ad, campaigning the anti-smoking agenda. This ad is simple, but effective with the strong ironical words.
2.5 Presentation
As we can see the former ad, their presentation is awesome by this particular background colour and the designing. So, colour and designs are like materials which help to organize the presentation; but the presentation is a different activity. Especially in the videos, companies want to make a strong effect on consumer mind. The way of presentation can change the impact. Same message turns into strong weapon to compete the competitors.
Chapter3: Emotions
Emotion is a mental state that arises spontaneously rather than through conscious effort and is often accompanied by physiological changes; a feeling. Edell and Burke (1987) demonstrated that feelings generated by ads are conceptually different from thoughts about the ad and both are important and contribute uniquely to explaining the effects of advertising. Goldberg and Gom (1987) examined funny or sad television program to induce a positive or negative mood and found that both types of commercials were rated as more effective when embedded within the funny program and that this effect was strongest for the emotional commercials. Olney, Holbrook and Batra (1991) showed how mood responses to an advertisement affected viewing time of the advertisement. They found that advertising content influenced both the positive-negative and arousal dimensions of mood and, most effectually, the consumers spent more time watching advertisements with positive content, which created happy moods in the viewer. Batra and Stayman (1990) has reported that positive moods indirectly influenced consumers' attitudes toward the brand by reducing the number of negative thoughts generated and, by reducing total cognitive elaboration, making processing more heuristic than systematic. Multiple previous studies have found that a positive mood enhances the rating of an advertisement's effectiveness, consumers' information processing ability and recall. Contented consumers are likely to be quite receptive to 'warm' advertisements (Aaker and Stayman, 1989), as these would help maintain and support their emotional tranquillity, because contented consumers are in a state of low arousal and positive emotion, they may use heuristic processing to simplify decision tasks (Batra and Syman, 1990).On the other hand, Hirschman, Elizabeth C.; Stern, Barbara B. (1999) have divided the contended customers such as: Happy Consumers/Active Consumption, Sad Consumers/Passive Consumption, Angry Consumers/Hostile Consumption.
3.1 Arousal and pleasure
Arousal is defined as ‘‘the degree to which a person feels stimulated, active, or alert”. It is measured with items such as stimulated/relaxed, excited/calm, and aroused/un-aroused (Eroglu et al., 2001, 2003). Arousal in the current study is defined as the extent to which an individual who engages in an print ad or video ad and feels stimulated, active, or excited when he shops the coffee or chocolate shown in the TV ad or print ad in newspaper. Pleasure is ‘‘the degree, to which a person feels good, joyful, happy, or satisfied in a situation (Menon and Kahn, 2002, p. 32).” This concept is usually measured with items such as happy/unhappy, pleased/annoyed, and contented/melancholic (Eroglu et al., 2003). Accordingly, pleasure in the present study is more
specifically defined as the extent to which an individual feels good, joyful, happy, or satisfied in an online retail shopping environment. The video ad can show, for example, a chocolate like very impressive in shape or guise, exciting in nature and delicious in taste with an eternal feelings or something else. The consumer perception also works towards the shown pictures or movies to enjoy the moment of melting chocolate inside the mouth. This is the feeling of pleasure, what customer wants to feel and after that, wants to be satisfied.
Chapter4: Outcomes or responses
Based on literature review, we can point out two major outcomes usually analysed in the advertising field of research: attitude and purchase or behavioural intentions.
4.1 Attitude
Consumers are individuals with likes and dislikes. When the preponderance of people in a particular group feel one way or another about a product, service, entity, person, place or thing, it is said to be a generalized consumer attitude that could affect the marketing of that person, product or entity in positive or negative ways. Marketers strive to influence consumer attitudes, and understanding the prevailing attitude is the first step to changing it if needed.
Customers can respond positively or negatively to a particular advertisement. Customers who have more positive attitudes toward advertising are more likely to be persuaded by advertising (Mehta, 2000). Meanwhile, Ducoffe (1996) has explored the antecedents of consumer attitudes toward website advertising. Previous studies have focused on the characteristics of online advertising that influence customer attitudes by considering the unique characteristics of the Internet as opposed to offline advertising (Campbell and Wright, 2008; Coyle and Thorson, 2001; Johnson et al., 2006; Peng et al., 2004).
4.2 Purchase or Behavioural Intension
After having knowledge of a product or service, when a person wants to have that specific product or service of specific brand, that mental situation is called “purchase intention” of customer towards the product or service. Already we have discussed that the main goal of ads is to help the product gain maximum success by reaching maximum audience. So, the next step is, by reaching maximum audience, the brand want to impress their new customer towards themselves. In S-O-R theory, the stimuli is the main process, by whom, the brand wants to evolve the positive emotion and positive attitude afterwards. This leads the customer to discover intention to buy the specific product.
Customer attitude is important to understand because attitudes can generally predict customer purchasing intentions and behaviour (Oliver, 1980; Shih, 2004). Moreover, consumers are more likely to have a stronger intention to purchase a product when they react favourably to an advertisement about that product (Haley and Baldinger, 2000; MacKenzie and Lutz, 1989). Recent studies of online advertising have also shown positive relationship between attitude and purchase
intentions and between attitude and behaviour, such as the likelihood of buying, online visitations, and online shopping frequency (Bruner and Kumar, 2005; Karson and Fisher, 2005; Korgaonkar and Wolin, 2002; Stevenson et al., 2000; Wang et al., 2009; Wolin et al., 2002). Previous study confirmed the results of other studies on the direct impact of advertisement attitudes on brand attitudes and that of brand attitudes on purchase intentions (Homer, 1990; MacKenzie and Lutz, 1989; Stayman and Aaker, 1988).
Chapter5: Gender Differentiation
In what concerns to gender differentiation, previous studies point out that it is possible to analyze: i) Difference between male and female customer in case of attitude and purchase intention; and ii) using different gender in the ad as character (Richard R. Klink, 2008). Previous study has already proved the gender differences not only in colour perception, but also, psychological and social development affects females’ response more favourably than males to brand names. (Richard R. Klink, 2008)
Deepak Chhabraa et al. (2011) have proved that sometimes companies are more careful to show male female with full gender division according to the particular society in their ads. Many places, women are predominantly portrayed as smaller in size or in reputation than men.
So, in this project also, gender is very important measure as coffee is favoured by both male and female. The way of presentation of an ad is different to attract male or female customer. Coffee has to attract both of them. How they maintain to attract both? What are the features they put together in the advertisement without harming another gender’s feelings.
Chapter6: Cultural differentiation
Culture is an integrated pattern of human knowledge, belief, and behaviour that depends upon the capacity for symbolic thought and social learning .Region, religion, language etc make the differences in culture. Varnum, Michael E. W. et al. (2009) has divided the differentiation through Values & beliefs( Individualism Autonomy), Self Independent (self-construal, Personal social identity, Self as bounded), Emotions (Higher propensity of socially disengaging emotions, Happiness as a disengaging emotion), Motivation Individual achievement, Self-enhancement, Ego-inflation). Through the image of “culture” people behaves differently in different region. Basic intention to purchase a product is not also same in different countries especially east and west really have a big difference in their daily life-style. To understand the differentiation of both culture (Portugal and India), we are following the theories of Hofstede and Schwartz.
6.1 Hofstede and the five dimensions of culture
Hofstede proposed five dimensions of culture: power distance, individualism, masculinity, uncertainty avoidance and long term orientation.
1. Power/Distance (PD): This dimension expresses the degree to which the less powerful members of a society accept and expect that power is distributed unequally. The fundamental issue is how a society handles inequalities among people. People in societies exhibiting a large degree of power distance accept a hierarchical order in which everybody has a place and which needs no further justification. In societies with low power distance, people strive to equalise the distribution of power and demand justification for inequalities of power.
2. Individualism (IDV): The high side of this dimension, called Individualism, can be defined as a preference for a loosely-knit social framework in which individuals are expected to take care of themselves and their immediate families only. Its opposite, Collectivism, represents a preference for a tightly-knit framework in society in which individuals can expect their relatives or members of a particular in-group to look after them in exchange for unquestioning loyalty. A society's position on this dimension is reflected in whether people’s self-image is defined in terms of “I” or “we.”
3. Masculinity (MAS): The masculinity side of this dimension represents a preference in society for achievement, heroism, assertiveness and material reward for success. Society at
large is more competitive. Its opposite, femininity, stands for a preference for cooperation, modesty, caring for the weak and quality of life.
4. Uncertainty/Avoidance Index (UAI): The uncertainty avoidance dimension expresses the degree to which the members of a society feel uncomfortable with uncertainty and ambiguity. This fundamental issue is how a society deals with the fact that the future can never be known: should we try to control the future or just let it happen? Countries exhibiting strong UAI maintain rigid codes of belief and behaviour and are intolerant of unorthodox behaviour and ideas. Weak UAI societies maintain a more relaxed attitude in which practice counts more than principles.
5. Long Term Orientation (LTO): The long-term orientation dimension can be interpreted as dealing with society’s search for virtue. Societies with a short-term orientation generally have a strong concern with establishing the absolute Truth. They are normative in their thinking. They exhibit great respect for traditions, a relatively small propensity to save for the future, and a focus on achieving quick results. In societies with a long-term orientation, people believe that truth depends very much on situation, context and time. They show an ability to adapt traditions to changed conditions, a strong propensity to save and invest, thriftiness, and perseverance in achieving results.
Figure 3 shows the Hofstede model and the Applications to global branding and advertising strategy and research. The figure 4 presents a comparison of the Hofstede dimensions between two countries: Portugal and India.
Figure 3: Global advertising research-understanding cultural values of consumers
Source: De Mooij Marieke and Geert Hofstede, The Hofstede model: Applications to global branding and advertising strategy and research (2010)
Figure 4: Hofstede Cultural Dimension between India and Portugal
Source: http://geert-hofstede.com/countries.html
As we can see in the Figure 4, the cultural difference is very apparent between India and Portugal. In result, the mentality and the behaviour, habits are also different among these two country’s
people. Still, coffee is popular in both countries. The companies have tackled both of them either with some common measurement, or they have applied different tactics for different countries. The first solution cannot be very effective as the customers from different countries have to feel something different and unique attraction towards the same products. We hope, our study will be able to reveal some uniqueness of advertisement of coffee in these two countries.
6.2 Cultural values of Schwartz
Schwartz has made his model after Hofstede. So, naturally he followed the previous cultural dimensions and it has a great impact on his model or in other words, it made the base of Cultural values. According to theory, the seven value types are postulated to form three bipolar dimensions that express the contradictions between the alternative resolutions to each of the three issues just described from opposite perspective such as: Autonomy versus Conservatism, Hierarchy versus Egalitarianism and Mastery versus Harmony (see figure 5).
Autonomy: The cultures in which the person is viewed as an autonomous, bounded entity who finds meaning in his or her own uniqueness, who seeks to express his or her own internal attributes (preferences, traits, feelings, motives) and is encouraged to do so.
Intellectual Autonomy: A cultural emphasis on the desirability of individuals independently pursuing their own ideas and intellectual directions (curiosity, broadmindedness, creativity).
Affective Autonomy: A cultural emphasis on the desirability of individuals independently pursuing affectively positive experience (pleasure, exciting life, varied life).
Conservatism: A cultural emphasis on maintenance of the status quo, propriety, and restraint of actions or inclinations that might disrupt the solidary group or the traditional order (social order, respect for tradition, family security, wisdom).
Hierarchy: cultural emphasis on the legitimacy of an unequal distribution of power, roles and resources (social power, authority, humility, wealth).
Egalitarianism: cultural emphasis on transcendence of sel.sh interests in favour of voluntary commitment to promoting the welfare of others (equality, social justice, freedom, responsibility, honesty).
Mastery: A cultural emphasis on getting ahead through active self-assertion (ambition, success, daring, competence).
Harmony: A cultural emphasis on fitting harmoniously into the environment (unity with nature, protecting the environment, world of beauty).
Figure 5: Cultural Values from Schwartz
Schwartz, Shalom H.; A Theory of Cultural Values and Some Implications for Work (1999)
6.3 Cultural influence on visual persuasion
For the ad context, previous studies showed that Western and Eastern cultures employ different ways of delivering ad messages (Koga & Pearson, 1992; Kim et al., 1998; Cho et al., 1999; Choi et al., 2005; An, 2006). In high-context cultures, ad messages tend to be delivered in an abstract, implicit and indirect manner, as dependence on context is believed very high. In contrast, in low-context cultures, the ad message is quite explicit and direct. In particular, this has been reflected in the use of direct vs indirect messages at visual execution level (Cutler & Javalgi, 1993; An, 2003a), celebrity models (Choi et al., 2005), creative strategies such as symbolic assertion and brand
familiarisation (An, 2003b), product comparison using visual messages (Zhou et al., 2005), and information cues (Oh et al., 1999; Choi et al., 2005; An, 2006).
Miracle (1987) brought up the mood and feeling side of advertisements in his cross-cultural study on Japan, Korea and the US. Studies (Miracle, 1987; Javalgi et al., 1995) have found that ads in high-context cultures tend to use indirect and implicit messages such as making good friends, which tend to lead to consumers having good feelings about the advertiser (Taylor et al., 1997). Among many, Moriarty’s (1987) content analyses of US ads shed light on cross-cultural differences in visual form execution of advertising. US ads used various visual forms such as product description (21%), association with a person (22%) and metaphor/aesthetic (12%).
In their six-country cross-cultural study, Cutler et al. (1992) also found that US magazine ads relied more on direct rather than indirect visuals in general. Contrary to their expectations, they found that Korea was the most direct advertiser among the six countries studied. They concluded that the cross-cultural difference was not clear in that they found evidence of indirectness of visual forms far less than expected.
Chapter7: Visual persuasion
Visual messages in advertising are found to be more easily and quickly processed, and more effective in getting attention (Rossiter, 1982) and stimulating curiosity than verbal messages (Berger, 1998; Lester, 2000; Wells et al., 2003), regardless of processing condition (McQuarrie and Mick, 2003). Visuals in ads are not only the major form of delivering messages, but it tends to be scanned first and considered as an important criterion for making purchase decisions (Smith, 1991). In their experimental study, Hirschman and Solomon (1984) found that consumers felt visuals in ads more aesthetic and emotional compared to verbal messages, which were viewed as more functional. Other research (Pracejus, 2003) has argued that the visual elements also provide information, as they persuade, not merely by modifying, accentuating or interfering with words, but rather they are fully capable of conveying persuasive information in and of themselves. Callow and Schiffman (2002) raised the complexity issue. In their definition, the complexity of a visual image refers to the level of implicit versus explicit information that is needed in order to arrive at a meaningful interpretation of the advertisement’s message. This may be why advertisements often resort to simple visual images as a means for creating brand or product awareness. A complex visual image, on the other hand, is a ‘pictorial representation that relies predominantly on implicit meaning’ (Phillips, 1997). The audience needs to make inferences to interpret the message, relying on prior product and advertising knowledge as well as cultural conventions to solve the message (McCracken, 1986; Phillips, 1997).
Too many unwanted ad messages may make consumers process information more selectively, based on their needs rather than mass cultural value. New product ads were rated higher on the dimension of relevant news, but lower on the dimensions of familiarity and stimulation (Young and Robinson, 1991; Olson et al., 1982).
All these previous studies imply that ads for new product tend to be more explicit and consistently direct while established product ads tend to be more implicit and varied in many ways.
Part 2-Empirical Study
The second part of this dissertation is devoted to the empirical study. Therefore, first the conceptual proposed model will be presented, then the methodology employed and finally the results. Based on literature review it was possible to find a gap in the print advertising field of research, that is, the demanding for more research that analyzes the perceptions of statements of potential consumers in different countries and even regarding gender issues. Therefore, in order to help to fulfil this gap, the main goal of this dissertation is:
-Compare the attitude towards the ad (pleasure, arousal, negative emotions and intentions) and the attitude towards the brand (positive attitude, negative attitude, and intentions) between male and female;
-Compare the attitude towards the ad (pleasure, arousal, negative emotions and intentions) and the attitude towards the brand (positive attitude, negative attitude, and intentions) between Indian and Portuguese people.
Chapter8: Proposed model and hypotheses
The research model of this dissertation is shown in figure 6. The model is based on theoretical foundations of the environmental psychology proposed by Mehrabian and Russell (1974) and Donovan and Rossiter (1982). According to Mehrabian and Russell (1974), atmospherics are converted into meaningful information and used to comprehend the environment before consumers’ making any judgment or conclusion. Atmospherics cause a change in the emotional state of the consumer. Previous empirical research suggested that atmospherics have a positive effect on emotional responses. In the other hand, Mummalaneni (2005) and Davis, Wang, and Lindridge (2008) showed that web atmospheric cues have positive impacts on both pleasure and arousal. Interestingly, Wu et al. (2008) showed with the analysis of music and colour that website with fast tempo music (with tempos in a range of 68 and 178 beats per minute) and warm red colour (against cool blue colour) has positive impacts on pleasure and arousal, both of which have subsequent impacts on intention to purchase. According to the present study, difference in gender, curiosity and culture-these three moderators, makes variation in result. What concerns to moderated variables we expected to find different results depending on gender, culture and curiosity.
Menon and Kahn (1995) demonstrated that both pleasure and arousal have a positive impact on approach shopping behaviours such as browsing, unplanned purchasing, and seeking out more stimulating products. It seems that people with more Epistemic curiosity1 would be more involved with the brand with more pleasure and arousal. Eroglu et al. (2003) showed that both pleasure and arousal has a strong positive effect on both satisfaction and approach/avoidance behaviours. In what concerns to culture, Davis et al. (2008) empirically showed that cultural values (Americans vs. Chinese) moderate the links from low task cues (atmospheric cues) to pleasure and arousal. Zubcevic and Luxton (2011) have informed that Australia is a low-context and Croatia is a high-context country. Czarnecka and Brennan (2009) has proved that value appeals used in print advertising from Poland, the UK, Hungary and Ireland are different in each country. Eroglu et al. (2003) showed that low involvement and high atmospheric responsiveness moderate the link between site atmosphere and pleasure; however, low involvement and high atmospheric responsiveness do not moderate the link between site atmosphere and arousal. I- and D-type EC both motivate knowledge-seeking behaviour; they are not conceptualized as orthogonal dimensions. This makes consumer more motivated towards the product.
1
Epistemic curiosity is defined as the desire that motivates individuals to learn new ideas, eliminate information gaps, and solve intellectual problems (Litman, 2008).
Based on previous research the following hypotheses are proposed:
H1: Attitude towards the ad (pleasure, arousal, negative emotions and intentions) will be different for male and female
H2: Attitude towards the brand (positive attitude, negative attitude, and intentions) will be different for male and female
H3: Attitude towards the ad (pleasure, arousal, negative emotions and intentions) will be different for Indian and Portuguese people.
H4: Attitude towards the brand (positive attitude, negative attitude, and intentions) will be different for Indian and Portuguese people.
Figure 6: Proposed model
Cup of coffee Advertising
Stimuli Statements
brands
Attitude towards the ad Emotions: pleasure, arousal,
negative emotions Intentions
Attitude towards the brand DELTA or BRU Positive attitude, negative
attitude, and intentions
Gender
Culture (India and Portugal)
S-O-R
Stimuli and attitude (emotions and intentions)
Chapter 9: Methodology
Before carried out the main study, two previous studies need to be undertaken: selection of the product to advertise and selection of the statements as well as the brand in order to manipulate the ad.
Study 1
Using a group of 100 students from two major universities in Portugal and India, it was possible to understand that coffee is a drink well recognized in both counties, Portugal and India. The same exploratory inquire allow to understand that DELTA is a coffee brand well known in Portugal but not in India. On the other hand, BRU is a coffee brand well known in India but not in Portugal.
Study 2
Based on Hofstede dimensions and Kyunghee (2009), Callow and Schiffman (2002) An (2003a), and Zubcevic and Luxton(2011)’s studies, a list of words and statements were prepared regarding the culture characteristics of the two counties. The list was first built in English than back-translated to Portuguese in order to keep the same meaning. Then, using a group of 50 students from two major universities in Portugal and India, it was possible analyse which words and statements were more suitable to be used in print advertisings for each counties.
Study 3
The main study starts with the selection of the picture representing the background of the advertising. First, it was collected a lot of advertisements (print ads and videos) of coffee to measure the facts behind the attraction of consumers through the Medias mentioned above (except sms). But to measure consumer perception for this research, we have selected only one picture of coffee (see figure 7) and two different coffee brands, which are overall known and famous to most of the citizens of each country and unknown to vice-versa. Delta from Portugal and Bru from India are the two brands we used to measure brand emotion of different country.
Using the picture showed in figure 7, a group of 8 print advertisings were manipulated in order to analyze statements and brands.
Figure 7: background of the manipulated print advertising
Source: coffee image from Google (free access)
Measurement
For each of the 8 images, a list of items was formulated to measure attitude towards the ad (pleasure, arousal, negative emotions and intentions) and attitude towards the brand (positive attitude, negative attitude, and intentions), based on previous studies (e.g., Bruce, Huhmanna & Mott-Stenerson, 2011; Bakir & Palan, 2010). The respondents used a seven point likert-scale (1=strongly disagree to 7= strongly agree) to complete the questionnaire.
Survey and Sample
The survey has been conducted mainly within students from University of Aveiro, ISCTE-IUL (Portugal), Jadavpur University (India), Indian Institute of Management (IIM) and Indian Institute of Technology. In each section for presenting the manipulated ads, first the intention of the study was explained, and then each ad was viewed during a period of 30 second. Therefore, each observation of each ad was followed by the respective questionnaire. Sample dimension is: 73 collected from India and 174 from Portugal.
Chapter 10: Results
The collected data was treated using SPSS software. First the sample characterization is presented, then the descriptive statistics and finally the mean difference in order to test the hypotheses. We prepared our questionnaire with 8 pictures, which consist to the same image with different message or key-line. Among these 8 pictures, 2 were without message, just with two different brand logos (one for each). To fulfil the objectives of the present work, we experimented English questionnaire with Indian students and Portuguese questionnaires with Portuguese students from several universities and collected total 247 samples. The results are minutely described in the following description with the tables.
Table 1: Descriptive statistics- Gender (India)
Source: Author
In Table 1, we can see the gender ratio of Indian participants, where male participants are almost 4 times more than females. This big difference of male and female participants proves the characteristics of particular culture where males are more active than females, in this case.
Table 2: Descriptive statistics- Gender (Portugal)
On the other hand, most of the Portuguese respondents of this survey are females. In Portugal, female ratio is not only higher than males, but also they are more active than men. India has less female ratio than male, still it’s not 4times lower. In short, Portuguese respondents male: female= 34%: 66% (approx.), whereas Indian male: female respondents= 79,5%: 20,5%.
We have got answer from various age groups- from 18 to 43. Mostly the answers are collected from 20-21-22 years’ young people (44,5%). Among female participants average age is 22,36 and among male participants it is 23,42. In case of Indian people, the average age is 24,19 and Portuguese average age is 22,30. Among the total sample of 247, 32% people have fully agreed that they have strong interest in coffee and 17,8% people had neutral answer. On other side, 35,6% people have totally disagreed to get bored when other people talk about coffee and 22,3% had neutral answer. Total number of 186(71.7%) people are familiar with the Portuguese brand DELTA and only 57 (23,2%) are aware of BRU[This small number of awareness for BRU is because Nescafe has the highest dominance in India.]. 150 (60,7%) people don’t know this brand and 20% people have neutral answer.
10.1 Descriptive statistics for Indian consumers
10 statements are there for each picture and only no. 7 and 8 picture have 19statements for each. First 6 pictures have same statements with different sequence, and 7th and 8th picture have extra 9 statements especially to measure brand emotion. We used Likert scale (1 to 7) to measure participants’ pleasure, arousal and attitudes. 1= “Strongly disagree”, 4= “neutral” and 7= “Strongly agree”. The participants had to mark the point for each statement of each picture. In this way, each participant needed to mark total 98 answers.
Along with this, we asked their age, gender and nationality. Total survey was made anonymously just to count their presence statistically. In the following tables, we have shown how Indian consumers have reacted over each picture. Picture 2, 4 and 6 are made especially to insist Indian consumer, because these pictures have those statements, which are closer to Indian culture. Picture 7 is also made for this group of people as Bru is a known brand and unknown to Portuguese.
Table 3: Indian Consumers Picture 1 (A cup that makes you a helping person)
As we can see in the table 3 that “I like this ad” has highest mean for Indian participants, and “the ad is interesting to me”, “the ad is enthusing”, “exciting”, “I feel happy by watching this ad”- all have got more attention to young Indian consumers more than average. This study proves that by watching this ad they felt pleasure and arousal and they had intention to buy the product.
Table 4: Indian Consumers Picture 2 (A cup for a very exclusive person)
Table 4 shows the result of questionnaire specially made for Indians with the strength of the word “exclusive”. But the result doesn’t show expected result, not even like the previous one. The word “exclusive” doesn’t have that much impact on youth as it was expected from the empirical research. The word “interesting” only has made high pleasure among them.
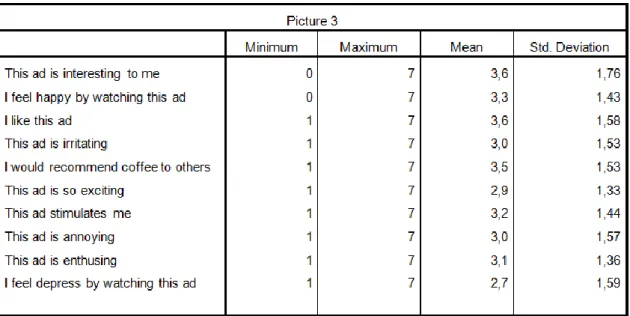
Table 5: Indian Consumers Picture 3 (Same cup, same taste, as always...)
Picture 3 has also average impact on Indian young consumers. Table 5 shows that “I like this ad” statement has got higest mean point. “Same cup, same taste, as always”- this statement in the picture is normally for those who like to feel nostalgic thoughts. Interestingly, it doesn’t have
Table 6: Indian Consumers Picture 4 (A cup that makes you feel a winner)
“A cup that makes you winner”- This message in the picture was created especially to judge Indian customers. Feeling like a “winner” makes them think that the ad is really “enthusing” and “interesting”. Overall, they have positive attitude towards this ad. (see Table 6)
Table 7: Indian Consumers Picture 5 (A cup for sharing with friends)
“Sharing with friends” has made Indian young consumers more energetic. They want to recommend this coffee to others, and they feel happier, stimulating by liking this ad. Here, we have got the highest intention towards the ad than the other pictures.(see table 7)
Table 8: Indian Consumers Picture 6 (A cup of coffee makes you confident)
Indian people have reacted as we expected through designing this ad. They have showed very positive react towards being “confident”. “I like this ad” and “I feel happy by watching this ad” have got highest score in this picture. (see table 8)
Table 9: Indian Consumers Picture 7 (BRU)
Descriptive Statistics
N Minimum Maximum Mean
Std. Deviation
This ad is interesting to me 73 1 7 3,52 2,04
I like this ad 73 1 7 3,77 2,11
This ad is irritating 73 1 7 3,58 2,11
I would recommend coffee to others 73 1 7 4,4 1,85
This ad is exciting 73 1 7 3,66 2,04
This ad is stimulating 73 1 7 4,4 1,73
This ad is enthusing 73 1 7 4,03 1,76
This ad is annoying 73 1 7 3,33 1,88
I feel happy by watching this ad 73 1 7 3,97 1,76
I feel depress by watching this ad 73 1 7 3,01 2,02
This brand is good 73 1 7 4,52 1,80
I like this brand 73 1 7 4,05 2,02
This is a stupid brand 73 1 7 3,53 2,02
This is a wise brand 73 1 7 4,64 1,62
Next time if I need such a product, I
will buy this advertised product 73 1 7 3,58 1,86
I would recommend this brand to
This brand matters a lot to me 73 1 7 3,93 1,82 The brand is unfavourable to me
because I don't know this brand 73 1 7 3,34 1,95
Picture 7 was made for Indian consumer as it is to measure emotion towards brand and BRU is well-known coffee brand in India, while it is totally unknown for Portuguese people. Indians have considered this brand as “good” and “wise brand” and like to recommend the brand to others. They are stimulated and happy to watch the logo of brand. They even supported BRU as a good brand. Overall, Indians have appreciated this picture as an ad. (see table 9)
Table 10: Indian Consumers Picture 8 (DELTA) Descriptive Statistics
N Minimum Maximum Mean
Std. Deviation
This ad is interesting to me 72 1 7 3,54 1,84
I like this ad 73 1 7 3,21 1,86
This ad is irritating 73 1 7 3,67 1,92
I would recommend coffee to others 73 1 7 3,64 1,68
This ad is exciting 73 1 7 3,29 1,60
This ad is stimulating 73 1 7 3,79 1,54
This ad is enthusing 73 1 7 3,59 1,71
This ad is annoying 73 1 7 3,41 1,67
I feel happy by watching this ad 73 1 7 3,53 1,44 I feel depress by watching this ad 73 1 7 3,37 1,75
This brand is good 73 1 7 3,71 1,52
I like this brand 73 1 7 3,26 1,68
This is a stupid brand 73 1 7 3,56 1,59
This is a wise brand 73 1 7 3,84 1,46
Next time if I need such a product, I
will buy this advertised product 72 1 7 3,29 1,67 I would recommend this brand to
others 73 1 7 3,71 1,53
This brand is related to my life 73 1 7 3,04 1,53
This brand matters a lot to me 73 1 7 3,27 1,77
The brand is unfavourable to me
As DELTA was unknown brand almost for all Indians, so we expected to have poor remarks for picture 8. In the table 10, we can see very average marks for all the 19 statements and not much difference among each other. This is much poor result than what we got from picture 7 (table 9).
10.2 Descriptive statistics for Portuguese Consumers
The same survey as described before how we conducted among Indians, we followed the same way to get Portuguese views also. In the following tables, we have put the average value of 174 young Portuguese students. To reach the goal, we set 3 pictures with statements which are more connected to Portuguese culture according to the empirical study. Picture 1,3 and 5 are those pictures; and picture no. 8 is also especially made for Portuguese consumer as it is with their known brand logo Delta.
Table 11: Portuguese consumers: picture 1 (A cup that makes you a helping person)
In table11, Portuguese people have reacted average towards the message (A cup that makes you a helping person). It shows that “helping” attitude is not too much prominent among them, though empirical study says that it is. In case of advertisement, it couldn’t stimulate them much, not even they are much annoyed or felt depress by watching this ad. Overall, they didn’t react much with this statement.
Table 12: Portuguese Consumers Picture 2 (A cup for a very exclusive person)
As we expected, “exclusive” couldn’t make them much responsive. In table 12, we got the result very average for picture 2.
Table 13: Portuguese Consumers Picture 3 (Same cup, same taste, as always...)
Picture 3 was designed for Portuguese people; interestingly here also we got medium means. The words “interesting” and “like” have got attention of Portuguese. (see table 13)
Table 14: Portuguese Consumers Picture 4 (A cup that makes you feel a winner)
Feeling “winner”- this statement can’t make Portuguese people motivated towards the ad, as expected, though they have showed positive intention to recommend coffee to others after watching the ad. (see table 14)
“A cup for sharing with friends” have made Portuguese young consumer very energetic and they have liked this ad very much. They have expressed less irritation and annoy. Table 15 shows that they have expressed more happiness and stimuli.
Table 16: Portuguese Consumers Picture 6 (A cup of coffee makes you confident)
Picture 6 referred to the confidence, which was mainly designed for Indian people. The result shows (in the table 16) that Portuguese reaction is very medium towards this ad. “I like this ad” has got highest point in this situation. This result justifies the empirical research.
Table 17: Portuguese Consumers Picture 7 (BRU)
As BRU is not known brand to Portuguese people, so their reaction is not positive always. They have been irritated and annoyed more in this ad. They haven-t even strongly agreed with the fact that this brand is unfavourable because they don’t know it personally.
Table 18: Portuguese Consumers Picture 8 (DELTA)
On the contrary, table 18 shows that Portuguese people have reacted much in case of their known brand “DELTA”. They have remarked this brand as a good brand with highest point 5,7 and even they are ready to recommend this brand to others after watching this ad. Portuguese people have given highest points to this ad (picture 8).
10.3 Mean differences between Indian and Portuguese consumers
In case of defining different nationality’s stimuli also, we found (in table 19) that Indians have more pleasure than Portuguese; since Indian participants had statistically significant positive mean difference on measuring pleasure (mean difference = 0,33 / p<o,o5). On the other hand, the result of arousal is not statistically satisfactory, though Indians showed more effectiveness. (table 20)
Table 19: PLEASURE compared between Portuguese and Indians
Source: SPSS result from current research (Author)
Table 20: AROUSAL compared between Portuguese and Indians
Source: SPSS result from current research (Author)
The main difference between Indian and Portuguese consumers who filled up the questionnaire is the ratio of gender difference. This ration difference is not only because of the normal male-female ratio of both country, but it also reflects the tendency of their natural difference. Female form Portugal has responded 65.5%, whereas female voice from India has participated in questionnaire survey only 20.5%. In general, less Indians have responded compared to Portuguese young people. The frequency is 73:174.
In the following figures, we have drawn the mean of each country to show the difference between Portuguese and Indian cultural difference towards the same coffee advertisement.
Table 21: Mean differences between India and Portugal, Picture 1 (A cup that makes you a helping person)
Picture 1: A cup that makes you a helping person
Portuguese mean SD Indian mean SD Mean difference t df Sig. (2-tailed) Std. Error Difference Interval of lower Interval of upper Difference Significant or not significant This ad is interesting to me 3,35 1,68 4,14 1,82 -0,79 -3,17 125,87 0,00 0,25 -1,28 -0,30 significant This ad is enthusing 3,04 1,58 4,05 1,58 -1,01 -4,60 135,29 0,00 0,22 -1,45 -0,58 significant
I like this ad 3,27 1,70 4,15 1,67 -0,88 -3,75 137,69 0,00 0,23 -1,34 -0,42 significant This ad is exciting 2,79 1,59 4,11 1,71 -1,32 -5,63 127,27 0,00 0,23 -1,78 -0,86 significant I would recommend coffee to others after watching this ad 2,79 1,55 4,07 1,77 -1,28 -5,39 120,73 0,00 0,24 -1,75 -0,81 significant This ad is irritating 3,11 1,74 3,23 1,99 -0,12 -0,46 120,69 0,65 0,27 -0,65 0,41 not significant
I feel stimulated after watching this ad 2,82 1,63 3,34 1,67 -0,52 -2,26 132,46 0,03 0,23 -0,98 -0,06 significant This ad is very much annoying for me 3,32 1,85 2,66 1,87 0,66 2,55 135,25 0,01 0,26 0,15 1,18 significant I feel happy by watching this ad 2,94 1,44 3,95 1,73 -1,01 -4,38 115,99 0,00 0,23 -1,47 -0,55 significant I feel depress by watching this ad 2,88 1,74 2,81 1,88 0,07 0,27 126,33 0,78 0,26 -0,44 0,58 not significant
Figure 8: Mean difference between Portugal and India: Picture 1 0 0,51 1,52 2,53 3,54 4,5 Portuguese mean Indian mean
Source: Current study
When comparing the mean values between Portugal and India, it is possible to see that Indian respondents tend to be more connected to the statement presented in the ad than the Portuguese respondents, though this. Indian respondents seem to feel more interest, enthusing, exciting, stimulated; they are less annoyed and happier by watching the ad than the Portuguese students. On the other hand, Portuguese seem to feel that the ad is very much annoying for them. The first message was targeted mainly for Portuguese people, but the results tend to reveal the opposite of what was expected.
Table 22: Mean differences between India and Portugal, Picture 2 (A cup for a very exclusive person) Picture 2: A cup for a very exclusive person
Portuguese mean SD Indian mean SD Mean difference t df Sig. (2-tailed) Std. Error Difference Interval of lower Interval of upper Difference Significant or not significant I like this ad 3,90 1,64 3,74 1,74 ,16 ,68 128,48 ,50 ,24 -,31 ,64 not significant This ad is irritating 2,83 1,54 2,74 1,65 ,09 ,39 127,24 ,70 ,23 -,36 ,53 not significant This ad is really interesting to me 3,81 1,54 3,95 1,76 -,13 -,55 121,59 ,58 ,24 -,60 ,34 not significant This ad is enthusing 3,53 1,59 3,11 1,75 ,42 1,75 124,82 ,08 ,24 -,06 ,89 not significant I feel depress by watching this ad 2,63 1,59 3,26 1,98 -,63 -2,42 113,06 ,02 ,26 -1,15 -,11 significant I would recommend coffee to others 3,56 1,50 3,90 1,65 -,35 -1,54 124,50 ,13 ,22 -,79 ,10 not significant This ad is exciting 3,07 1,43 3,37 1,78 -,30 -1,39 243,00 ,16 ,22 -,72 ,12 not significant