Research Article 193
Modelling Through Artificial Neural Networks of the
Phenolic Compounds and Antioxidant Activity of Blueberries
Guiné, Raquel P.F.*
+CI&DETS, Polytechnic Institute of Viseu, Campus Politécnico, Viseu, Portugal; CITAB, University of Trás-Os-Montes, Vila Real, PORTUGAL
Gonçalves, Christophe; Matos, Susana
Dep. Food Industry, ESAV, Quinta da Alagoa, Viseu, PORTUGAL
Gonçalves, Fernando
CI&DETS, Polytechnic Institute of Viseu, Campus Politécnico, Viseu, PORTUGAL
Costa, Daniela V.T.A.
Dep. Ecology and Sustainable Agriculture, ESAV, Quinta da Alagoa, Viseu, PORTUGAL
Mendes, Mateus
Polytechnic Institute of Coimbra, ESTGOH, Oliveira do Hospital, Portugal; Institute of Systems and Robotics, FCTUC-DEEC, University of Coimbra, PORTUGAL
ABSTRACT: The present study aimed at investigating the influence of several production factors, conservation conditions, and extraction procedures on the phenolic compounds and antioxidant activity of blueberries from different cultivars. The experimental data was used to train artificial neural networks, using a feed-forward model, which gave information about the variables affecting the antioxidant activity and the concentration of phenolic compounds in blueberries. The ANN input variables were location, cultivar, the age of the bushes, the altitude of the farm, production mode, state, storage time, type of extract and order of extract, while the output variables were total phenolic compounds, tannins as well as ABTS and DPPH antioxidant activity. The ANN model was fairly good, with values of the correlation factor for the whole dataset varying from 0.948 to 0.979, while the values of mean squared error were ranging from 0.846 to 0.018, for DPPH antioxidant acidity and anthocyanins, respectively. The results obtained showed that the methanol extracts contained higher amounts of total phenols and anthocyanins as compared to acetone: water extracts, while presenting similar quantities of tannins in both extracts. The blueberries from organic farming were richer in phenolic compounds and possessed higher antioxidant activity than those from conventional agriculture. Even though the effect of storage was not established with high certainty, a trend was observed for an increase in the phenolic compounds and antioxidant activity along storage, either when under refrigeration or under freezing, for the storage periods evaluated.
KEYWORDS:Antioxidant activity; Artificial neural network; Blueberry; Conservation; Phenolic compounds.
* To whom correspondence should be addressed. +E-mail: [email protected]
194 Research Article INTRODUCTION
Blueberries are fruits of several Vaccinium sp. with a round shape and intense brightly-colored blue. They are rich in vitamin C, dietary fiber, and dietary minerals. They are mostly valued for their high content in polyphenols and are credited with the quality of having the highest antioxidant capacity among other fruits [1, 2]. According to FAOSTAT data, the five principal producers of blueberry in 2014 were, in decreasing order, United States of America (263 thousand tonnes), Canada (182 thousand tonnes), Mexico (18 thousand tonnes), Poland (13 thousand tonnes) and Germany (12 thousand tonnes). Portugal came in 21st, with 267 tonnes.
Regarding commercialization, blueberries represent an important economic trade. Americans are the world's largest consumers and import about 82% of the world's production. Although the United States is the largest producer of blueberries, they are not self-sufficient, except in May, June, and July, so they depend directly on the supply of other producing countries [3]. In Portugal, in 2013, according to FAOSTAT data, were imported 156 tonnes of blueberries and exported 168 tonnes, a similar quantity, representing 1630 thousand US dollars of import and export value. Nevertheless. the production is expected to be raised in the last years due to the plantation of many hectares of new production files of blueberry [4].
Blueberry fruits are a rich source of anthocyanins and have been recognized as one of the five major human healthy foods by the Food and Agriculture Organization (FAO) [2, 5, 6]. Anthocyanins are a class of phenolic compounds. They are water-soluble flavonoids responsible for the intense red and blue colorations in numerous fruits and flowers [7-10]. They originate from 18 anthocyanidins through the addition of sugar moieties, and they differ from each other by their degree of hydroxylation and methoxylation [11, 12]. Blueberries are recognized for their complex anthocyanin profiles as well as high total anthocyanin contents [11, 12]. More than 25 different anthocyanins have been reported in blueberries, which are mainly conjugated forms of malvidin, delphinidin, petunidin, and cyaniding [5]. However, other major phenolic compounds also present in blueberries include phenolic acids/esters, such as chlorogenic acid, as well as flavonols, proanthocyanidins, and stilbenes, although in lower quantities [2].
Phenolic compounds have great potential benefits for human health and may exert antioxidant, anti-inflammatory and anti-carcinogenic effects [13]. In particular, several studies have reported that blueberry anthocyanins, besides playing a fundamental role in maintaining human health, also have the potential to treat and prevent some diseases [5, 14].
The biosynthesis of some phytochemicals in fruits and vegetable results, to an important extent, from environmental interactions and agronomic practices [15]. It is well known that the antioxidant activity of blueberries is highly dependent on the phenolic profiles, particularly the contents in anthocyanin and total phenolic compounds, but also on genotype (cultivar and species), environmental conditions (climate, soil, water, sun exposure), maturity, and post-harvest storage conditions, among other factors [1, 13].
Conventional agriculture is recognized as useful in providing the production of large quantities of food to meet global needs, However, because it makes use of large amounts of fertilizers and plant protection products, it has a negative impact in the environment and contributes for the degradation of ecosystems, thus posing a serious threat to the quality of life of all living beings. In contrast, organic farming practices integrate a set of agricultural techniques for the rational use of the system formed by the climate-water- soil microorganisms -plant. In this way, it allows preserving the balance of agricultural ecosystems making them sustainable in the long term. This production mode excludes almost all synthetic chemicals (fertilizers and pesticides), seeks to harmonize the agricultural practices with natural balances and the increased use of renewable inputs [16].
Perishable foods, like blueberries, need to be stored inadequate conditions to extend their shelf life. However, a considerable number of physicochemical changes occur during storage, and these can substantially affect the quality of the berries, leading to senescence and eventual deterioration. The storage time, as well as the time needed to transport the blueberries, is limited due to loss of moisture and to the action of fungi. The quality and shelf life of blueberries are deeply related to their soluble solids content, acidity, and ratio of soluble solids to acidity. The blueberries are stored under refrigeration at temperatures between 2 and 4 °C and 85 to 90% relative humidity [17-19].
Research Article 195 An Artificial Neural Network (ANN) is
an interconnected association of artificial neurons. The input for each neuron can be one or more variables. The value of each input is multiplied by a corresponding weight and possibly summed to a bias value. The output of each neuron is, therefore, a function of the weighted inputs. Neurons learn by adjusting the weights of the input variables, in a way that the error between the neuron’s expected output and the measured output value is minimized [20]. The weights learned by the neural network during training are an indication of the relevance of each variable for the output. The analysis of the weights, therefore, gives a wealth of information about the contribution of each input to the final output. This method is useful as a data mining technique for finding patterns and correlations in some types of datasets, such as the present laboratory experiments.
Artificial Neural Networks (ANN) have been used for modeling diverse engineering processes in the food industry and agriculture as well as for the quantification of phenolic compounds. Tao et al. [21] performed an optimization of anthocyanin powder properties using ANN coupled with a genetic algorithm. Simić et al. [22] modeled the microwave-assisted extraction of total polyphenolic compounds from chokeberries by ANN. Guiné et al. [23] used ANN modeling for the antioxidant activity and phenolic compounds in bananas submitted to different drying treatments. Santos et al. [24] performed the simultaneous determination of thirteen phenolic compounds in guava and also used ANN modeling.
The present study was undertaken to investigate the influence of several production factors (production mode: organic, conventional; geographical origin; altitude of the farm; age of the bushes) as well as conservation conditions (room temperature, refrigeration, freezing) and extraction procedures on the phenolic compounds and antioxidant activity of blueberries from three cultivars (Duke, Bluecrop, Ozarkblue). The study was complemented with artificial neural network modeling of the factors affecting the antioxidant activity and the concentration of phenolic compounds.
EXPERIMENTAL SECTION
Sampling
In the present work, three varieties of Northern Highbush blueberries were studied (Duke – DK,
Bluecrop – BC, Ozarkblue – OZ), obtained from Conventional Production (CP) and Organic Farming (OF). The samples were harvested in farms situated in the North-Centre of Portugal (Braga – BR, Estarreja – ES, Oliveira do Hospital – OH, Sever do Vouga – SV and Vouzela - VZ). Table 1 shows the altitude where the farms were located as well as the age of the bushes. The fruits were harvested at full maturity, i.e., the same maturity stage at which the berries are normally marketed, corresponding to complete colour development and without loss of turgor. For each cultivar approximately 1 kg of berries was collected, selected randomly from several plants in different parts of the same field.
Handling and conservation
Right after harvesting, the samples were transported to the laboratory in appropriate plastic cuvettes protected from light and heat. The evaluation of the blueberries’ properties was made in the fresh samples and also in the stored samples. The samples were kept at room temperature (around 15 to 25 ºC and 30 to 60% RH) or under refrigeration (temperature of 4 ºC and 85 to 90% relative humidity) for 7 and 14 days. Additionally, some samples were frozen for a period of 6 months.
Extraction procedure
The phenolic compounds were extracted from a sample with 5 g obtained from the grounded blueberries. The extraction procedure consisted of four successive extraction steps performed on the same sample, firstly twice with methanol and then twice with an aqueous solution of acetone (60%, v:v).
In each case, the sample was left in contact with the extraction media for 1 hour in an ultrasonic bath at room temperature [23]. The extracts obtained were then used to quantify the phenolic composition and the antioxidant activity.
Analysis of total phenolic compounds
The total phenolic content in the fruit extracts was determined by the Folin-Ciocalteu reagent, adapting the conditions described by Gonçalves et al. [25] and Guiné et al. [26]. Each sample (0.125 mL) was added to 0.75 mL of deionized water and 0.125 mL of Folin-Ciocalteu reagent. After 6 min, 2 mL of a 5 % (m:v) solution of sodium carbonate was added and the mixture
196 Research Article
Table 1: Characteristics of the farms from where the blueberries were obtained.
Location of the farm Altitude of placement (m) Age of the bushes (years)
Sever do Vouga (Conventional production) 460 20
Sever do Vouga (Organic farming) 525 20
Estarreja 45 4
Oliveira do Hospital 510 21
Vouzela 450 4
Braga 125 28
was left 90 min at room temperature in the dark. A calibration curve was made with standard solutions of gallic acid and the absorbance was measured in a spectrophotometer at a wavelength of 760 nm. All analyses were done in triplicate. The results were expressed as milligrams of Gallic Acid Equivalents (GAE) per gram of fresh sample.
Analysis of total anthocyanins
Total anthocyanins were determined by adaptation of the method described by Boulton [27]. Each sample (100 L) was placed in a 5 mL dilution flask, filling with a solution previously prepared by adding 1 mL HCl, 70 mL ethanol and 30 mL distilled water. After homogenization, the absorbance was measured at 540 nm, in triplicate. The results were expressed as milligrams of Malvidin-3-Glucoside Equivalents (MvGE) per gram of fresh sample.
Analysis of total tannins
Total tannins were estimated by a modification of the method described by Ribereau-Gayon and Stonestreet [28]. Initially a standard solution in a 500 mL flask composed of 200 mL of HCl, 200 mL of butanol and 60 mg of iron sulphate hexahydrate was prepared. Then, 100 L of the sample were taken into a 5 mL dilution flask which was completed with distilled water, and then homogenized. 2 mL of this solution were then placed in a test tube and added to 6 mL of the standard solution, which was capped and shaken gently. The content was divided into two tubes. One of them was heated for 30 min in boiled water and cooled, while the other one stayed in the dark at room temperature. The absorbance was read at 540 nm for each tube. The measurements were done in triplicate and the results were expressed as milligrams per gram of fresh sample.
Determination of antioxidant activity
The antioxidant activity was determined by the methods using the free radicals 2,2-Diphenyl-1-picrylhydrazyl (DPPH*) and 2,2'-azino-bis(3-ethylbenzthiazoline-6-sulphonic acid) ABTS, respectively described by Brand-Williams et al. [29] and Miller et al. [30], subject to adaptations. The results were based on the percentage of inhibition of each fruit, compared to a standard antioxidant (Trolox) in a dose-response curve is expressed in mol of Trolox equivalents (TE) per gram of fresh sample.
In the first method, 100 L of the sample and 2 mL of DPPH previously prepared with methanol were added to a tube, which was then placed in the dark at room temperature for 30 minutes. After that, the absorbance was measured at 515 nm. The analysis was performed in triplicate.
In the second method, 100 L of sample were combined with 2 ml of ABTS in a tube, previously prepared [26], and again the samples were placed in the dark at room temperature, this time for 15 minutes. Afterward, the absorbance was read at 734 nm. Three repetitions were also carried out in each sample.
Artificial neural network modeling
Architecture of the ANN used
The ANN used was a feed-forward model, created using Matlab™ fitnet function. The fitnet function is optimized for data fitting of datasets such as the ones used in the present work. A hyperbolic tangent sigmoidal transfer function, which is a universal approximator, symmetric and centered, was used in the hidden layer. A linear transfer function was used in the output layer. Training was performed using the Levenberg-Marquartd method. The Mean Squared Error (MSE) method
Research Article 197
Fig. 1: Architecture of an artificial neural network with 21 input variables, one hidden layer, one output layer and one output variable.
was used for performance assessment, as in fitnet function default configuration. Performance of the models was also assessed calculating the correlation factor between values predicted by the neural networks and the values measured in the laboratory.
The ANN input variables were location, cultivar, age of the bushes, the altitude of the farm, production mode, state, storage time, type of extract and order of extract, while the output variables were total phenolic compounds, tannins as well as ABTS and DPPH antioxidant activity.
For simplicity of the analysis, each output variable was analyzed separately. An ANN model was created for predicting each output variable. All ANNs had just two neurons: one in the hidden layer, one in the output layer. Hence, the number of weights to analyze for each output variable was equal to the number of input variables, which are inputs to the first neuron, plus 1 weight which is the input to the output neuron. Those models are both powerful for data fitting and simple for data mining. Fig. 1 illustrates the architecture of one ANN used.
Characterization of the datasets and variables
Since neural networks are based on inductive reasoning, in general, more samples produce better models and more confidence in the results. In the present work, the dataset contained 252 valid experimental results for Tannins and 312 valid experimental results for the other variables. For each run, the Matlab script randomly selected approximately 70 % of the samples for the training subset, 15 % for the validation subset and the remaining samples were used for the test subset.
Table 2 summarises the input variables, which were split into a total of 21 variables for better neural network fitting and analysis. Age of the bushes, altitude of the farm and storage time were floating point numbers normalized in the interval [0, 1]. All the other variables were Boolean.
The result of the learning process depends on some random values. Namely, the convergence of the model can be faster, slower or totally impaired depending on the initial weights and bias of each neural connection, as well as the subset of samples selected for training, testing, and validation. Therefore, the final results obtained usually differ between experiments, because the starting point and data may also differ.
The best neural network models will produce the best correlations between values predicted by the neural network and the experimental values measured in the laboratory. In the present work, the performance of the models is measured using the correlation factor (R) and MSE.
For better confidence in the analysis, different experiments were performed in the present study. For each output variable, thirty different models were created. The results were sorted by the correlation factor R, from best to worst. The five best models were then selected for further analysis.
The neurons’ input weights can be positive or negative. A positive weight means that the input variable contributes more to the output of that neuron. In a network with two neurons, if the second neuron also receives a negative weight, that inverts the result which comes from the first layer. Therefore, in the present analysis, the signals of the input weights were mirrored when the weight of the second neuron was negative. The weights were also normalized in the interval [-1, 1]. The results shown are the average of the 5 best models, after this post-processing.
RESULTS AND DISCUSSION
Phenolic compounds
The total phenolic compounds, total anthocyanins and total tannins evaluated in the samples of blueberry cv. Buecrop at harvest are presented in Table 3, considering the different extractions. The results show that in all cases
198 Research Article
Table 2: Encoding of the input variables.
Input # Input Variable Description
1-5 SV, ES, OH, VZ, BR Location (Sever do Vouga, Estarreja, Oliveira do Hospital, Vouzela, Braga)
6-8 BC, DK, OZ Cultivar (Bluecrop, Duke, Ozarkblue)
9 A Age of the bushes normalized into [0, 1]
10 H Altitude of the farm normalized into [0, 1]
11-12 CP-OF Production mode (Conventional production, Organic farming)
13-15 FR, REF, FROZ State (Fresh, Refrigerated, Frozen)
16 ST Storage time normalised into [0, 1]
17-19 NE, ME, AC Type of extract used (No extract, Methanol, Acetone)
20-21 O1, O2 Order of the extract (First, Second)
Table3: Phenolic compounds of the blueberries from cultivar Bluecrop at harvest produced in conventional agriculture according to extraction conditions.
Production1 Extraction2 Phenolic compounds3
Origin Solvent Order Total phenols (mg/g GAE) Anthocyanins (mg/g MvGE) Tannins (mg/g)
ES ME 1 3.27±0.32 0.85±0.00 1.62±0.10 ME 2 0.55±0.03 0.07±0.00 0.19±0.05 AW 1 0.99±0.05 0.01±0.00 1.49±0.05 AW 2 0.37±0.01 0.00±0.00 0.23±0.01 OH ME 1 1.40±0.10 0.48±0.05 0.68±0.09 ME 2 0.37±0.01 0.05±0.00 0.12±0.01 AW 1 0.96±0.15 0.02±0.00 0.87±0.06 AW 2 0.33±0.01 0.00±0.00 0.15±0.08 VZ ME 1 3.76±0.22 0.52±0.00 1.06±0.06 ME 2 0.55±0.02 0.05±0.00 0.07±0.06 AW 1 1.12±0.12 0.02±0.00 1.07±0.02 AW 2 0.43±0.03 0.00±0.00 0.15±0.04 BR ME 1 2.58±0.19 0.69±0.01 1.06±0.09 ME 2 0.53±0.04 0.09±0.00 0.15±0.06 AW 1 0.92±0.12 0.02±0.00 0.83±0.09 AW 2 0.37±0.01 0.00±0.00 0.27±0.08 SV ME 1 2.83±0.83 0.83±0.00 1.16±0.09 ME 2 0.55±0.02 0.10±0.00 0.25±0.09 AW 1 1.00±0.11 0.03±0.00 1.38±0.22 AW 2 0.42±0.01 0.01±0.00 0.29±0.02
1) Origin: BR – Braga, ES – Estarreja, OH – Oliveira do Hospital, SV – Sever do Vouga, VZ – Vouzela; Cultivar: BC – Bbuecrop, DK – Duke, OZ – Ozarkblue.
2) Solvent: ME – Methanol, AW – Acetone/Water.
Research Article 199
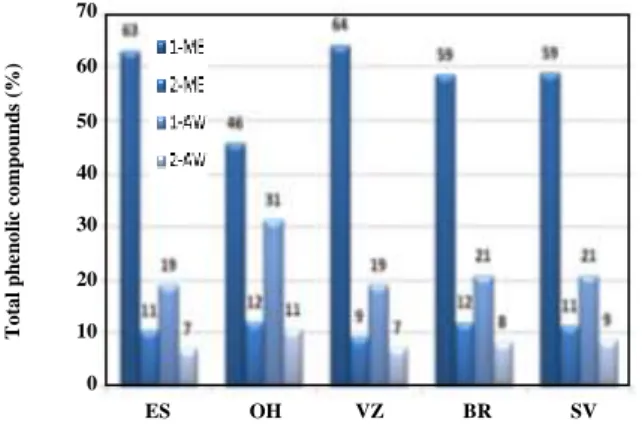
Fig. 2: Relative percentage of phenolic compounds of the blueberries from cultivar Bluecrop at harvest produced in conventional agriculture according to type and order of extract.
the highest amount of phenolic compounds was quantified in the first extraction with methanol, varying from 1.40 to 3.76 mg/g GAE, respectively for the samples from Oliveira do Hospital and Vouzela. The second more efficient extraction was the first performed with the aqueous solution of acetone, with values ranging from 0.92 to 1.12 mg/g GAE, respectively for the samples from Braga and Vouzela. Regarding the anthocyanins’ contents, it was observed that they were mostly obtained in the first extraction with methanol, and in the following three extracts, the contents were much lower. In the first methanol extract the total anthocyanins varied from 0.48 to 0.85 mg/g MvGE, while in the other three extracts the sum varied from 0.07 to 0.14 mg/g MvGE (Table 3). As for the tannins’ contents, a similar trend was observed as that described earlier for total phenols, meaning that the first methanol extract contained higher amounts of tannins followed by the first acetone: water extract. In the first methanol extract the concentration of tannins ranged from 0.68 to 1.62 mg/g, respectively for the samples from Oliveira do Hospital and Estarreja, while in the first acetone: water extract the concentration varied from 0.83 mg/g in the sample from Braga to 1.49 mg/g in the sample from Estarreja.
Fig. 2 shows the percentage of total phenolic compounds quantified in the four different extracts. It is possible to perceive that in fact, the first methanol extraction recovers a very high fraction of the total extracted phenolic compounds, with percentages varying from 46% to 64%. Next comes the first acetone: water
extract, with recovering percentages ranging from 19% to 21%. The second methanol and acetone: water extracts together accounted for percentages varying in the range 16-23%. These results show that, although most of the compounds were effectively recovered in the first extraction, the first extraction alone would account for an insufficient amount of the phenolics present in the blueberries. In fact, even the second extractions (with both types of solvent) assume some importance, recovering on average about 20% of the phenolic compounds. This is indicative of the adequacy of the procedure adopted, consisting in successive extractions with each of the solvents used.
The results in Fig. 2 further show that methanol was more efficient in extracting the phenolic compounds than the acetone: water solution, with percentages (considering the two extractions) ranging from 58% to 74% and from 26% to 42%, respectively. The phenolic compounds possess a polar part, constituted by one or more hydroxyl groups, which is attached to a nonpolar part, the aromatic ring. This structure allows distinguishing phenols according to their polarity, which naturally influences the efficiency of their extraction depending on the nature of the solvent used [31].
Although the type of solvent is not the only variable affecting the extraction yield of phenols, it determines the amount as well as the type of compounds recovered. While methanol is widely recognized as very efficient for the extraction of lower molecular weight polyphenols, the higher molecular weight compounds are better extracted with aqueous acetone [23]. This could be confirmed in the present work, since anthocyanins were mostly extracted with methanol (96% to 99%) (Fig. 3 (a)) while the tannins were evenly recovered with methanol or acetone:water, with just a weak trend for higher values in the case of acetone:water extracts (with percentages of 49%, 56%, 51%, 48% and 54%, respectively for the origins ES, OH, VZ, BR and SV) (Fig. 3 (b)).
Table 4 shows the global contents of phenolic compounds, anthocyanins and tannins of all blueberry samples, as determined by summing the amounts quantified in the four extracts. Regarding the total phenolic compounds content, for the samples at harvest, it was found to vary from 3.06 to 6.13 mg/g GAE for the samples cv. Bluecrop (Oliveira do Hospital) and cv. Duke (Sever do Vouga), respectively, in the case of ES OH VZ BR SV 70 60 50 40 30 20 10 0 T ot al p h e n oli c com p ou n d s (% )
200 Research Article
Fig. 3: Relative percentage of anthocyanins (a) and tannins (b) in the blueberries from cultivar Bluecrop at harvest produced in conventional agriculture according to type and order of extract.
the blueberries produced in conventional agriculture. The work by Kampuse et al. [32] reported total phenolic contents between 2.26 and 3.81 mg/g fresh weight, depending on the cultivar.
Howard et al. [33], Moyer et al. [34] and Gündüz et al. [35] reported values for total phenols of 3.24, 3.04 and 1.44 mg/g GAE, respectively for blueberries cv. Bluecrop, which are slightly lower than those found in the present study for that cultivar (3.06 – 5.85 mg/g GAE). These differences may reflect the production system, environmental conditions or the state of maturation of the fruit at harvest [36]. Moreover, Dragovic-Uzelac et al. [37] found significant differences between two consecutive harvesting years for the total phenolic compounds contents in blueberries cv, Bluecrop (3.68 and 2.92 mg/g GAE). This demonstrates the relevance of climatic factors, among others, in the phenolic composition of blueberries. The intensity of UV radiation may also be a factor capable of influencing the phenolic composition, even causing an increase of these compounds [38]. Another possible explanation for the wide range of values obtained for the same cultivar may be the daily temperature range, or the difference between the minimum and maximum temperatures during the day, which can influence significantly the production of phenolic compounds [39].
For the blueberries originating from organic farming, the total phenolic contents at harvest were higher than for conventional agriculture, varying in the range from 6.76 to 8.22 mg/g GAE, respectively for the samples cv. Ozarkblue and Duke, both from Sever do Vouga (Table 4).
It has been postulated that fruits and vegetables from organic farming have higher levels of bioactive compounds, including phenolic compounds, with antioxidant activity, when compared to their conventionally produced equivalents [40]. This is because in the absence of chemicals the plants are subject to higher levels of stress and therefore synthesize higher amounts of these compounds as a defense mechanism. You et al. [41] reported higher total phenolic contents for blueberries cv. Power Blue in organic farming (3.38 mg/g GAE) when compared to conventional agriculture (3.00 mg/g GAE). Wang et al. [42] observed for blueberries cv. Bluecrop from organic farming values of total phenols almost twice as higher than those of the blueberries cultivated in conventional mode: 3.19 and 1.90 mg/g GAE (wet basis), respectively.
For the blueberries cv. Bluecrop stored under freezing for 6 months, some changes were observed in the total phenolic compounds contents but the variations were towards increasing in some cases and decreasing in others (Table 4). The highest increase was observed for the berries from Estarreja (+14%) while the highest decrease was for the berries from Vouzela (-22%). In the case of the samples from Oliveira do Hospital and Sever do Vouga the changes were minimal (3% and 1%, respectively). Yuan et al. [43] reported a decrease in the total phenols contents for several blueberry cultivars stored under freezing for a period of two weeks.
As for the storage under refrigeration, the variations were also dependent on the sample, with no clear trend common to all samples evaluated. After 14 days under ES OH VZ BR SV 100 90 80 70 60 50 40 30 20 10 0 Ant h oc yu a n in s (% ) ES OH VZ BR SV 70 60 50 40 30 20 10 0 T an n in s (%)
Research Article 201
Table 4: Phenolic compounds (global in the 4 extracts) of the blueberries according to production and storage conditions.
Production1 Storage2 Sum of phenolic compounds3
Origin Cultivar Mode Type Time
(days) Total phenols (mg/g GAE) Anthocyanins (mg/g MvGE) Tannins (mg/g) ES BC CP Harv 0 5.18±0.29 0.93±0.00 3.53±0.17 ES BC CP Froz 180 5.92±1.03 n.d. 2.60±0.73 OH BC CP Harv 0 3.06±0.24 0.54±0.05 1.82±0.18 OH BC CP Froz 180 3.15±0.04 n.d. 3.90±0.09 VZ BC CP Harv 0 5.85±0.38 0.60±0.01 2.35±0.08 VZ BC CP Froz 180 4.51±0.22 n.d. 5.82±0.10 BR BC CP Harv 0 4.39±0.06 0.80±0.01 2.31±0.07 BR BC CP Froz 180 3.79±0.12 n.d. 5.10±0.27 SV BC CP Harv 0 4.80±0.34 0.96±0.01 3.07±0.32 SV BC CP Froz 180 4.87±0.18 n.d. 2.50±0.05 SV BC OF Harv 0 5.24±0.05 1.52±0.01 2.31±0.16 SV DK CP Harv 0 6.13±0.37 1.87±0.11 1.38±0.20 SV DK CP Room 7 5.81±0.15 2.21±0.03 1.74±0.28 SV DK CP Room 14 7.56±0.25 2.96±0.06 2.00±0.41 SV DK CP Ref 7 6.83±0.26 2.37±0.03 1.20±0.11 SV DK CP Ref 14 5.52±0.14 1.56±0.03 2.59±0.59 SV DK OF Harv 0 8.22±0.19 2.78±0.02 3.81±0.68 SV DK OF Ref 7 8.11±0.18 2.99±0.13 5.07±0.49 SV DK OF Ref 14 8.19±0.17 3.09±0.04 1.56±0.20 SV OZ CP Harv 0 6.13±0.30 1.61±0.08 2.05±0.07 SV OZ CP Ref 7 8.00±0.39 1.82±0.04 2.79±0.32 SV OZ CP Ref 14 7.58±0.28 1.80±0.08 1.87±0.27 SV OZ OF Harv 0 6.76±0.39 1.77±0.07 3.17±0.06 SV OZ OF Ref 7 6.22±0.06 1.05±0.02 2.30±0.11 SV OZ OF Ref 14 6.85±0.31 1.14±0.05 3.19±0.10
1) Origin: BR – Braga, ES – Estarreja, OH – Oliveira do Hospital, SV – Sever do Vouga, VZ – Vouzela; Cultivar: BC – Bbuecrop, DK – Duke, OZ – Ozarkblue.
2) Storage: Harv – at harvest, Room – at room temperature, Ref – under refrigeration, Froz – frozen. 3) GAE – Gallic acid equivalents, MvGE –Malvidin-3-glucoside equivalents, n.d. – not detected. refrigeration, the sample cv. Duke from Sever does Vouga in
conventional production mode decreased its phenols content by 10%, while the same sample from organic farming did not change its total phenolic compounds content (Table 4). Yuan et al. [43] reported a decrease in the total phenols for several blueberry cultivars stored under refrigeration for the same period of 14 days.
The anthocyanins contents of the blueberry samples at harvest varied from 0.54 to 1.61 mg/g MvGE for the samples originating from conventional agriculture and from 1.77 to 2.78 mg/g MvGE for the samples originating from organic farming (Table 4). You et al. [41] also reported higher amounts of anthocyanins for blueberries cv. Power Blue in organic farming
202 Research Article (1.52 mg/g) when compared to conventional agriculture
(1.40 mg/g). The contents of total anthocyanins found in this work were lower than those reported by Rocha [44] (5.89 mg/g MvGE). However, they were higher than those reported by Wang et al. [45] and Gavrilova et al. [46] for cv. Bluecrop: 0.20 and 0.41 mg/g MvGE, respectively. The contents of anthocyanins in the different extracts vary according to the type of solvent, temperature, extraction time and type and temperature of storage [47]. The anthocyanins’ content was also determined for the samples frozen for 6 months. However, in all samples, the anthocyanin content was below the limit of quantification, hence allowing concluding that freezing drastically reduced the anthocyanins content (Table 4). These results do not agree with those reported by Oancea et al. [47], according to which there was an increase in anthocyanins after 3, 16 and 24 weeks of storage at -18 ºC. For the sample cv. Duke from Sever do Vouga and conventional agriculture stored at room temperature for two weeks, a pronounced increase was observed in the anthocyanins content (+58%). However, for the same sample stored for the same period of two weeks under refrigeration a decrease was registered (-17%).
Total tannins were found to vary from 1.38 to 3.53 mg/g at harvest, depending on the cultivar and place of production, for the blueberries produced in conventional mode. However, for those produced in organic farming, the range of variation was from 2.31 to 3.81 mg/g, also varying according to the place of harvest and cultivar (Table 4). Again, the effect of storage, either under refrigeration or freezing, did not reveal a consistent trend of variation. However, for the sample stored at room temperature the tannins content increased, as it happened for total phenols or anthocyanins.
Antioxidant activity
Table 5 shows the antioxidant activity determined by the DPPH and ABTS methods for the samples cv. Bluecrop from conventional agriculture at harvest, considering the different extractions performed. The highest value was consistently obtained for the first methanol extract, followed by the first acetone: water extract, regardless of the method used to quantify antioxidant activity. This is in agreement with the results observed for total phenolic compounds. The results
further show that both methods gave similar results. Nevertheless, the antioxidant activity quantified by the ABTS method was slightly higher when compared to that of the DPPH method, for all extracts.
Fig. 4 reveals that the methanol extracts account for 82-87% of the total antioxidant activity of the blueberries cv. Bluecrop in the case of the ABTS method (Fig. 4 (a)) and a similar range (80-89%) in the case of the DPPH method (Fig. 4 (b)). Hence, it was observed that the antioxidant activity varied according to the type of solvent used for the extraction of the phenolic compounds. On one hand, this is because in the methanol extracts higher concentrations of phenolic compound were found, and these compounds directly contribute to the antioxidant potential of the samples [26]. On the other hand, the antioxidant activity of phenols depends on their conformational chemical structure, and particularly on the ability to donate a hydrogen atom or an electron as well as on the abilityto delocalise the unpaired electron within the aromatic structure. In this way, procyanidins exhibit higher antioxidant capacity when the oxidizing agent is the free radical ABTS [23].
Table 6 presents the total antioxidant activity for all samples studied at harvest and after storage under different conditions. At harvest, for the samples produced in conventional agriculture, the lowest antioxidant activity by ABTS method was found for sample cv. Bluecrop from Oliveira do Hospital (2.56 µmol TE/g) and the highest for sample cv. Ozarkblue from Sever do Vouga (6.59 µmol TE/g). As for the samples produced in organic farming, the values were much higher, ranging from 5.69 to 12.44 µmol TE/g, for the same method. The results for DPPH method showed a range of variation from 1.03 to 7.07 µmol TE/g for conventional agriculture samples and from 6.13 to 15.35 µmol TE/g for organic farming samples, with a perfect correspondence in terms of samples, thus confirming the reliability of the results obtained by both methods. Hence, in general, higher antioxidant activity was obtained with the ABTS method when compared to the DPPH method. The same trend was described by Thaipong et al. [48], when evaluating the antioxidant activity of guava by the same methods. Rodrigues et al. [49] reported for blueberries values of antioxidant activity by the ABTS method between 12.3 and 24.4 µmol TE/g while Jablonska-Rys et al. [50] obtained 16.8 µmol TE/g, being in both cases higher than
Research Article 203
Table 5: Antioxidant activity of the blueberries from cultivar Bluecrop at harvest produced in conventional agriculture, according to extraction conditions.
Production1 Extraction2 Antioxidant activity3
Origin Solvent Order ABTS (µmol TE/g) DPPH (µmol TE/g)
ES ME 1 2.76±0.12 2.12±0.14 ME 2 0.41±0.02 0.17±0.01 AW 1 0.97±0.01 0.59±0.11 AW 2 0.20±0.01 0.15±0.01 OH ME 1 1.37±0.10 0.53±0.04 ME 2 0.24±0.02 0.05±0.01 AW 1 0.72±0.02 0.38±0.05 AW 2 0.23±0.05 0.08±0.02 VZ ME 1 2.20±0.13 1.88±0.52 ME 2 0.34±0.03 0.18±0.02 AW 1 0.87±0.00 0.88±0.06 AW 2 0.16±0.03 0.21±0.03 BR ME 1 1.82±0.07 0.94±0.05 ME 2 0.29±0.02 0.22±0.01 AW 1 0.70±0.02 0.63±0.11 AW 2 0.09±0.04 0.18±0.00 SV ME 1 2.39±0.12 1.91±0.37 ME 2 0.42±0.04 0.27±0.02 AW 1 0.93±0.04 0.59±0.02 AW 2 0.22±0.02 0.23±0.02
1) Origin: BR – Braga, ES – Estarreja, OH – Oliveira do Hospital, SV – Sever do Vouga, VZ – Vouzela; Cultivar: BC – Bluecrop, DK – Duke, OZ – Ozarkblue.
2) Solvent: ME – Methanol, AW – Acetone/Water. 3) TE: trolox equivalent.
Fig. 4: Relative percentage of antioxidant activity by ABTS (a) and DPPH (b) in the blueberries from cultivar Bluecrop at harvest produced in conventional agriculture according to extraction solvent.
ES OH VZ BR SV 100 90 80 70 60 50 40 30 20 10 0 Ant io xid a n t ac tivi ty AB T S (% ) ES OH VZ BR SV Ant io xid a n t ac tivi ty D P P H (% ) 100 90 80 70 60 50 40 30 20 10 0
204 Research Article
Table 6: Antioxidant activity (global in the 4 extracts) of the blueberries according to production and storage conditions.
Production1 Storage2 Sum of antioxidant activity
Origin Cultivar Mode Type Time (days) ABTS (µmol trolox/g) DPPH (µmol trolox/g)
ES BC CP Harv 0 4.34±0.14 3.03±0.09 ES BC CP Froz 180 5.18±0.26 3.92±0.06 OH BC CP Harv 0 2.56±0.16 1.03±0.07 OH BC CP Froz 180 3.21±0.22 2.76±0.10 VZ BC CP Harv 0 3.57±0.16 3.15±0.55 VZ BC CP Froz 180 5.62±0.14 4.25±0.09 BR BC CP Harv 0 2.90±0.08 1.96±0.04 BR BC CP Froz 180 3.93±0.21 2.71±0.14 SV BC CP Harv 0 3.97±0.17 3.01±0.37 SV BC CP Froz 180 4.98±0.29 3.81±0.08 SV BC OF Harv 0 10.12±0.39 10.76±0.87 SV DK CP Harv 0 5.74±0.18 6.58±0.52 SV DK CP Room 7 6.99±0.21 7.05±0.77 SV DK CP Room 14 9.68±0.53 11.05±1.03 SV DK CP Ref 7 9.41±0.12 9.08±0.54 SV DK CP Ref 14 4.04±0.09 7.81±0.98 SV DK OF Harv 0 12.44±0.44 15.35±0.90 SV DK OF Ref 7 9.60±0.45 9.09±0.13 SV DK OF Ref 14 9.76±0.26 9.39±0.94 SV OZ CP Harv 0 6.59±0.74 7.07±0.64 SV OZ CP Ref 7 10.05±0.50 13.21±0.08 SV OZ CP Ref 14 9.70±0.35 9.17±0.33 SV OZ OF Harv 0 5.69±0.34 6.13±0.55 SV OZ OF Ref 7 8.63±0.26 11.73±0.60 SV OZ OF Ref 14 9.07±0.12 8.97±0.66
1) Origin: BR – Braga, ES – Estarreja, OH – Oliveira do Hospital, SV – Sever do Vouga, VZ – Vouzela; Cultivar: BC – Bluecrop, DK – Duke, OZ – Ozarkblue.
Research Article 205
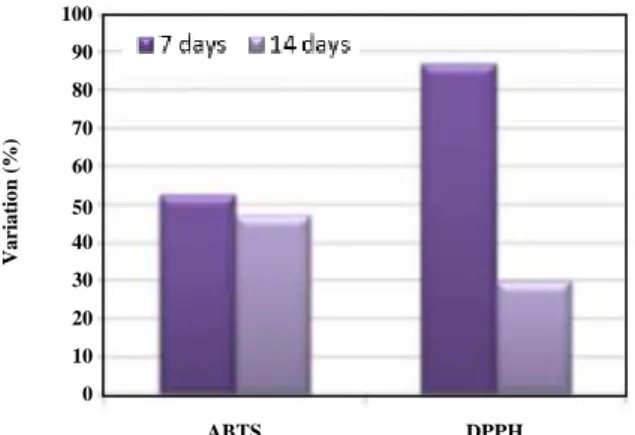
Fig. 5: Variation of antioxidant activity by ABTS (a) and DPPH (b) methods in the blueberries from cultivar Ozarkblue along 14 days of refrigeration, considering the fresh sample as reference.
Fig. 6: Variation of antioxidant activity by ABTS (a) and DPPH (b) methods in the blueberries from cultivar bluecrop from different origins after 180 days under freezing, considering the fresh sample as reference (Origin: BR – Braga, ES – Estarreja, OH – Oliveira do Hospital, SV – Sever do Vouga, VZ – Vouzela).
the values found in the present study. Buran et al. [51] reported values of antioxidant activity in blueberries evaluated by DPPH method of 24.4-26.6 µmol TE/g, also higher than the values found in this study.
Fig. 5 represents the effect of 14 days of refrigeration in the antioxidant activity of blueberries from cultivar Ozarkblue. Although the results obtained with the ABTS method showed very similar values after 7 or 14 days, corresponding to an increase of about 50% in relation to the fresh sample, the results for the DPPH method
were not so consistent, and the increase observed after 7 days was much higher than after 14 days. Still, in both cases it is apparent that a longer storage period might induce the reduction of the antioxidant activity. Zhou et al. [52] reported a consistent increase in the oxygen reactive species of blueberries from cultivar LanFeng when stored under refrigeration (at 0ºC) up to 60 days.
The graph in Fig. 6 represents the variation in antioxidant activity of the blueberries from cultivar Bluecrop after 6 months of freezing. The results indicate that in all cases the antioxidant activity of the different samples increased with storage, and the results of both methods of determination were quite similar, just with the exception of the sample from Oliveira do Hospital, for which there was an incredibly high value for the DPPH method in comparison to ABTS. Reque et al. [53] reported the increase in the antioxidant activity obtained by the ABTS of blueberries of unspecified cultivar when frozen for 6 months, being the increase equal to 35%. According to these authors, the variation of antioxidant activity values of frozen fruits could be explained by reactions that occur after harvesting forming compounds responsible for its increase, or by cell disruption caused by icing at the time of analysis, improving extraction of compounds that contribute to the antioxidant activity the blueberries.
But, on the contrary, for the DPPH antioxidant activity, the same storage time induced a decrease of 35% [53]. Also, Srivastava et al. [54] reported a slight decrease in the antioxidant activity of extracts from two blueberry cultivars, when stored for 60 days at -20 ºC. This decrease was 2.0% for cv. Tifblue and 5.4% for cv. Powderblue, and the method of determination was ABTS.
ANN modeling
Experimental results
Table 7 summarizes some performance parameters of the models. The correlation factors between experimentally measured outputs and the output predicted by the neural networks are in general greater than 0.93 for the whole dataset. The only exception is for tannins, where R is 0.688 for all dataset. Therefore, the confidence in any conclusions for tannins is lower than for the other output variables. The Mean Squared Errors are, in general, very low, even for tannins. Hence, the models produced are reliable for the dataset and analysis of the input weights should give useful information about the relevance of each input to each output. 100 90 80 70 60 50 40 30 20 10 0 ABTS DPPH Var iat io n ( % ) 180 160 140 120 100 80 60 40 20 0 ES OH VZ BR SV Var iat io n ( % ) Origin
206 Research Article
Table 7: Performance of the ANN models produced, assessed as correlation factor R and MSE. The table also shows the average epochs of train.
R
MSE
Train subset Test subset Validation subset All dataset epochs Train
Phenolic Compounds 0.977 0.974 0.973 0.975 12.3 0.104
Anthocyanins 0.980 0.968 0.979 0.975 25.8 0.018
Tannins 0.702 0.673 0.667 0.688 15.4 0.202
ABTS 0.965 0.961 0.961 0.963 16.3 0.472
DPPH 0.934 0.936 0.948 0.933 17.2 0.846
Table 8 shows the weights measured for each input variable, normalized in the interval [-1, 1] to facilitate the analysis. The sign of a weight is important to show whether the corresponding variable influences the result positively or negatively. The absolute value predicts how important the variable is in the context. Variables with low absolute values will be almost irrelevant to the output.
Analysis of the input neurons’ weights for phenolic compounds models
From Table 8, it is possible to affirm that some variables have little influence on the number of phenolic compounds measured from the samples. The location Braga, the mode of production (organic and conventional), and the storage mode frozen received on average very low weights. That is an indication that the amount of phenolic compounds measured is mostly indifferent to those variables.
As for the location of the samples, Vouzela is clearly the location which seems to have a higher positive contribution to the number of phenolic compounds measured. Sever do Vouga, Estarreja and Oliveira do Hospital, in this order, have smaller contributions, but still receive important input weights, all above 0.32.
As for cultivar, the bluecrop shows the weakest contribution, with an input weight of less than 0.20. Duke and Ozarkblue show almost the same importance, with weights of 0.528 and 0.548.
From the input weight determined for the age of the bushes, which is 0.284, it is possible to affirm that the amount of phenolic compounds increases with the age of the bush. Altitude, on the contrary, received a very strong negative weight, of -0.557. Therefore, higher altitudes
decrease the number of phenolic compounds measured. As for the storage conditions, the weights obtained for storage at room temperature and refrigeration are very close: 0.354 and 0.358, respectively. Thus, both storage conditions show similar contributions to the number of phenolic compounds measured. The same can be claimed about the storage time: storage time receives a weight of 0.283. Therefore, longer times impact positively on the number of phenolic compounds. On the contrary, frozen samples show the little contribution to the prediction of the number of phenolic compounds.
As for the extraction methods, methanol shows a very strong positive contribution, while acetone: water shows a negative contribution. And, unsurprisingly, the order of the extract is also very important – the first extraction always produces larger amounts of phenolic compounds.
Analysis of the input neurons’ weights for anthocyanins models
From Table 8 it is clear that only a small number of input variables have a significant contribution to the output variable. With a positive contribution of 0.918, the location of Estarreja seems to be the place where berries with the highest amount of anthocyanins are to be found. Braga also receives a very large input weight, of 0.777. The output seems to be mostly indifferent to the other locations.
As for the cultivar, duke seems to be the richer in anthocyanins, with an input weight of 0.765. The other cultivars receive negligible input weights, which means their contribution is negligible to the prediction of the number of anthocyanins measured in the samples. And the same can be affirmed about the age of the bushes, which receives just a small negative weight. On the other hand,
Research Article 207
Table 8: Summary the average input weights calculated for the ANN models produced for each output variable.
Input variables Phenolic Compounds Anthocyanins Tannins ABTS DPPH
Location SV 0.632 0.164 0.109 -0.123 -0.041 ES 0.484 0.918 0.000 0.669 0.777 OH 0.328 0.019 0.043 -0.239 -0.196 VZ 0.878 0.117 0.125 -0.130 -0.061 BR 0.044 0.777 -0.053 0.545 0.636 Cultivar BC 0.199 0.016 0.071 0.111 0.151 DK 0.548 0.765 0.012 0.054 0.119 OZ 0.528 0.014 0.040 0.079 0.119 Age 0.284 -0.029 -0.042 -0.044 -0.073 Altitude -0.557 0.891 -0.239 0.949 1.000 Production mode CP -0.072 0.012 -0.104 -0.074 -0.099 OF -0.091 0.069 0.207 0.121 0.038 Storage Room 0.354 0.012 -0.429 -0.015 0.006 Ref 0.358 -0.014 -0.420 -0.023 0.024 Froz 0.059 0.000 0.891 0.203 0.274 Time 0.283 -0.005 -0.198 -0.200 -0.246 NE 0.000 0.000 0.000 0.000 0.000 ME 0.620 0.732 0.005 0.143 0.049 AW -0.340 -0.716 -0.052 -0.138 -0.107 Order 1 0.743 0.487 0.732 0.155 0.089 Order 2 -0.450 -0.504 -0.678 -0.160 -0.095
Origin: BR – Braga, ES – Estarreja, OH – Oliveira do Hospital, SV – Sever do Vouga, VZ – Vouzela; Cultivar: BC – Buecrop, DK – Duke, OZ – Ozarkblue; Production mode: CP – Conventional production, OF – Organic Farming. Storage: Room – Room temperature, Ref – Refrigerated, Froz – Frozen; Solvent: NE – No Extract, ME – Methanol, AW – Acetone/Water.
the altitude of the farm receives one of the highest weights: 0.891. Therefore, the samples were grown at the higher altitudes provided the largest amounts of anthocyanins.
As for the production mode, it seems to have very little impact on the output. The input weights for conventional and organic farming are barely above the noise level. Nonetheless, the organic mode has an input weight 5.61 times larger than the conventional production mode.
The storage mode also has a very small impact on the number of anthocyanins, with refrigeration slightly reducing the quantity measured. The same weak correlation is observed for a time, with a weight of just -0.005.
As for the extraction methods, again methanol retrieves a much larger quantity, compared to acetone: water. And the same can be affirmed about the order of extraction-the first extraction retrieves most of the anthocyanins from the samples.
Analysis of the input neurons’ weights for tannins models Table 7 shows that the average performance of the models produced for the analysis of tannins was lower than average performance for the other output variables. In the case of tannins, the average R was 0.688 and the average MSE was 0.202. Therefore, the confidence in the conclusions for the analysis of tannins is lower than the confidence in other conclusions. Nonetheless, the stronger
208 Research Article trends captured by the neuron input weights will still be
valid and deserve careful analysis.
The outstanding weights show that the farms in Vouzela (weight 0.125) and Sever do Vouga (weight 0.109) have a stronger positive impact on the amounts of tannins. As for the cultivar, the bluecrop received the largest input weight compared to other varieties. But considering the absolute value is just 0.071, that is a very weak correlation. The same can be observed for the input weight of the age of the bush. Age scored a weight of -0.042, which points towards a slightly negative impact of age on the number of tannins extracted from the samples.
As for altitude of the farm, higher altitudes clearly have a negative impact on the number of tannins measured. The input weight of altitude was, on average, -0.239.
As for the production mode, there seems to be a clear difference between conventional production and organic farming. Conventional production mode scored a weight of -0.104, while organic farming scored 0.207. This shows that conventional production mode has a negative impact on the number of tannins, while organic farming has an important positive contribution.
As for storage mode, the input weights show that storage at room temperature and refrigeration receive strong negative weights (-0.429 and -0.420, respectively). On the other hand, freezing has a very strong positive impact, with an input weight of 0.891. Besides, the amount of tannins reduces over time, for a time received an average input weight of -0.198.
As for the extraction methods, the use of methanol has a very small positive contribution to the output, while the use of acetone: water shows a small negative impact. Unsurprisingly, the weights also show the first extraction is much more effective than the second extraction.
Analysis of the input neurons’ weights for ABTS and DPPH models
As for output variables ABTS and DPPH, the value of R for all dataset was 0.963 for ABTS and 0.933 for DPPH. Hence, there is a strong confidence in the analysis considering the performance of the models. Those results are discussed together since the models are actually very similar for both variables.
The results show that the location of the farm has a very strong impact on the values of ABTS and DPPH. For ABTS, Estarreja and Braga received average input
weights of 0.699 and 0.545, while Sever do Vouga, Oliveira do Hospital and Vouzela received negative weights. For DPPH, Estarreja and Braga scored, respectively, 0.777 and 0.636, while the other locations also scored negatively. Therefore, samples from Estarreja and Braga will have much higher contents of ABTS and DPPH than the other locations.
As for the cultivars, bluecrop shows the higher contributions of ABTS and DPPH, with an average input weight of 0.111 for ABTS and 0.151 for DPPH. The other cultivars receive slightly lower input weights for both variables.
The age of the bush has a slightly negative impact on the amounts of both ABTS and DPPH – average input weights of -0.044 for the former and -0.073 for the latter show that older bushes produce smaller amounts of both. On the contrary, the altitude of the farm has a very strong positive impact, with a positive input weight of 0.949 for ABTS and 1.000 for DPPH.
Again, the production mode also has an important contribution to these particular variables. Samples from conventional production farms will score lower amounts of ABTS and DPPH, with an input weight of just -0.074 for ABTS and -0.099 for DPPH. Samples from organic farming will score higher, with average input weights of 0.121 and 0.038.
As for storage conditions, freezing contributes to increased amounts of both ABTS and DPPH, with input weights of 0.203 and 0.274, compared to slightly lower input weights for storage at room temperature and refrigeration. In fact, storage at room temperature and refrigeration scored negatively for ABTS.
Also clear from the models is that the amount of both ABTS and DPPH decrease with storage time, for the average input weights are -0.200 and -0.246, respectively.
As for the extraction methods, again the first extraction is the most effective, and methanol is more effective than acetone: water.
CONCLUSIONS
The results obtained in this work allowed concluding that methanol was more efficient in extracting the phenolic compounds and anthocyanins from blueberries, while in the case of tannins, they were equally extracted with methanol or an aqueous solution of acetone. Differences were encountered among cultivars and places
Research Article 209 of production as well as according to the production mode,
so that the organic blueberries revealed higher contents in total phenols, anthocyanins, tannins, and antioxidant activity.
The effect of storage was not entirely established, although a slight trend was observed for an increase in the phenolic compounds and antioxidant activity along storage, both for refrigeration and freezing conditions. This trend was observed during conventional analysis and confirmed with the analysis of the neural network models. Altitude of the farms also seems to have a very important impact on the properties of the berries, with higher altitudes impacting negatively the phenolic contents and tannins, and positively the other variables.
These results are important for farmers to plan the best conditions in order to produce fruits with improved properties, namely define proper storage conditions because they have a positive impact on the total phenolic compounds present with antioxidant activity, thus being beneficial for human health. However, further work could be done in order to evaluate the antioxidant activity by different methodologies of analysis, since these have a great influence on the results. Also, the evaluation of flavonoids and ortho-diphenols could be a future complement for this work.
Received: Mar. 23, 2017; Accepted: Jul. 17, 2017 REFERENCES
[1] Cardeñosa V., Girones-Vilaplana A., Muriel J.L., Moreno D.A., Moreno-Rojas J.M., Influence of Genotype, Cultivation System and Irrigation Regime on Antioxidant Capacity and Selected Phenolics of Blueberries (Vaccinium corymbosum L.), Food Chemistry, 202: 276–283 (2016).
[2] Ferlemi A.-V., Makri O.E., Mermigki P.G., Lamari F.N., Georgakopoulos C.D.: Quercetin Glycosides and Chlorogenic Acid in Highbush Blueberry Leaf Decoction Prevent Cataractogenesis in Vivo and in Vitro: Investigation of the Effect on Calpains, Antioxidant and Metal Chelating Properties, Experimental Eye Research, 14: 258–268 (2016). [3] Fachinello J.C., Mirtilo, Revista Brasileira de
Fruticultura, 30(2): 0–0 (2008).
[4] Gonçalves C., Guiné R.P.F., Costa D.V.T.A., Gonçalves F.J., Evaluation of Bioactive Phenols in Blueberries from Different Cultivars, International Journal of Biological, Food, Veterinary and Agricultural Engineering, 9(4): 281–284 (2015).
[5] Martynenko A., Chen Y., Degradation Kinetics of Total Anthocyanins and Formation of Polymeric Color in Blueberry Hydrothermodynamic (HTD) Processing, Journal of Food Engineering, 171: 44– 51 (2016).
[6] Mammadov R., Ili P., Vaizogullar H., Makascı A.,
Antioxidant Activity and Total Phenolic Content of Gagea fibrosa and Romulea Ramiflora, Iranian Journal of Chemistry and Chemical Engineering (IJCCE), 30(3): 57–62 (2011).
[7] Fraige K., Pereira-Filho E.R., Carrilho E.,
Fingerprinting of Anthocyanins from Grapes Produced in Brazil Using HPLC–DAD–MS and Exploratory Analysis by Principal Component Analysis, Food Chemistry, 145: 395–403 (2014).
[8] Pérez-Gregorio M.R., Regueiro J., Simal-Gándara J., Rodrigues A.S., Almeida D.P.F., Increasing the Added-Value of Onions as a Source of Antioxidant Flavonoids: A Critical Review, Critical Reviews in Food Science and Nutrition, 54(8): 1050–1062 (2014).
[9] Taherkhani R., Chemical Investigation and Protective Effects of Bioactive Phytochemicals from
Artemisia ciniformis, Iranian Journal of Chemistry and Chemical Engineering (IJCCE), 35(2): 15–26 (2016). [10] Mammadov R., Makasçı - Afacan A., Uysal - Demir D.,
Görk C., Determination of Antioxidant Activities of Different Urginea maritima (L.) Baker Plant Extracts, Iranian Journal of Chemistry and Chemical Engineering (IJCCE), 29(3): 47–53 (2010).
[11] Barnes J.S., Nguyen H.P., Shen S., Schug K.A., General Method for Extraction of Blueberry Anthocyanins and Identification Using High Performance Liquid Chromatography-Electrospray Ionization-Ion Trap-Time of Flight-Mass Spectrometry, Journal of Chromatography A, 1216(23): 4728– 4735 (2009).
[12] Giovanelli G., Brambilla A., Rizzolo A., Sinelli N.,
Effects of Blanching Pre-Treatment and Sugar Composition of the Osmotic Solution on Physicochemical, Morphological and Antioxidant Characteristics of Omodehydrated Blueberries (Vaccinium corymbosum L.), Food Research International, 49(1): 236–271 (2012).
210 Research Article [13] Li D., Meng X., Li B., Profiling of Anthocyanins
from Blueberries Produced in China Using HPLC-DAD-MS and Exploratory Analysis by Principal Component Analysis, Journal of Food Composition and Analysis, 47: 1–7 (2016).
[14] Norberto S., Silva S., Meireles M., Faria A., Pintado M., Calhau C., Blueberry Anthocyanins in Health Promotion: A metabolic Overview, Journal of Functional Foods, 5(4): 1518–1528 (2013). [15] Cardeñosa V., Medrano E., Lorenzo P.,
Sánchez-Guerrero M.C., Cuevas F., Pradas I., Moreno-Rojas J.M.,
Effects of Salinity and Nitrogen Supply on the Quality and Health-Related Compounds of Strawberry Fruits (Fragaria × ananassa cv. Primoris), Journal of the Science of Food and Agriculture, 95(14), 2924–2930 (2015).
[16] Sandhu H.S., Wratten S.D., Cullen R., Organic Agriculture and Ecosystem Services, Environmental Science & Policy, 13(1): 1–7 (2010).
[17] Galarça S., Cantillano R., Schunemamn A., Lima C.:
“Influência da Atmosfera Controlada no Sabor do Mirtilo “bluegem” em Armazenamento Refrigerado”, Universidade Federal Pelotas, Brasil (2008).
[18] Retamales J.B., Mena C., Lobos G., Morale, Y.,
A Regression Analysis on Factors Affecting Yield of Highbush Blueberries, Scientia Horticulturae, 186: 7–14 (2015).
[19] Severo J., Galarça S.P., Aires R.F., Cantillano R.F.F., Rombaldi C.V., Silva J.A., Phenolic Compounds, Anthocyanins, Antioxidant Capacity and Vitamin C in Blueberries Stored under Controlled Atmosphere, Brazilian Journal of Food Technology, 12(Supl. II SSA), 65–70 (2009).
[20] Sargolzaei J., Saghatoleslami N., Mosavi S., Khoshnoodi M., Comparative Study of Artificial Neural Networks (ANN) and Statistical Methods for Predicting the Performance of Ultrafiltration Process in the Milk Industry, Iranian Journal of Chemistry and Chemical Engineering (IJCCE), 25(2): 67–76 (2006). [21] Tao Y., Wang P., Wang J., Wu Y., Han Y., Zhou J.,
Combining Various Wall Materials for Encapsulation of Blueberry Anthocyanin Extracts: Optimization by Artificial Neural Network and Genetic Algorithm and a Comprehensive Analysis of Anthocyanin Powder Properties, Powder Technology, 311: 77–87 (2017).
[22] Simić V.M., Rajković K.M., Stojičević S.S., Veličković D.T., Nikolić N.Č., Lazić M.L., Karabegović I.T., Optimization of Microwave-Assisted Extraction of Total Polyphenolic Compounds from Chokeberries by Response Surface Methodology and Artificial Neural Network, Separation and Purification Technology, 160: 89–97 (2016). [23] Guiné R.P.F., Barroca M.J., Gonçalves F.J., Alves M.,
Oliveira S., Mendes M., Artificial Neural Network Modelling of the Antioxidant Activity and Phenolic Compounds of Bananas Submitted to Different Drying Treatments, Food Chemistry, 168: 454–459 (2015).
[24] Santos W.N.L. dos, da Silva Sauthier M.C., dos Santos A.M.P., de Andrade Santana D., Almeida Azevedo R.S., da Cruz Caldas J., Simultaneous Determination of 13 Phenolic Bioactive Compounds in Guava (Psidium guajava L.) by HPLC-PAD with Evaluation Using PCA and Neural Network Analysis (NNA), Microchemical Journal, 133: 583– 592 (2017).
[25] Gonçalves F.J., Rocha S.M., Coimbra M.A., Study of the Retention Capacity of Anthocyanins by Wine Polymeric Material, Food Chemistry, 134, 957–963 (2012).
[26] Santos S.C.R.V.L., Guiné R.P.F., Barros A., Effect of Drying Temperatures on the Phenolic Composition and Antioxidant Activity of Pears of Rocha Variety (Pyrus communis L.), Journal of Food Measurement and Characterization, 8(2), 105–112 (2014). [27] Boulton R., The Copigmentation of Anthocyanins
and Its Role in the Color of Red Wine: A Critical Review, American Journal of Enology and Viticulture, 52: 67–87 (2001).
[28] Ribereau-Gayon P., Stonestreet E., Dosage Des Tanins du Vin Rouge et Determination de Leur Structure, Chimie Analitique, 48: 188–196 (1966). [29] Brand-Williams W., Cuvelier M.E., Berset C., Use
of a Free Radical Method to Evaluate Antioxidant Activity, LWT - Food Science and Technology, 28(1): 25–30 (1995).
[30] Miller N.J., Rice-Evans C., Davies M.J., Gopinathan V., Milner A., A Novel Method for Measuring Antioxidant Capacity and Its Application to Monitoring the Antioxidant Status in Premature Neonates, Clinical Science, 84(4): 407–412 (1993).


![Table 8 shows the weights measured for each input variable, normalized in the interval [-1, 1] to facilitate the analysis](https://thumb-eu.123doks.com/thumbv2/123dok_br/15814194.1080870/14.892.85.813.163.353/table-weights-measured-variable-normalized-interval-facilitate-analysis.webp)