Mo 23 A06
An All In Resistivity and Seismic Portable Field
System
F.E.R. Almeida* (University of Aveiro), R. Baieta (University of Aveiro), A. Ferreira (University of Aveiro)
Summary
A data acquisition system based on LabView virtual instruments was developed to allow both electrical resistivity and seismic wave velocity measurements with no need for switching equipments and standard multicables. This is achieved by simply using eight electrodes as connectors for four geophones when changing from electrical to seismic methods.
The Pole Pole resistivity array was adopted using the eight electrodes for potential measurements while the current electrode was manually displaced thus using less cable. The tomographic refraction method was based on four common receiver gathers. Each receiver gather consists of 16 shots one metre apart fired manually This apparatus enables the use of a simple, lightweight and also cheap field system with a good spatial seismic and electrical parameter resolution for multipurpose site characterization. A controlled experiment was done to validate the system.
Introduction
Field work in remote and difficult areas demands the development of lighter, multifunction, easy to operate and transport equipment. Field operations in such areas malfunctions and failure demand easily replaceable equipment and parts. These problems are very important in equipment conception and have already been addressed by several authors Hornbach (2004); Herman (2011); Badmus and Kilasho (2013) and Ferreira (2016). These authors have worked on the construction of simple but separate resistivity and seismic acquisition systems. Recent investigations have approached the integrated electrical and seismic methods for geotechnical applications such as Cosentini and Foti (2014) and Konishi and Hashimoto (2016).
Herein it is proposed a data acquisition system with eight electrical cables, based on LabView virtual instruments, allowing both electrical resistivity and seismic wave velocity measurements with no need for switching equipments and multicables. This is achieved by simply using eight electrodes as connectors for four geophones when changing from electrical to seismic methods.
The Pole Pole resistivity array was adopted using the eight electrodes for potential measurements while the current electrode was manually displaced thus using less cable. The tomographic refraction method was based on four common receiver gathers. Each receiver gather consists of 16 shots one metre apart. Since the shots are fired manually and the use of resistivity cables for the seismic acquisition avoids duplicating the cables. Therefore, this apparatus enables the use of a simple, lightweight and also cheap field system with a good spatial seismic and electrical parameter resolution for multipurpose site characterization. As field data are recorded in different files, processing demands file sorting and compiling before geophysical data inversion.
Data acquisition
The acquisition is done using a DAQ, NI USB 6215 - 16 bit with 32 inputs - that converts analogue signals into digital ones to be processed at top sampling rate of 250 KSamples/s. The channels can be connected either as differential or as referential. Hence, in the case of the differential method, the positive and negative terminals of one channel are connected into two distinct inputs, that can oscillate freely between positive and negative. This method was adopted for the seismic data acquisition. When using the reference method, multiple channels are connected to the same reference thus all negative terminals are connected into one input. The positive terminals are connected in each input independently. This way, referential signals are measured in reference to one common input, freeing more inputs and allowing connecting a greater number of channels. This method was used for the resistivity. In the used setup, it is not possible to apply the reference method to the seismic data acquisition, because each channel would need to be shielded from each other.
Using LabView software, three different virtual instruments (programs) were developed. Two programs allow the acquisition of electrical resistance and seismic measurements. The third one allows a continuous measurement of seismic signal aiming to confirm the readiness of the system and all its channels. Using this feature, it is possible to simply walk a straight line over the setup and the steps can be visible approaching and moving away from every single geophone depending on its position. Since each electrode is used as a connector to a geophone, if the geophones are functional, the electrodes must be too.
The seismic acquisition program allows the setting of the number of samples and the data input rate. Thus it is possible to achieve better resolutions at the expense of more acquisition time and effort. The
The electrical resistance acquisition program was designed using the same principle as the seismic one. Analogue waveforms are collected and converted into digital data. The number of samples and rate can be defined. The current intensity (in amps) is added to the program by the operator and it is divided by the measured voltage data, giving the operator a direct value of resistance. This program also allows the recording of a data file similarly to the seismic program. The seismic program starts with trigger in a digital channel (DAQ), but, on the other hand, the resistivity acquisition program starts manually and the terrameter needs to be individually switched on. The program stops automatically after 10 seconds of operation.
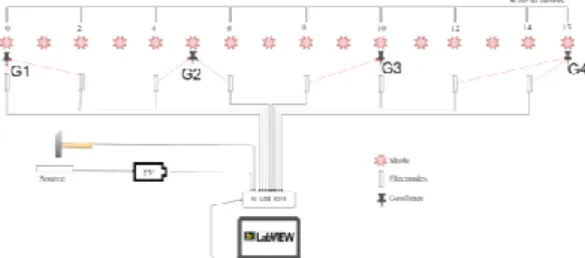
The acquisition system is composed by a 15m multicable that connects eight potential electrodes (N) to the DAQ. In this case, electrodes operate with a 2m spacing (0, 2, 4, 6, 8, 10, 12 and 14m, Figure 1). The infinite reference potential electrode (M) – common electrode – must be at a distance larger than 30m from the measurement line. The DAQ is connected to a laptop running LabView virtual instrument scripts. A Terrameter (SAS300) generates current through the current electrodes. The infinite current reference electrode (A), must be at a distance larger than 30m from the line. The other current electrode (B) is displaced manually between each potential electrode on each measurement (1, 3, 5, 7, 9, 11, 13 and 15m, Figure 1). The four geophones (G1 to G4) are also placed at equal spaced distances of 5m (0, 5, 10, 15m, Figure 2). It is possible to choose starting with the resistivity or the seismic method. However, the seismic method also needs to connect the trigger to the DAQ. A battery is always connected to the DAQ and during the seismic acquisition it connects to the trigger base using the current electrode (A) cable and for the hammer; the current electrode (B) cable is used. The reference potential electrode (M) can stay connected during the seismic trials.
Figure 1 Resistance data acquisition system. Figure 2 Seismic data acquisition system.
Data processing
The obtained eight current files consist of eight electrical potential values arranged in columns, sampled at 1KHz (100 samples with a rate of 1000) during 10 seconds. A program is written in Octave to gather all the acquired files in a readable format for Res2DInv. Hence, at first, resistance values need to be obtained from the electrical signals and then resistivity is calculated and associated with the respective geometry. The resistivity recovery process is based on the search of the medians of the positive and negative current wave (Figure 3). The half difference between the two medians is the resistance; the resistivity is obtained multiplying the resistance by the pole-pole geometrical factor. As mean values are first reduced from the signals, the median of the positive signal subtracted from the median of the negative signal normalized to resistance is a measuring error.
Regarding seismic data processing, 16 shots are recorded and sorted for a common receiver gather. After this step, data are normalized to the maximum value trace, filtered, and intensity values cropped. Finally, a point mode view is displayed for picking by graphical input. The seismic picking is done in a point mode view (right of Figure 4) and visualized in the wiggle trace mode (left of Figure 4).
Figure 4 Seismic data picking process in
Octave.
Figure 3 Automatic resistance determination in
Octave.
Examples
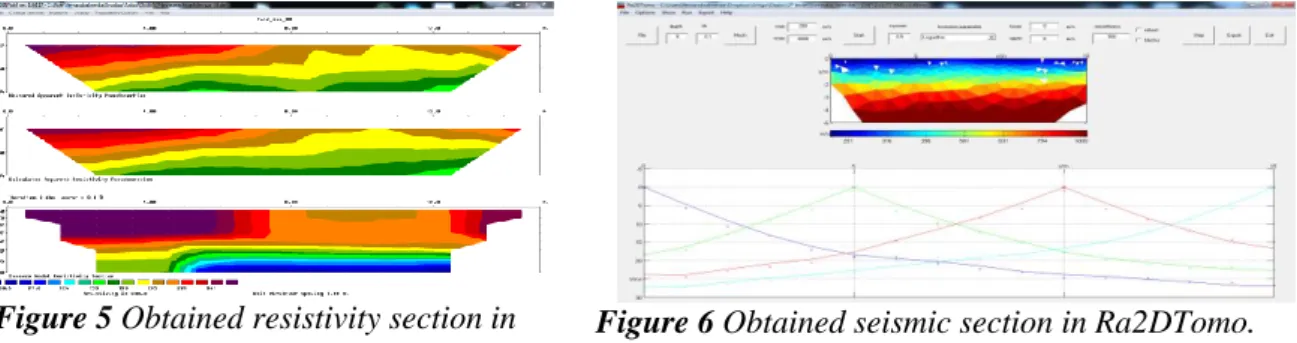
A test was done in the University of Aveiro Campus. The water table level was at around 2.5m as measured in a nearby well. The acquisition line runs near cement foundations that might affect the data locally. A geophysical and geotechnical study of this soil was already done; Baieta (2016). Local resistivity and wave velocity model sections were obtained using Res2DInv and Ra2DTomo to invert the data arranged in Octave. (Figures 5 and 6).
Res2DInv.
Figure 5 Obtained resistivity section in Figure 6 Obtained seismic section in Ra2DTomo.
The water table is clearly marked at a depth of around 2.5m (Figure 5), by the sharp contrast between the more resistive upper layers, dry and unsaturated soils, and the more conductive deeper layers, saturated soils. Between the surface and the water table it is depicted a radial variation of resistivity, between locations 6-13m. The centre of this anomaly coincides with a monolith that stands aside of the acquisition line. As the centre of this anomaly is more conductive than the surroundings it can be argued that there could be some leaching of the monolith cement foundations into the soil. As it is observed in the models the layers dip gently to the left.
The seismic model (Figure 6) depicts a velocity model that shows an increase in velocity with depth. The water table is also visible at a depth similar to the one interpreted in the resistivity models, that is, about 2.5m where the velocity values increase. As in the case of the resistivity models there is a gentle layer inclination to the left. Minimum velocities are of around 350m/s and are exclusively located near the surface, that is loose and unsaturated soil, and maximum values of around 1000m/s are found at the deepest regions of the model. In the seismic model, the water table level is also evident.
Conclusions
A multipurpose system was successfully designed to obtain both resistivity and seismic data. This system is light, fast to assemble and easily repairable. It is expected that field operations with this system take similar or less time than standard operations with commercial seismograms and resistivity meters. However, this system weights about 28kg, with all tools and box. Thus, it is very convenient for airplane travelling on a cheap budget which makes it very competitive to operate in remote and difficult access areas.
The system must be used for small scale prospection where high resolution is important. This paradigm intends to replace higher grade systems providing a cheaper and simpler alternative.
Acknowledgements
The authors give their thanks to Professor Manuel Matias for support provided and to the FCT – Fundação para a Ciência e Tecnologia Geobiotec (UID/GEO/04035/2013) for the financial support. Finally, the authors acknowledge the Octave open source GNU community and Thomas Günther for Rad2DTomo.
References
Badmus, B.S. and Kilasho, A.O. [2013]. Fabrication of Electrical Resistivity Equipment and Some Model Studies within Complex Basement Terrain of Southwestern Nigeria. Research Journal of Physics, 7: 17-23. URL: http://scialert.net/abstract/?doi=rjp.2013.17.23.
Baieta, R.S. [2016]. Laboratorial characterization of a soil using electrical and seismic methods. Master thesis, University of Aveiro.
Cosentini, R. M., and Foti, S. [2014]. Evaluation of porosity and degree of saturation from seismic and electrical data. Géotechnique, 64(4), 278.
Ferreira, A.C. [2016]. Seismic signal acquisition using Arduino in construction materials: characterization and identification of heterogeneities. Master thesis, University of Aveiro.
Herman, R. [2011]. An introduction to electrical resistivity in geophysics. Journal of Water Resource and Protection, 3, 768-780
Hornbach, M.J. [2004]. Development and implementation of a portable low cost seismic data acquisition system for classroom experiments and independent studies. J. Geosci. Educ., 52: 386-390. URL: http://d32ogoqmya1dw8.cloudfront.net/fi ... _v52n4.pdf.
Konishi, C., and Hashimoto, Y. [2016]. The Rock Physics Template to Estimate Clay Content, Porosity, and Vulnerability of River Levees. In Near Surface Geoscience 2016-22nd European Meeting of Environmental and Engineering Geophysics.