Characterization
Of Male Lineages
In the Asháninka
From Peru
Gonçalo Aragão da Fonseca Pinto Leite
Genética Forense
Departamento de Biologia 2018
Orientador
Maria João Prata, Professor Associado, FCUP, I3S, IPATIMUP
Coorientador
Verónica Gomes, Junior Researcher, I3S, IPATIMUP Leonor Gusmão, Visiting Professor, UERJ
Todas as correções determinadas pelo júri, e só essas, foram efetuadas.
O Presidente do Júri,
Dissertação de candidatura ao grau de Mestre em Genética Forense submetida à Faculdade de Ciências da Universidade do Porto.
Este trabalho foi desenvolvido sob a orientação científica da Doutora Maria João Prata, da Doutora Verónica Gomes e da Doutora Leonor Gusmão.
Dissertation for applying to a Master’s Degree in Forensic Genetics, submitted to the Faculty of Sciences of the University of Porto.
This work was developed under the scientific supervision of Maria João Prata PhD, Verónica Gomes PhD and Leonor Gusmão PhD.
Agradecimentos
À Professora Maria João, o seu apoio, incentivo e crença em mim, não só em momentos académicos, como pessoais, foram cruciais neste ano. Mais que uma orientadora, foi uma mentora para mim, e disto saio com um conhecimento científico muitíssimo reforçado e com um enorme orgulho em poder chamá-la de minha orientadora. Só me resta dizer “Obrigado por tudo e até breve”.
À Verónica, obrigado por todo o conhecimento e sapiência que me transmitiste. Num ano em que tiveste uma mão cheia para guiar, arranjaste tempo e paciência para guiar todos nós o melhor possível, e por isso não te consigo agradecer o suficiente. Ficam as ajudas todas, os risos e acima de tudo, os conselhos. Muito obrigado!
À Leonor, embora nunca tenhas estado presente fisicamente, sinto que é como se tivesses estado. Sempre pronta a ajudar e aconselhar, mesmo do outro lado do Atlântico. Obrigado por tudo o que fizeste por mim e até um dia!
A todo o grupo de Genética Populacional, sempre pronto a ajudar no que fosse necessário, a fazer-me rir das maneiras mais únicas e a tranquilizar-me sempre que necessário. Não podia ter pedido um melhor grupo. Obrigado!
A todos os meus amigos. Faculdade, secundário, infância, são todos especiais para mim e todos tiveram uma mão em fazer-me chegar aqui. Ficam os risos, lágrimas e histórias das melhores pessoas que alguma vez conheci. Um agradecimento especial ao Pedro Rosa e à Sara Sousa por todas as ajudas que me deram ao longo deste último ano, vocês foram cruciais neste caminho.
A toda a minha família, em especial aos meus avós, Lurdes e António, por sempre terem acreditado em mim e estarem lá sempre que precisava. Não seria metade do que sou sem vocês.
À minha mãe e ao António, por acreditarem, por me aturarem, por me possibilitarem isto, pelos sacrifícios e pelos sermões. Todas as vossas palavras e atos tivera importância. Devo a vocês a outra metade do que sou hoje.
À minha irmã, Joana, por me aturar acima de tudo. És tudo aquilo que desejei numa irmã e espero que eu te inspire da mesma maneira que tu me inspiras. Esteja onde estiver, estarei sempre ao teu lado.
À Rita, minha namorada, melhor amiga e parceira. Fizeste de mim uma pessoa melhor. Nunca teria conseguido fazer isto sem ti, a tua paciência, a tua boa vontade e o teu amor. E por isso tudo nunca irei deixar de te agradecer.
Ao Zeus, o meu lobo. Nem dois anos estiveste comigo, mas nunca te irei esquecer. Obrigado por seres uma inspiração, pela tua amizade e pelas inúmeras memórias. Ficarás sempre no meu coração. Até sempre.
Summary
Over the course of the last decades, population genetics studies have persistently addressed the original colonization of the American continent. The numerous works until now performed, contributed to achieve a broad perspective on the peopling of the Americas. More recently, however, attention was focused in South America, where strong heterogeneity was found across current-day Native-American populations.
Peru is home to many indigenous populations that have experienced variable degrees of admixture after the European colonization. Due to the peculiarities of the ecosystem region encompassed by nowadays Peru, many native communities are still fairly isolated from one another.
In order to get a deeper insight into the history on Peruvian Amerindians, the paternal lineages of the Asháninka, one of the largest Peruvian ethnic groups, were characterized in this study. It involved 59 Asháninka males who were interrogated for 39 Y-SNPs. In order to expand the conventional characterization of Q-lineages, typically associated with Amerindians, a Multiplex Q was redeveloped incorporating Y-SNPs downstream to Q-M3, which is one of the widely assumed Amerindian founder lineages. The obtained results were analyzed taking into account the 27 Y-STRs profiles provide in a previous study (Tineo et al 2015).
The majority (91%) of the Asháninka lineages belonged to haplogroup Q. The remaining chromosomes (9%) were ascribed to African or European ancestry, indicating that Asháninka are among the less admixed Native–American groups from South America. Within haplogroup Q, 65,3% of the Asháninka fell in sub-haplogroup Q-M3, 30,6% in sub-lineages within Q-M3, namely Q-Z19319 (4.1%), Q-Z19483 (2.0%) and especially Q-SA05 (24.5%), while only 4.1% were ascribed to sub-lineages upstream to M3, in particular Q-P36.2 and Q-M346. Concerning the Q-SA05 lineages, STR based evidence was obtained on the presence of two sub-clades downstream Q-SA05 in the Asháninka gene pool.
Compared with other Amerindian populations, the Asháninka did not reveal special affinities with other native-American populations, including from Peru.
Overall, and contrarily to the reported for Europe and Asia, where population genetic structure was highly correlated with geography and language, in South America Native populations neither language or geography accounted to explain the high heterogeneity observed across different populations .
The detection of a STR-defined sub-branch of Q-M3 in Peruvian South-Americans together with finding out that Q-SA05 encompasses two sub-types in the Asháninka, led to anticipate that in the future a fine characterization of haplogroup Q will provide important insights into the complex history of current-day South-American native populations.
Resumo
Nas últimas décadas, muitos estudos de genética populacional debruçaram-se sobre a colonização do continente americano. Os numerosos trabalhos até agora efetuados contribuíram para alcançar uma razoável perspetiva global quanto ao povoamento das Américas. Mais recentemente, porém, a atenção focou-se na América do Sul, caracterizada por grande heterogeneidade entre as populações nativas.
No Peru, ainda existem atualmente muitas populações indígenas, pese embora terem sofrido graus variáveis de mistura após a colonização europeia. Devido à diversidade de ecossistemas que o Peru abrange, muitas dessas comunidades nativas estão bastante isoladas umas das outras.
No sentido de obter uma melhor visão sobre a história dos ameríndios peruanos, neste estudo procedeu-se à caracterização das linhagens paternas dos Asháninka, um dos maiores grupos étnicos peruanos. O estudo envolveu 59 homens Asháninka que foram analisados quanto a 39 Y-SNPs. De forma a refinar o nível de caracterização convencional do haplogrupo Q, considerado um dos haplogroups fundadores nos ameríndios, foi atualizado um Multiplex Q previamente desenvolvido, incorporando novos Y-SNPs a jusante a Q-M3. Os resultados obtidos foram depois analisados tendo também em conta os perfis de 27 Y-STRs descritos num estudo anterior (Tineo et al 2015).
A maioria das linhagens masculinas dos Asháninka (91%) pertencia ao haplogrupo Q, enquanto que as restantes (9%) tinham ascendência africana ou europeia, resultado que indica que os Asháninka estão entre os grupos indígenas da América do Sul menos miscigenados. Dentro do haplogupo Q, 65,3% dos Asháninka pertenciam ao sub-haplogrupo Q-M3, 30,6% a sub-linhagens dentro de Q-M3, nomeadamente Q-Z19319 (4,1%), Q-Z19483 (2,0%) e, em especial, Q-SA05 (24,5%), enquanto que apenas 4,1% foram classificados em dois sub-ramos a montante de M3, Q-P36.2 e Q-M346. No que respeita às linhagens Q-SA05, a conjugação de dados fornecidos por STRs permitiu detetar a presença de dois sub-clados a jusante Q-SA05 presentes no pool genético dos Asháninka.
Comparativamente a outras populações ameríndias, os Asháninka não revelaram afinidades especiais com outras populações nativas americanas, inclusive do Peru.
No geral, e contrariamente ao descrito para a Europa e Ásia, onde a estrutura genética das populações está fortemente correlacionada com a geografia e a língua, nas populações nativas da América do Sul nem a língua nem a geografia contribuem para explicar a elevada heterogeneidade populacional observada.
A deteção em sul-americanos peruanos de um sub-ramo particular dentro de M3 (definido com base nos perfis de STRs), juntamente com a observação de que Q-SA05 engloba dois sub-tipos de linhagens nos Asháninka (também de acordo com perfis de STRs), permite antever que no futuro uma caracterização mais detalhada do haplogupo Q pode fornecer informações importantes sobre a complexa história das populações nativas da América do Sul.
Table of Contents
Agradecimentos ... i
Summary ... iii
Resumo ... v
Table of Contents ... vii
Figure Index ... ix Table Index ... xi Keywords ... xiii Introduction ...1 Population Genetics ...2 Genetic Diversity ...2
Human Genetic Diversity ...3
Y chromosome ...5
Mutation and Polymorphisms...7
Multiallelic markers ...7
Biallelic markers ...9
Entrance in the Americas ... 11
Uniparentally transmited lineages in native-americans ... 14
Peru and the Asháninka ... 16
Aims ... 19
Materials and Methods ... 21
Sampling ... 22
Construction of a new Multiplex Q ... 22
DNA Amplification and Sequencing ... 23
Statistical Analysis ... 25
Results and Discussion ... 28
Asháninka Genetic Diversity... 29
Q lineages ... 31
Heterogeneity within Q-SA05 lineages ... 33
Population Comparisons ... 35
Y-STRs ... 36
Pairwise Genetic Distances ... 37
Y-SNPs ... 42
Conclusion ... 49
Bibliography ... 52
Web Resources ... 63
Figure Index
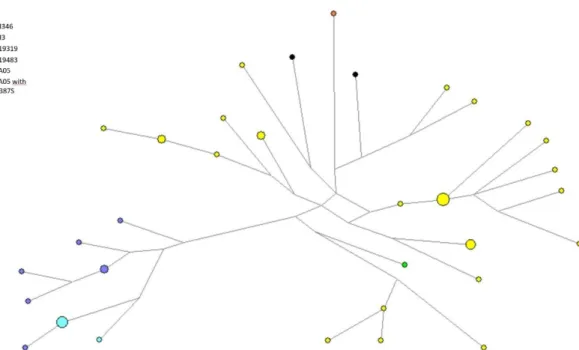
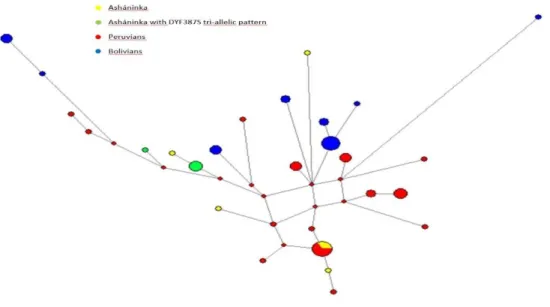
Figure 1 -Chromosomal locations for several of the commonly utilized Y-STRs (Butler 2003) ...8 Figure 2- Distribution and diversity of the Y-Chromosome haplogroups around the world (adapted from http://www.transpacificproject.com/index.php/transpacific-migrations/) 10 Figure 3- Map depicting the early Homo Sapiens migrations. (Addapted from http://news.bbc.co.uk/2/hi/science/nature/4435009.stm) ... 13 Figure 4- Phylogenetic tree of the Y chromosome according to Karafet et al 2008. Adapted from Geppert M et al 2011. ... 16 Figure 5- Geographic location of Peru within South America (adapted from www.who.int) ... 16 Figure 6- Phylogenetic tree of the SNPs included in Multiplex Q and inferred haplogrous ... 25 Figure 7- Relative frequency of haplogroups from Native Americans of several South American countries. Amerindian lineages are assigned in tones of orange, European in tones of blue and African in tones of green ... 29 Figure 8- Network of all the Asháninka that were assigned to haplogroup Q. It is noticeable that the samples seem to form two clusters, one where all the samples that were genotyped as Q-SA05 are aggregated, and a second where all the samples from the remaining haplogroups are grouped, seemingly with not much differentiation between them. ... 34 Figure 9- Network with the Q-SA05 Asháninka samples and Q-SA05 individuals from Jota MS et al (2016) ... 34 Figure 10- MDS plot based on the RST genetic distances, based on the information
of 15 Y-STR, between the 24 populations analyzed. A) Populations in this plot are grouped according to country as follows: Peru (Red), Bolivia (Purple), Ecuador (Orange), Brazil (Green), Argentina (Blue), Venezuela (Pink), Colombia (Yellow). The Asháninka are marked as black. B) Populations in this plot are grouped according to linguistic clade as follows: Equatorian-Tuconoan (Red), Ge-Pano-Carib (Purple), Andean (Green), Chibcan-Paezan (Black). The Asháninka are marked as yellow. ... 39 Figure 11- MDS plot based on the RST genetic distances, based on the information
of 7 Y-STR, between the 24 populations analyzed. Populations in this plot were grouped by country as follows: Peru (Red), Bolivia (Orange), Ecuador (Purple), Venezuela (Pink), Brazil (Green), Colombia (Yellow), Argentina (Blue). The Asháninka are marked in black ... 40
Figure 12- MDS plot based on the FST genetic distances, based on the information
the Y-SNP haplogroups, between the 18 populations analyzed. Populations in this plot were grouped by country as follows: Peru (Red), Bolivia (Orange), Ecuador (Purple), Venezuela (Pink), Brazil (Green), Colombia (Yellow), Argentina (Blue). The Asháninka are marked in black. ... 43 Figure 13- Phylogenetic network of South Amerindians constructed with the information from 15-Y-STR and 5 Y-SNPs within haplogroup Q. ... 46 Figure 14- Phylogenetic network of Peruvian Native Americans constructed with the information from 15-Y-STR and 5 Y-SNPs within haplogroup Q. ... 46
Table Index
Table 1- Primers that were added to Multiplex Q described in Roewer et al. (2013) in order to create the newly developed Multiplex Q. ... 25 Table 2- Relative frequency of the haplogroups detected in the Asháninka. The nomenclature of the haplogroups is according to van Oven M, et al. 2014. ... 29 Table 3- Genetic diversity of the Ameridian populations according to the various resolutions levels of Y-STRs. ... 37 Table 4- RST genetic distances and P-values between 5 Peruvian populations using
19 Y-STRs. Values that are non-statistically significant are underlined in red. ... 38 Table 5- RST genetic distances and P-values between the 24 populations using 15
Y-STRs. Values that are non-statistically significant are underlined in red. ... 39 Table 6- FCT (variance between groups) and P-values of non-differentiation in an AMOVA based on the information of 15 and 7 Y-STRs. ... 41 Table 7 Y-SNP haplogroups genetic diversity for 18 Amerindian populations. The genetic diversity was measured using three distinct resolutions. One where only the Asháninka could be evaluated, as haplogroup Q was genotyped with the rMultiplex Q. A second where the highest resolution Q would be Q-M3, aside from the other non-indigenous haplogroups that were found. Finally, the third where only the diversity inside haplogroup Q was measured in all populations. ... 42 Table 8- FCT (variance between groups) and P-values of non-differentiation in an AMOVA based on the information of Y-SNPs. ... 44 Table 9- FCT (variance between groups) and P-values of non-differentiation in an AMOVA based on the information of 15 Y-STRs of 11 Peruvian populations. ... 46
Keywords
Native Americans Y Chromosome Y-SNPs Y-STRs Population Genetics Genetic StructureAbbreviations
AIM Autosomal Ancestry Informative Markers
AMOVA Analysis of Molecular Variance
BLAT BLAST-like alignment tool
Bp Base pairs
DNA Deoxyribonucleic Acid
dNTP deoxy Nucleotide-TriPhosphate
KA Thousand Years Ago
MB Megabases
MDS Multi-Dimensional Scaling
MNPD Mean Number of Pairwise Differences
MSY Male-Specific region of the Y chromosome
mtDNA Mitochondrial DNA
NGS Next Generation Sequencing
NRY Non-recombinant region of the Y chromosome
OOA Out-of-Africa
PAR Pseudo-Autosomal Regions
PCR Polymerase Chain Reaction
rMultiplex Q Redeveloped Multiplex Q
SBE Single Base Extension
STR Short Tandem Repeat
SNP Single Nuclear Polymorphism
Tm Melting Temperature
YCC Y Chromosome Consortium
Population Genetics
Population genetics is the discipline that studies the factors leading to the genetic differentiation of populations within the same species. Through the analysis of patterns of genetic diversity, it might address diverse topics such as the origin of a given population, its phylogenetic relationship with other populations, its migrations and even the propensity to certain diseases. Population genetics has since long established important ties with several other scientific areas, such as anthropology, linguistics, medicine and forensic sciences, being helped while simultaneously helping to investigate a great number of questions. This is illustrated, for instance, by the extremely important contribution into the forensic sciences, among which forensic genetics is nowadays considered the best model of how science can be applied in the forensic setting (Saks & Koehler, 2005).
Population genetics is crucial in forensic genetics, where more or less intricate analyses of biological samples at a molecular level are needed to investigate cases of paternity, sexual assaults, missing persons, among many other. The important role of population genetics relies on the models it affords to obtain likelihood ratios of hypothesis, besides permitting to guide the construction of the databases necessary to evaluate the evidence. Due to the high diversity of human populations from all over the world, it is important to have different databases, depending on the area where a sample is retrieved. For instance, to estimate the Random Match Probability in a population (i.e. the probability that a certain profile, based on a specific set of markers, is shared by a randomly chosen profile in a given population), a database of the population in question must be used in order to obtain a reliable probability estimates.
Genetic Diversity
Genetic diversity stands for the variation in number and proportion of alleles at several loci found between individuals of a population. This variation is the result of various evolutionary factors, which interact in a way that ends up molding the patterns of diversity within and among populations. Mutation and recombination, selection, migration, matting pattern, and genetic drift, are the factors that account to a population diversity.
The matting pattern of a population influences much its diversity. For simplicity’s sake, most population genetic models assumes random matting within a population. This might be difficult to understand when considering today’s human society, given that physical appearance, social status and even geographic distance may influence the matting patterns. In certain societies the reproductive preference is between individuals that are closely related (inbreeding). However, in most cases, matting criteria are too subjective, though preferences determined by the physical appearance (phenotypical traits), are not unusual, once an individual may prefer a partner with traits that resemble their own (positive assortative matting). The cases above described, illustrate kinds of “preferential” mating that may end up in augmenting homozygosity, which, in its turn, diminishes diversity in a population.
Opposite outcomes might arise from other evolutionary forces, such as mutation and migration. Migration implies the relocation of individuals from a population into another. Since they can bear alleles uncommon or not found in the new population, this ends up injecting diversity within the latter population, while simultaneously lessening the differentiation between the two populations. Migration also offers an opportunity to broken matting barriers determined by geography, language, among other factors.
Mutations, regardless of the kind, are the primary source of variability and consequently of differences between individuals, populations and species. However, because the average rate of mutations is fairly low, the role it plays alone in evolutionary change is relatively modest. Recombination that occurs during meiosis, leads to new arrangements of maternal and paternal transmitted chromosomes, promoting novel combinations of alleles. Together with mutation, recombination is an important contributor to increase genetic diversity in a population.
Human Genetic Diversity
Humans have always been curious about their history, migrations, and the origin of Homo sapiens. Since long that genetics is becoming more and more important to obtain insights into many questions that initially were mainly addressed by archeology, paleontology and linguistics.
The studies on human genetic diversity grew much with the advances in molecular anthropology. The first major study in this field was performed by Landsteiner in the 40’s and was based on the analysis of the ABO system. This study represented a milestone that stirred the interest for knowing how diverse human populations could be
at the molecular level and how differences between human populations could be explained. With the advances in Molecular Biology, other tools were developed able to measure genetic diversity, being of note the detection by electrophoresis of blood protein polymorphisms, pioneered by Pauling et al in 1949 and Harris in 1966. The wide scale study of protein and blood groups polymorphisms, afforded the first comprehensive view of the human genome, that though indirect and of low resolution, provided the surprising result, for the time, that the majority of human total genetic diversity was due to differences between individuals within a population (85%) and not between different human populations (15%) (Lewontin, 1972). These results would be latter fully sustained.
In 1991 was published a work that represents one of the biggest revolutions in human population genetics studies. Using a fairly recent technology, Li & Saddler presented the first worldwide estimate of human genetic variation based on direct DNA screening, which relied in the amplification of DNA sequences via polymerase chain reaction (PCR; Mullis et al, 1985). While the results obtained did not differ substantially from data provided by the previous generation of genetic markers, the study paved the way to explore the most indicated markers of the genome to address the history of human populations. From the originally studied autosomal DNA markers, the set was soon expanded to the uniparental markers located in the mitochondrial DNA and the Non-Recombinant Region of the Y chromosome (NRY). The unique characteristics of the uniparental markers, namely the fact of being non-recombining together with the low effective number, makes them highly sensitive to capture past episodes of gene flow between populations as well as past bottlenecks and expansions, which were demographic events that deeply shaped the substructure of human populations, leaving traces in the patterns of genetic diversity that persisted throughout generations until today.
Since then, DNA markers were widely recruited to investigate the worldwide patterns of genetic diversity in modern human populations, providing important clues to
reconstruct the human evolutionary history. Overall, genetic variation was found at higher levels in African populations compared to non-African populations, and Africans were shown to possess the largest number of population-specific alleles while non-African populations harbored a subset of the genetic diversity present in Africa (Tishkoff and Verrelli, 2003). It was also demonstrated that the genetic differentiation between populations was highly correlated with the geographic distance, meaning thus that the global human genetic variation is mainly clinal, while another striking finding was that geographic distance from East Africa (a probable cradle of anatomically modern
humans) explained as much as 85% of the smooth decrease in gene diversity within human populations (reviewed in Handley et al, 2007). The increasingly available genetic evidence was highly used to fuel a debate that since long dominates the anthropological area. It is focused on where and when archaic hominins evolved into modern Homo sapiens, concerning which two main oversimplified hypothesis exists: the multiregional model and the replacement, also known as out-of-Africa (OOA) model. The majority of genetic studies sustained the OOA model, holding that anatomically modern humans originated in Africa around 200 Kya giving rise to all extant world populations through a major migration wave that left Africa around 60–70 Kya.
Although still riddled in controversy which and how many geographical routes
were taken by the modern humans when leaving Africa, as well as the timing of the out-of-Africa event(s) (reviewed in López et al, 2015), it is widely assumed that the dispersion of humans throughout Eurasia involved a series of migrations that were accompanied by
severe bottlenecks in the migrating groups, leading to a drastic decrease in genetic
diversity before rapid increase in population size and expansion into unoccupied regions.
Y chromosome
The Y chromosome, is of the two sexual chromosomes that is male-specific, being only transmitted from father to son. The mammalian X and Y sex chromosomes have evolved from a pair of ancestral autosomes, which supposedly were different in therians (placentals and marsupials) and egg-laying monotremes. Sex chromosome differentiation began as a consequence of events of suppression of recombination, likely triggered by chromosomal rearrangements, which was accompanied by a continuous gene loss and progressive deterioration of the proto-Y chromosome, leading to the 60 Mbps chromosome that we observe today in humans (Cortez et al, 2014).
The specific part of the Y chromosome considered more useful in population genetic studies is the so called male-specific region of the Y chromosome (MSY), sometimes known as the non-recombining region of the Y, which in humans is flanked by two Pseudo-Autossomal Regions (PAR 1 and PAR2, the latter being encountered solely in Homo sapiens; Jobling, Pandya & Tyler-Smith, 1997). Together, PAR 1 and PAR2 encompass 3 Mbps.
Apart from three euchromatic regions, denominated as the transposed, X-degenerated and ampliconic regions, around 60% of the human Y chromosome is
composed by repetitive sequences that are largely confined to the heterochromatic portion of the long arm and the pericentric region (Skaletsky et al, 2003).
Recombination events occur in most of the human genome, leading to new arrangements of maternal and paternal alleles on a given chromosome. However, the Y chromosome does not suffer recombination in the majority of its extension, as in the MSY, and recombination events are restricted to the PARs, regions where homologous X-Y pairing occurs. For that reason, the PARs are essential regions of the Y, because they are responsible for the correct disjunction of the sex chromosomes during meiosis.
Due to the absence of recombination, the transmission of the genes located in MSY to the next generation occur as a block, meaning that the entire region represents a haplotype. Furthermore, the region will be integrally transmitted from one generation to the next, unless any mutation occurs (Jobling & Tyler Smith, 2003).
These properties of MSY underlie the importance that the study of paternal lineages has achieved in forensic and evolutionary genetics. The use of Y-chromosome genetic marker in these fields has seen a huge improvement and adherence in the past decades (Karafet et al, 1999; Bortolini et al, 2003; Battaglia et al, 2013).
In forensic DNA analysis, it has revealed to be a crucial tool in missing person investigations and in crime scene investigations, being particularly suitable in cases of sexual assaults. Y-chromosome can also assist paternity investigations where biological material for the alleged father is absent. In this field, the properties of the Y chromosome bring a critical disadvantage, which is the incapability to discern between individuals that belong to the same paternal lineage (Jobling & Tyler-Smith, 1997).
As for evolutionary and population genetics, genetic variation of Y chromosome has also become a key part of research (Jobling and Tyler-Smith, 2017). Since this chromosome exists only as a single copy in males, the effective population size of the Y is one fourth that of the autosomes, turning it highly susceptible to the effects of demographic events such as bottlenecks, founding events, and also explaining the sharp genetic differences between populations spread throughout the world detected with Y-chromosome analyses (reviewed in Jobling, 2012).
Mutation and Polymorphisms
The basic definition of mutation is any permanent and heritable change in the genome from which arise differences, either in sequence or in length, between an ancestral and a descendant (derived) configuration. Since the Y chromosome is a constituent of the nuclear genome, its average mutation rate is similar to the average of autosomes, once all chromosomes in the nucleus are under the same regulatory mechanisms. However, since there is only one copy of the Y chromosome per cell, no hidden mutations or silent alleles pose the challenges that exist in autosomes (Vicard et al, 2008; Slooten & Ricciardi, 2013).
Mutation is the source of genetic polymorphisms in the genome, including the Y chromosome. The next section will focus the most commonly studied types of Y polymorphisms, namely the rapidly mutating short tandem repeats (STRs), which belong to the category of multiallelic markers, and the more slowly mutating single-nucleotide polymorphisms (SNPs), which usually are biallelic markers.
Multiallelic markers
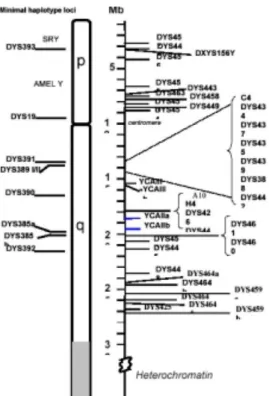
Short-tandem repeats, also known as microsatellites, are a type of length polymorphisms that can be found throughout the genome. STRs consist on a near-perfect repetition of a small sequence unit (1–6 bp), typically containing 10 to 25 repetitions (International Human Genome Sequencing Consortium, 2001). These markers are multiallelic, with each allele corresponding to a different number of tandem repeats at a locus, and are among the most polymorphic loci in the genome (Weber, JL 1990). The high degree of polymorphism at the STRs is due to their average high mutation rate. In the last decades, more than 200 Y-STRs have been identified. The first Y-STRs was discovered in 1992 by Lutz Roewer (Roewer et al, 1992), being now known as DYS19. This first discovery, led to an increasing use of Y-STRs in the forensic casework, which in turn prompted intensive research on the characteristics of the STRs from the paternally transmitted chromosome.
Figure 1 -Chromosomal locations for several of the commonly utilized Y-STRs (Butler, 2003)
Strong efforts were done to explore the mutation rate at the various Y-STR loci, with the results pointing out the high variability in the mutability at each STR. In the majority of STR markers currently used in forensic genetics, mutation rates were recently estimated to vary between 1 × 10⁻⁴ and 1 × 10⁻³ (Ballantyne et al, 2010). However, a few of those Y-STRs showed mutation rates substantially higher than the average, varying between 1.19 × 10⁻² and 7.73 × 10⁻², being there after designed as rapidly mutating Y-STRs (Ballantyne et al, 2010; Pinto et al, 2014).
Other studies have addressed the mutation mechanism of Y-STRs. It was possible to demonstrate that, similarly to the observed at autosomal STRs, Y-STRs predominantly fit the stepwise mutation model, with the majority of the mutations being single step changes leading to the increase or decrease of one repeat motif (Gusmão et al, 2005).
In parallel, various databases with Y-STRs information were launched, among which the Y Chromosome Haplotype Reference Database (https//: yhrd.com; Willuweit & Roewer, 2007) is currently considered the most valuable open access online resource.
One of the consequences of the introduction of Y-STRs typing in the forensic casework, was the implementation of various multiplex kits allowing the simultaneous characterization of several STRs (Tirado et al, 2009; Wang et al, 2016). Many
commercial kits are currently available constituted by primers that amply different sets of STRs, from the minimal set containing the 9 loci that define the so-called minimal Y-STR haplotype (DYS19, DYS389I, DYS389II, DYS390, DYS391, DYS392, DYS393 and DYS385ab), to the most recently released commercial kit (Yfiler®Plus, ThermoFisher, Scientific) that consists in 27 Y-STRs, some of which being rapidly mutating STRs, a kind of Y-STRs shown to increase substantially the resolution to differentiate unrelated males ( Ballantyne et al, 2014).
Biallelic markers
SNPs are by far the most abundant class of variation in the human genome (1000 Genomes Project Consortium, 2015), accounting to 85% of the total human genetic variation (Genomes Project et al, 2012). SNPs arise usually from unique events in the genome, implying that although four bases can occupy a given nucleotide position, only two alternative alleles (the ancestral and the derived) are found in the majority of SNPs (Underhill et al, 1997). This has two main causes, one is the low average mutation rate of SNPs, estimated at approximately 10-9 per generation (Nachman and Crowell, 2000), much lower when compared to the average in STRs; while the other is that due to the huge amount of nucleotide sites, the probability is extremely rare that one site mutates two or more times. There are SNPs reported to present three or even four alleles, though they are extremely rare compared to biallelic SNPs.
In terms of forensic studies, compared to STRs, considered to be the markers of choice in the field, SNPs present some limitations mainly due to the low mutation rate and limited phylogenetic resolution. The number of SNPs necessary to have a similar discrimination power than the conventionally used STRs is around 5-6 times higher (Amorim and Pereira, 2005). However, the forensic interest in SNPs has continuously grown along the years, particularly having in mind some specific applications (Sobrino et al, 2005; Xue & Tyler-Smith, 2010). For instance, their low mutation rate can be advantageous to augment the efficiency of paternity testing. Besides, SNPs can be analyzed in much shorter amplicons than necessary for STRs, making SNPs very suitable to be tested in degraded samples (Hughes-Stamm et al, 2011).
SNPs from the Y define stable haplotypes, known as haplogroups, groups of SNP-based haplotypes that share a common ancestor (Y Chromosome Consortium, 2002). They have been used to build the Y-Chromosome phylogeny, whose resolution
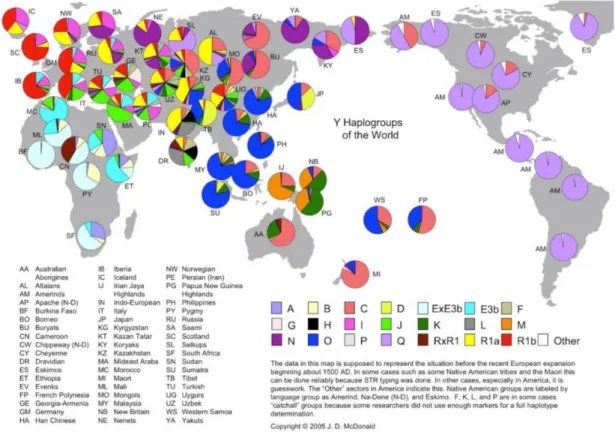
Figure 2- Distribution and diversity of the Y-Chromosome haplogroups around the world (adapted from http://www.transpacificproject.com/index.php/transpacific-migrations/)
has saw dramatic refinement in the last few years, as well has saw its time calibration (Jobling and Chris Tyler-Smith, 2017). Although initially, diversity of Y-STRs within haplogroups was the resource used to obtain information about their time-depths, the increasing availability of Y-chromosome data through next-generation sequencing permitted the use of new approaches to calibrate the age of the Y-haplogroups.
The Y-haplogroups revealed to present sharp geographic differentiation, with different haplogroups being distributed across different regions of the world (figure 2).
Along the past few decades, many population genetic studies were performed based on Y-SNPs, providing important insights into past human migrations or processes of population admixture, male-mediated expansions or male-specific bottlenecks, and many other demographic events that shaped the genetic diversity of extant human populations.
Entrance in the Americas
The entrance of anatomically modern humans into the Americas is still a hotly debated topic. Researchers from various scientific areas are conjoining efforts to obtain answers integrating population genetics, linguistic and anthropological evidence.
The idea that the first American inhabitants were migrants from Asian populations was put forth by the Spanish Jesuit José de Acosta as early as the sixteenth century (de Acosta et al, 2002). In the following centuries, the questions surrounding the peopling of the Americas were essentially fueled by archeological findings, which in the early 20th century led Hrdlicka (1928) to advance with a formal model of colonization according to which it was the result of a single, rapid migration throughout the continent, after the crossing of the Bering land bridge around 16.5 thousand years ago. The most important archeological evidence basing the model was the Clovis culture, which was found in the interior of North America, dating circa 13,000 years ago. In the meanwhile, older archeological findings were discovered, in the now called pre-Clovis sites, as is the case of Monte Verde in Chile, which dated 14,600 years (Dillehay et al, 2008). This caused confusion and casted doubt on the original supposition that the New World was colonized via a single migration, as it was expected that the oldest archeological finding would be located in North America.
The entering in the age of molecular genetics, opened a new chapter in the debate on the peopling of the Americas. In 1986, a highly controversial paper was published by Greenberg et al, who combining archaeological, linguistic and genetic evidence proposed that the colonization of the Americas happened via three waves of migration, which were associated to the three linguistic groups spoken by native-Americans (Na-Dene, Eskimo-Aleut and Amerindian); these migrations, each with different Asian origins, reached separately the New World after the Last Glacial Maximum.
In the following decades, a large amount of studies addressed the subject, some sustaining previous models, or refining them, and still other suggesting new interpretations.
Once it was generally agreed that Beringia was indeed the entry door to the New World, as is reflected in the widely disseminated “Out of Beringia” expression (Goebel et al, 2008), geological and paleo-environmental considerations were consistently recruited
to the debate. Conflict between the archeological evidence, indicating that the entire continent was already colonized by 13Kya, and evidence that Beringia was isolated from North America until 14 thousand years ago, thus post-dating the estimated 14,6 thousand years archaeological finds of the Monte Verde site, led, in 2008, Kitchen et al to present a three stage colonization model, positing that the proto-Amerind population was a sub-population that derived from Central Asia, travelled towards Northeastern Siberia, reaching it around 36 kya, after a journey that was accompanied by significant population growth. The divergence from the Central-Asian source population involved a severe bottleneck, which is argued to have deeply accounted for the reduced levels of genetic diversity found among Native Americans. After the entrance in Beringia, the founder population remained stable in size for long time, possibly due to the lack of nutritional resources. Then, Amerinds rapidly expanded into the Americas ≈15,000 years ago (Kitchen et al, 2007).
Finally, the defrosting of the ice sheets on the interior of North America steered the proto-Amerinds into a rapid expansion throughout the entire continent. On the way south, native-Americans have experienced an overall 16 fold population growth (Kitchen et al, 2008), with all the journey having been deeply marked by a series of bottlenecks that followed the multiple population splits. Besides, crossing Central America towards South through the narrow Isthmus of Panama, was certainly prone to additional bottleneck events, being also probable that only a small number of individuals succeeded to access the high altitude Andean regions. This process of peopling explains the low levels of genetic diversity typically found among native-American populations.
The detection of a subtle Australo-Melanesian genetic signal in Amerindian populations, prompted the recuperation of a two-wave migration model, also known as the Paleoamerican model, originally based on the cranial morphology, which hypothesized that two temporally and source distinct populations colonized the Americas. One earlier population originated in Asia in the Late Pleistocene gave rise to both the first Paleoamericans and present-day Australo-Melanesians. Later, the first Paleoamericans were largely replaced by ancestors of present-day Amerindians, who were descendants of later arriving Mongoloid populations (González-José et al, 2003). Such a view, however, was not supported when recently tested with genome-wide data (Raghavan et al, 2015).
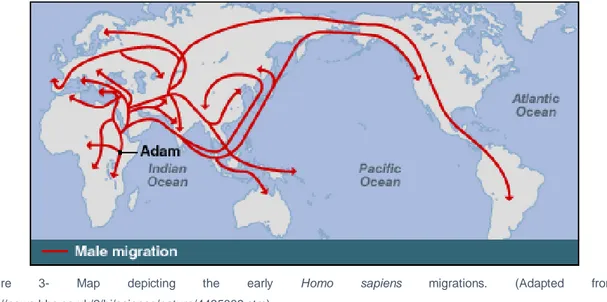
Figure 3- Map depicting the early Homo sapiens migrations. (Adapted from http://news.bbc.co.uk/2/hi/science/nature/4435009.stm)
Still, the recent identification of some Y-chromosome lineages is South America, absent from the North and Central regions of the continent whereas occurring at high frequency in Asia, that showed signs of having been introduced into South America no more than 6,000 years ago, led to hypothesize that trans-Pacific routes of connection between East Asia and South America were established long after the settlement of South America by Native-Americans (Rower et al, 2013).
Currently, many uncertainties still persist on the peopling process of Americas, and among the several models differing in the timing, routes and ancestry of the migrants, the most predominant perspective is of an early entry (~25,000 to 15,000 years ago) into the continent, with some defending it occurred via a Pacific coastal migration, others sustaining that migrants mainly used interior ice-free corridors, while others believing that migrants used both interior and coastal routes (reviewed In Potter et al, 2018).
In historical times, the post-Colombian colonization of the New World by Europeans initiated in the late XV century, and in the following centuries the transatlantic slave-trade with destination to Americas, dramatically reshaped the population scenario of the entire continent.
Uniparentally transmited lineages in native-americans
Due to their peculiar characteristics, mtDNA and Y chromosome have been a primary source of genetic information on Amerindians (Fagundes et al, 2008; Perego et al, 2010).
Several studies based on the maternally inherited mitochondrial DNA demonstrated low genetic diversity in the Amerindian maternal pool. They also revealed that a number of mtDNA lineages (haplogroups) were almost exclusively found in Native Americans, showing patterns of internal diversity fitting a scenario of recent population expansion. Only five haplogroups (A, B, C, D and X) have been described in the Native American mtDNA, with all of them, except X, presenting moderate frequencies in Asians (Fagundes et al, 2008). mtDNA-based evidence seems to sustain that prior to the colonization through the internal ice-free corridor, a coastal route along the Pacific was taken during the migration, which otherwise is consistent with the fact that South American archaeological sites have been dated as older than the ones found in North America (Llamas et al, 2016) .
On the other hand, analysis of the Y-chromosome also revealed reduced genetic diversity among native-American groups (Battaglia et al, 2013). In South America, strong genetic differentiation was found among the male pools of Native populations, and in addition the male genetic structure followed an East-to-West clinal pattern of diversity, meaning that a higher level of genetic diversity was found in the west southern coast when compared to the east southern one (Tarazona-Santos et al, 2001). Contrarily to the described for Europe (Roewer et al, 2005), neither geography nor language accounted significantly for the pattern of genetic structure among native-Americans (Roewer et al, 2013).
In the patrilineal genome, only two Y-chromosome haplogroups were considered to be founder lineages in Native Americans, Q and C (Bortolini et al, 2003; Zegura et al, 2003). Out of the two, haplogroup Q is by far the most predominant and spread founder lineage, being defined by the Y-SNP M3. Several studies were performed to improve its resolution by examining derived sub-lineages defined by SNPs that phylogenetically are downstream to M3. However, diversity within Q-M3 was found to be very limited, with most of the derived sub-lineages discovered up to now possessing very restricted
geographical distribution (Bisso-Machado et al, 2011). This panorama was further being confirmed by Y-chromosome studies based on Next Generation Sequencing (NGS) approaches, which despite providing an updated and detailed phylogeny of haplogroup Q, reveal that the new lineages detected had restricted spatial distribution (Jota et al, 2016).
In South Amerindians, Q-M3 is particularly well represented, reaching the frequency of 91% in the populations studied by Peña et al (1995), excluding the Mapuches, a group of native-Americans that have experienced intense admixture with Europeans. The overwhelming preponderance of this haplogroup in South America reflects well the consequences of the serial founder events preceding and accompanying the settlement of native populations in the region (Underhill et al, 1996).
Haplogroup C, the other founder lineage in Native Americans, is comparatively much rarer- it accounts, on average, for about 6% of Native American Y chromosomes (Battaglia et al, 2013), and is geographically more restricted.
The C-P39 sub-lineage is typically found in Natives from North America, region where reportedly this sub-lineage is confined (Karafet et al, 2008).
It is absent from South America, where instead another C sub-lineage was detected, C-M217, although only in a few native groups either from Ecuador, namely the Kichwa (26%) and the Waorani (7.5%) (Geppert et al, 2011; Roewer et al, 2013), or Colombia, namely the Wayuu (8%) (Zegura et al, 2004).
C lineages were yet not encountered in Central America (Zegura et al, 2004), but the coverage of native people from there is still very scarce.
While the C-P39 lineages in North America are believed to have been introduced with the first wave(s) of Asian migrants who crossed Beringia, the presence in South America of C-M217, actually a branch more basal than C-P39 in the C haplogroup phylogeny, is supposed to have resulted from connections established at a later stage with East Asians via the already mentioned trans-Pacific routes (Rower et al, 2013).
Besides the founder lineages, other maternal and paternal types have been found among native-Americans that were ascribed to be of recent European or African ancestry. Given that those lineages were assumedly introduced in the Americas with the post-Columbian colonization, they have been widely used not only to obtain estimates of the degree of admixture between Amerindians and non-Amerindians but also to illuminate how sex-biased were such miscegenation processes (Zegura et al, 2004).
Figure 4- Phylogenetic tree of the Y chromosome according to Karafet et al, 2008. Adapted from Geppert et al, 2011.
Peru and the Asháninka
Peru is a South American country situated in the North-western coast. Due to the localization of the region that corresponds to nowadays Peru, it must have been one of the first to be colonized by the Amerindians, particularly if assuming they indeed followed the Pacific coastal route. The country covers an immense territory that spans a vast latitude. This territorial vastness in combination with several other geographical factors, contributed to the properties of a varied ecosystem, compromising mountainous (Andes), coastal and forest (Amazonian) regions. The latter covers about 60% of the Peruvian territory. This diversity, offered the opportunity for native populations to settle in places with quite different natural environments, while at the same time being isolated from one another, which ultimately fomented that each population was locally autonomous. Henceforth, Peru is home to a vast number of Native American populations such as the Asháninka, Bora, Aymara, Quechua, Awajún, among others, which differ greatly in terms of language, traditions and many other characteristics.
The population that will be the main focus on this work are the Asháninka. The Asháninka spoke a language that belongs to the Arawak, also known as Maipurea, language family, one that spans various languages and dialects spoken across South America.
There are many communities of Asháninka, small and spread over many territories both from Perú and Brazil. In the past, they were known to live in the forests of Junin, Pasco, Huanuco and part of Ucayali. However, in time, they started to relocate to the valleys of the rivers Pichú, Perené and Apurimac-Tambo Ene, or even to the mountainous region of Gran Pejonal.
The discovery of bronze axes in part of the ancestral territory of the Asháninka indicates that they maintained cultural and commercial trading exchanges with Andean people from pre-Inca times, while in the Inca period such connections were maintained with groups sharing the same linguistic group (Granero, 1992). These relationships likely afforded conditions for gene flow between people from the Andean world. However, accounts also exists indicating some rivalry between the Asháninka and other native populations, like the Shipibo, even in pre-Hispanic times (Espinosa, 1993).
In 1635, Hispanic missionaries started to enter the Asháninka territories, opening a dire period of contacts and conflicts that would led to the severe reduction of the number of Asháninka. According to scarce estimates, during the XVIII century the population decreased by 3.5 to 1 (Rojas Zolezzi, 1994). In mid XVIII century, the Asháninka and other Native groups participated in a rebellion against the Hispanic missionaries and conquerors. During this rebellion period, the Asháninka made peace with Native
populations then considered as rivals (Weiss 2005), bringing up a cultural flow that until then was residual.
In the XXth century, when Europeans set to fight for part of the lands of the Chanchamayo province that were inhabited by the Asháninka, several communities were displaced to the margins of the rivers Ene and Tambo (AIDESEP et al, 2000), with those resettled in Tambo being later relocated to the Satipo province. So, in the past century, many Asháninka continued to be displaced from their homes. In this forced displacement, many individuals would perish, reducing drastically the Asháninka population size; it is estimated that approximately 34 Asháninka communities disappeared during this period (CVR, 2003).
Nonetheless, the Asháninka are still nowadays one of the most numerous indigenous population in Peru, with a population estimated up to 70,000 people in general South America.
Given the state of the art concerning native-Americans from South America, the main objective of this work is to characterize the male lineages of the Asháninka, using a high resolution approach regarding Y chromosome haplogroup Q, since it was demonstrated to be a founder lineage in Native Americans.
To accomplish this goal, male lineages from 59 individuals from Asháninka were genotyped for 39 SNPs located in the non-recombinant portion of the Y chromosome. In addition, the STRs previously genotyped in Tineo et al (2015) were also recruited in order to compare the Asháninka with other South Native Americans, using data collected from an extensive bibliographic search. Combining these results, we aimed at obtaining a better understanding on the processes underlying the human colonization of the New World.
To summarize, the aims of this study were the following:
1. To characterize the male lineages of the Native American population Asháninka. 2. To achieve a higher resolution of the characteristic Amerindian haplogroup Q. 3. To contribute to a deeper understanding of the colonization of the New World.
Sampling
A sample of 59 unrelated Asháninka living in 42 different communities, all located alongside the margins of the Amazonian rivers Pichis and Palcazú in the Peruvian Andes, were considered for this work. The same sample had been previously genotyped for the Y-STRs by Tineo et al (2015). The work herein presented is included in a project that further aims to characterize the sample for Autosomal Ancestry Informative Markers (AIMs) and mitochondrial DNA. All participants have given written informed consent to cooperate in this study, which was conducted under strict confidential conditions. DNA had been previously extracted from bloodstains using the standard phenol-chloroform protocol, as described in Tineo et al (2015).
Construction of a new Multiplex Q
In order to develop a high resolution
multiplex system targeting haplogroup
Q,
an extensive bibliographic search was performed, seeking to compile the more recently described SNPs downstream to M3 - the mutation whose presence defines haplogroup Q-M3. This lineage belongs to the clade that is typically found among Native Americans. A previous SNaPshot multiplex system (multiplex Q) had been already developed that allowed the genotyping of Y-SNPs M242, P36.2, M346, M3, M19, M194 and M199 (Rower et al, 2013). The selection criteria for integrating new SNPs in thatmultiplex,
were based on two main points: on the one hand, the phylogenetic position, considering Q-M3 as the reference for the most basal clade, and picking then the SNPs that would permit the characterization of its sub-branches; on the other, and for each SNPs, the allele frequencies in populations where they were detected, having been excluded those with very low degree of polymorphism, i.e. with variations that had been only sporadically observed. Furthermore, regarding the SNPs already present in Multiplex Q, the bibliographic research was also updated in order to evaluate whether they should be maintained in the newly developed multiplex. At the end, the redeveloped Multiplex Q was constituted by a total of 10 SNPs.To design the primers for multiplex PCR, Genbank was consulted to access the sequences encompassing 500 bp flanking the different SNPs. The retrieved sequences were then submitted to Primer 3 (Untergasser et al, 2012), in order to identify the most suited primer pair (forward and reverse) for each polymorphism. Given that various primer pairs would be used in a single PCR, the characteristics of the primers, with special attention to their melting temperature and the predicted size of amplicons, were
taken into account with the purpose of achieving the successful amplification of all desired products, while being able to separate them in the polyacrylamide gel. Finally, being this a multiplex reaction, Auto-Dimer (Vallone & Butler, 2004) was used in order to check if there were any unwanted interactions between all of the primers. All the designed primers had a Tm of approximately 60ºC, were 20 nucleotides long, and the size of their amplification products ranged between 155-370bp.
Besides these PCR primers, primers for the method of single-base extension (SBE) were designed as well, since it was planned to adopt a SNaPshot strategy for typing the samples. The primers were designed as previously described for the PCR primers, under the condition that the 3´-end of SBE primers should be complementary to the base immediately before the interrogated SNPs. Furthermore, polynucleotide tails of different lengths, non-homologous with the human genome, were added to the 5’ extremity of the SBE primers to facilitate size-based distinction of SNPs in the electropherograms.
Lastly, to confirm the primer specificity, an in-silico PCR was performed with the various primer pairs (https://genome.ucsc.edu/cgi-bin/hgPcr), which allowed to evaluate whether the primers would anneal only with the targeted DNA sequences, avoiding thus the production of undesired amplification products. Additionally, a BLAT was also done, to test the specificity of the SBE primers ( https://genome.ucsc.edu/cgi-bin/hgBlat?command=start).
DNA Amplification and Sequencing
To test the efficiency of the designed primers pairs, singleplex PCR amplifications were initially done. In these amplifications, two samples were tested for each primer pair, utilizing 0,5µL of each primer, equal volume of DNA, and 2.5µl of QIAGEN® PCR kit and water for a total volume of 5µL. Samples were then submitted to an initial denaturation at 96ºC for 15 minutes, followed by 35 cycles at 95ºC for 30 seconds, 60ºC for 60 seconds and 72ºC for 90 seconds, ending with a final extension step at 72ºC for 10 minutes. The resulting PCR products, together with an allelic ladder and a negative control, were then submitted to an electrophoretic run in polyacrylamide gels (8.4%), colored with the standard Silver Staining method, in order to assure the correct amplification of all the fragments.
Next, the Multiplex PCR system was developed. A Multiplex PCR is basically a typical PCR amplification, but using simultaneously various primers in the mix reaction, leading to the co-amplification of various sequences from the same DNA template. In the
system here developed, successful results were obtained using all primers at a final concentration of 0,2µM each, in the PCR mix. To correctly assign all the samples to their respective haplogroups, 4 multiplexes with a total of 39 Y-SNPs were used. The samples that did not belong to haplogroup Q were genotyped by utilizing Multiplex 1+M13 marker (Gomes et al, 2010a), Multiplex 2 and Multiplex E (Brion et al, 2005). The QIAGEN® Multiplex PCR Kit (QIAGEN©) was used as the master mix, which includes Taq DNAPolymerase, minerals and deoxyucleotides (dNTPs) at optimized concentrations. The PCR conditions are equal as the one in the singleplex PCR. The PCR products were then submitted to electrophoresis, as previously mentioned, to evaluate the successful amplification of the desired sequences.
After confirming the successful amplifications of all target sequences, the next steps performed were the needed for multiplex single-base sequencing. Firstly, the PCR products were purified adding 0.5µL ExoSAP-IT™ (Applied Biosystems™) to each 1µL of PCR products, although some adaptations in the volumes had to be done in cases of weak yield of PCR products, which was assessed by inspecting polyacrylamide gel results. ExoSAP-IT is a cleanup reagent that hydrolyzes excess primers and nucleotides, which if were not removed could compromise the sequencing reaction. The conditions used in this purification step were: incubation at 37ºC for 15 minutes in which the enzyme will remove the primers and dNTPs that weren’t used. A 15 minute incubation at 85ºC for the inactivation of the enzyme.
The actual sequencing reaction was executed with a total volume of 5µl, composed by 1µl of SNaPshot® Multiplex Kit (Applied Byosistems), 1µl of the SBE mix, the aforementioned 1.5µl of the purified PCR product and the remaining volume was composed of water. Due to the possible adjustments in the purification step, the water volume can be modified accordingly in order for the final volume to be 5µl. The mix is then submitted to 25 cycles of a denaturation cycle at 96ºC for 10 seconds, followed by an annealing at 50ºC for 5 seconds and ending with an extension at 60ºC for 30 seconds. Immediately after the end of the single-base extension reactions the final products were submitted to another purification, by adding 1µL of FastAP (Thermo Scientific) to the products, this time with an incubation time of 60 minutes at 37ºC, for the removal of the unwanted products, followed by a 15 minute step at 85ºC for the inactivation of the enzyme.
Following this, the purified products were joined with a mixture of Liz120 Size Standard (9.25µl of Formamide Hi-Di with 0.25µl liz120), proportion 1:20, and then the
mix was submitted to capillary electrophoresis in an ABI3130 sequencer (Applied Biosystems). The results were analyzed with the GeneMapper® v.4.0 software.
SNPs Primers Z19319 Forward- 5’ TTTGCTGAAGTTGCCTGTCA 3’ Reverse- 3’ AGTTCCAGTCAGGGCAATCA 5’ SA01/M557 Forward- 5’ AAGATCCCACCACTGCACTC 3’ Reverse- 3’ CTCTGGCCCCTAACAAACCT 5’ Z19483 Forward- 5’ CCATGTAGGAGGAGGCAAAA 3’ Reverse- 3’ CATCACAAAAGCCAAAAGCA 5’ SA05 Forward- 5’ GAACCAAAGCACAGCACTCA 3’ Reverse- 3’ ATGCTCATGGCCTACACCTC 5’
Table 1- Primers that were added to Multiplex Q described in Roewer et al, (2013) in order to create the newly developed Multiplex Q.
Statistical Analysis
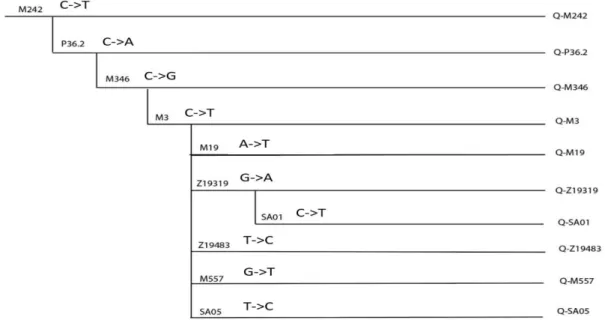
In figure 6, is presented the phylogenic tree of Y-chromosome haplogroup Q constructed with the 10 SNPs scrutinized. Besides the 10 SNPs evaluated by Multiplex Q, 29 other SNPs were used in order to assign the samples that did not belong to the indigenous haplogroups, as previously stated.
Haplogroup frequencies were estimated by direct counting. With Arlequin v3.5.2.2 (Excoffier and Lischer, 2010) the Y-STR and Y-SNP genetic diversities were measured. Apart from that, RST and FST were calculated. As Tineo et al (2015) had
already tested the genetic diversity with other Native American populations from Perú, in this study, the purpose was to compare our sample with Amerindian populations from other South American countries. In order to achieve that, an extensive bibliographic search was done, in which were assembled the Y-STR and Y-SNP data from several Ameridian populations. In genetic comparisons three different resolution levels were analyzed, consisting of 19, 15 and 7 Y-STRs. The number of populations used in each of the resolution levels were 5, 24 and 26, respectively. The samples were then tested for haplotype frequencies, the intra-populational genetic diversity, genetic distance (RST)
and differentiation between the populations. Regarding the calculations for the genetic distance and differentiation, all null and duplicate alleles were removed and the repeat number of DYS389II was subtracted from the repeat number of DYS389I.
Regarding the genetic comparisons based on Y-SNPs, the resolution level, regarding haplogroup Q, had to stop at Q-M3, since the majority of studies did not genotype SNPs downstream of M3. Apart from haplogroup Q, other haplogroups were treated equally, with their resolution being as high as possible. For the SNP analysis, 18 populations were analyzed for the intra-population genetic diversity, genetic distance and differentiation between the populations. For the analysis of the genetic diversity, three resolution levels were used. Firstly, the Asháninka were tested for the resolution provided by the redeveloped Multiplex Q. Secondly the 18 populations were tested regarding all haplogroups found, i.e. Amerindian and non-Amerindian. Lastly, those same 18 populations were tested while only regarding the lineages inside haplogroup Q.
Also with Arlequin, we did an AMOVA in order to compare the different groups regarding their genetic relationships. These were quantified by means of Rst and Fst, taking into account the evolutionary distance between Y-STR and Y-SNP data. The groups were defined by various categories, these being, country, altitude (divided in High, medium and sea level), linguistic families (divided in Equatorial-Tuconoan, Andean, Chibcan-Paezan and Ge-Pano-Carib) and geographic origin (dividing South America into three sections with a Northwest to Southeast orientation).
The program IBM SPSS Statistics 25 was used to construct two-dimensional graphics through Multidimensional Scaling (MDS) method, utilizing both the pairwise RST
Using the Network v5.0.0.0 program, median-joining networks were constructed for the Native American haplogroup Q. In one of the networks, all Y-STR loci were used, with the exception of DYS385 and DYS387S, being that these are typically double allelic. In order to present a less reticulated network, the reduced-median method (Bandelt et al, 1995) was applied before the median-joining method (Bandelt et a,. 1999).
Apart from this network, another three were constructed, which were performed using 15 Y-STRs common to all population samples. Apart from this, the information regarding the Y-SNPs was also used for these networks, taking into account 4 SNPs inside haplogroup Q (M242, P36.2, M346 and M3). To perform all the network analysis the weighing of each marker was inversely proportional to its variance, as according to Qamar et al (2002).
Asháninka Genetic Diversity
Out of the 59 samples available from the Asháninka, 54 were here successfully genotyped. The DNA quality of the remaining 5 was not enough to allow characterization with the redeveloped multiplex Q. Since all samples had been previously typed for Y-STRs (Tineo et al, 2015), we were able to predict the haplogroups of each sample and all the latter 5 belonged to haplogroup Q.
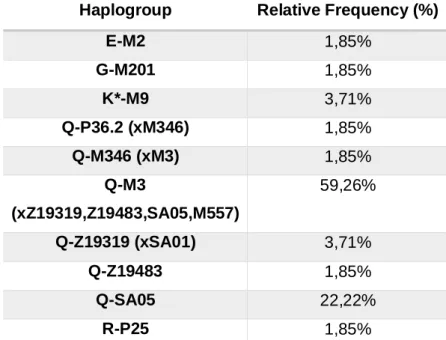
In this work, the interrogation of 39 SNPs led to the identification of 10 distinct haplogroups, 6 of which defined by mutations downstream to the most basal SNP in haplogroup Q (M242).
As expected, the bulk of the Ashaninka Y chromosome lineages belonged to haplogroup Q (91%), by far the most prevalent haplogroup in Native American populations. Besides this haplogroup, other Y-chromosomes were here found that fell in haplogroups E (2%), G (2%), K (3%) and R (2%). Since none of them is assumed to be a native-American founder lineage, its presence in Americas has easily been explained as a consequence of the post-Colombian colonization of the continent, which afforded substantial European and African gene flow into the gene pool of Native Americans. In the Ashaninka those lineages summed up 9.26%, a value that represents an estimate of the male mediated admixture rate between the Ashaninka and non-Amerindian people.
Haplogroup Relative Frequency (%)
E-M2 1,85% G-M201 1,85% K*-M9 3,71% Q-P36.2 (xM346) 1,85% Q-M346 (xM3) 1,85% Q-M3 (xZ19319,Z19483,SA05,M557) 59,26% Q-Z19319 (xSA01) 3,71% Q-Z19483 1,85% Q-SA05 22,22% R-P25 1,85%
Table 2- Relative frequency of the haplogroups detected in the Asháninka. The nomenclature of the haplogroups is
Concerning the set of lineages of non-Native Amerindian ancestry (E, G, K and R), the unique ascribed to be of African origin is haplogroup E, which is an haplogroup typically present at high frequencies across the African continent and only moderately frequent in other regions of the old world. The other 3 haplogroups are likely of European ancestry. Haplogroup G is most commonly present in the Middle East, though also found at lower frequencies across Europe, especially in Southern and Eastern regions. Two of our samples were classified as K-M9 (xN1c, P, T), which means that concerning the major subclades within K-M9, they were not N1c, P or T. However, taking into account the STR-haplotypes of these two samples, they were predicted to fall in the subclade L, defined by a mutation not included in any of the non-Q Multiplex systems used in this work. Since the associated prediction score was 100%, we assumed that the 2 K-M9 (xN1c, P, T) samples belonged indeed to the L haplogroup, which is known to be present in the Middle East and less frequently in Southern Europe, Central Asia and Northern Africa. Finally, one individual harbored a R-P25 lineage in a Y-STR haplotype indicating
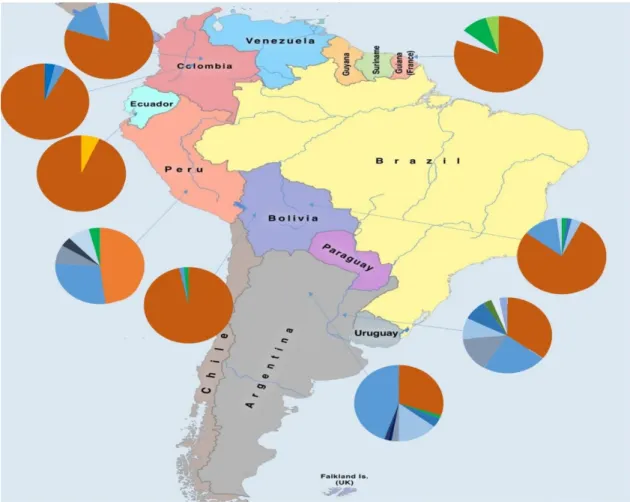
Figure 7- Relative frequency of haplogroups from Native Americans of several South American countries. Amerindian lineages are assigned in tones of orange, European in tones of blue and African in tones of green