Comparison of Pruning Regimes for Stone
Pine (Pinus pinea L.) Using a
Functional-Structural Plant Model
Surov´
y, P.
*1*2, Yoshimoto, A.
*1& Ribeiro, N.A.
*2Keywords: functional-structural plant model, pruning, 3D digitizing
Abstract: Functional-Structural Plant Models (FSPM) are becoming impor-tant tools for modeling the structure and growth of plants, including complex organisms like trees. These models combine the advan-tages of empirical, mechanistic, and structural models to simulate the growth of individual plant structures (branches, buds, leaves, etc.). This approach enables realistic evaluation of the plant’s response– including changes in structure and growth to different environmen-tal conditions. We demonstrate the potential use of these models to evaluate individual tree growth under different management regimes (pruning). The data used in this study was obtained from 3-D mea-surements taken with a FASTRAK Polhemus digitizer, with specific attention given to bud creation and branching. Each branch seg-ment was analyzed to estimate its age, enabling us to docuseg-ment an-nual structural changes. We use the XL programming language and a GroIMP environment to simulate and compare different pruning scenarios.
Received January 15, 2012; Accepted February 14, 2012 *1Institute of Statistical Mathematics, Japan
1. Introduction
The Stone pine (Pinus pinea L.) is a common species in forest ecosys-tems of south Portugal with increasing economic and ecological impor-tance. Over the last forest inventory decade (1995–2005), the Stone pine’s range increased by 68%; it now covers more than 130,000 hectares (IFN, 2005). The tree’s key forest products include wood and nuts. The cones store as much or more carbon than the wood, but there is high annual variation in yield (Mutke et al., 2005).
A recent review by Barth´elemy and Caraglio (2007) demonstrates that plant architecture has long been a subject of research interest. Halle (1978), Lanner (1989), Prusinkiewicz et al.(1996), and others have studied crown architecture in detail, paying special attention to frac-tals - repetition of geometric structures and carbon allocation among different plant structures. Stone pine crown architecture has been the subject of a series of studies (Mutke et al., 2003, Mutke and Gil, 2004, Mutke et al., 2005) where researchers proposed a model for crown de-velopment based on measurements taken from 27 Stone pines. Surov´y et al.(2011) observed that Stone pine crown development may be sus-ceptible to light availability and that carbon allocation (or biomass development) tends to orient toward the light.
Many mathematical models have been developed to predict forest stand growth and, like plant architecture, such prediction has been of longstanding research interest (e.g., Mitchell, 1975, Pretzsch, 1992, Hasenauer, 1994, Nagel and Biging, 1996, Hasenauer, 2006, and Pret-zsch, 2009). These models can be divided into three categories - empir-ical, process-based, and functional-structural (Fourcaud et al., 2008). The first group of models is based primarily on empirical data recorded from different management strategies (i.e., different thinning regimes, densities, etc.) without supporting information about related physio-logical processes. Process-based, or combined models, incorporate
em-pirical data and information about physiological processes (Pretzsch, 2009). These models are adept at simulating and estimating forest dynamics and production under different management and climate sce-narios because they incorporate data from the management scheme with key variables related to abiotic (e.g., soil, climate, nutrition) and biotic (e.g., competition) factors. However, these models do not explic-itly consider plant morphology or architecture. As a result, key plant growth variables such as internal plant competition for resources are not included in the model. Thus, it is difficult to couple these mod-els with others that include variables for plant growth. It is possible to estimate, for example, stand structure and biodiversity (Pretzsch et al., 2002), but calculation of tree-stability (Sellier and Fourcaud, 2005), stand aesthetics (Surov´a and Pinto-Correia, 2008), light con-ditions (Dauzat et al., 2008), or other architectural characteristics is difficult or impossible using these models.
The last class of models is represented by structural and functional-structural models. Structural models (e.g., Kurth, 1994b, Kurth and Lanwert, 1995, Kurth and Anzola J¨urgenson, 1997, etc.) are focusing on algorithmical description of plant structure without taking to ac-count the physiological processes. Functional-Structural Plant Models (FSPMs) (e.g., Kurth, 1994, Perttunen et al., 1998, Godin et al., 2004, Prusinkiewicz, 2004 etc.) are models which describe the 3D architec-ture of the plant as it is ruled by physiological processes which are in turn driven by environmental factors (Vos et al., 2007). They can real-istically simulate not only architecture and structure of the plant, but also the production and responses to different management treatments. These models likely represent the highest level of detail - with respect to plant structure - that is functionally possible to model. Barriers to implementing them - computational power and memory requirements, as well as complex and extensive calculations - lead some to doubt their
application in the forest management setting (Pretzsch et al., 2008 in Courn´ede et al., 2009). It should be noted, however, that computer hardware development and computational power has undergone enor-mous expansion in the last few decades and this trend is expected to continue (Moore’s law). Additionally, the increasing number of posia and workshops (e.g., PMA09, the Plant Growth Modelling sym-posia regularly organized since 2003, and FSPM2010, the Functional-Structural Plant Modeling workshops regularly organized since 1996) dedicated to these models suggests scientific interest in their continued development and application is on the rise.
2. Material and Methods
The work presented here uses data from two completely digitized trees (Surov´y et al., 2011) taken from the Peg˜oes region of central Portugal.
2.1. 3-D Digitizing
The digitizing process begins by identifying and dividing the tree into individual branches, which are marked with reference points before they are cut from the tree. These points are then digitized and used to reconstruct the position of the branches after they have been removed (for a detailed description see Surov´y et al., 2011). For this study, the branches were digitized on the ground using a FASTRAK Polhemus magnetic digitizer that enables the acquisition of Cartesian coordinates in relation to a chosen origin, or 0,0 reference point.
The main advantage of a magnetic digitizer (or motion tracker) is that the magnetic field is able to penetrate the wood, allowing it to “see” through branch structures and record the coordinates of all points important for architecture studies. Laser scanning, on the other hand, is only capable of mapping surface points.
We used PiafDigit (Dones et al., 2006) to transfer information from FASTRAK into the database and our own software written in Delphi 2009 Professional (Embarcadero, California, USA) for visualizing and editing datasets. SPSS (IBM Corporation, Armonk, NY, USA) was used to analyze these data and calculate missing data points such as branch order (derived from coding), segment length, etc. as well as the statistical analysis mentioned in results chapter. After the tree was cut down, we took radial stem cuts and used an HP Scanjet 4850 to digitize the disk surfaces at a resolution of 600 dpi. Annual rings were delineated and the distance between them was measured in multiple directions (Surov´y et al., 2011).
2.2. Modeling Software
This study uses GroIMP (Growth Grammar-related Interactive Mod-elling Platform, Kniemeyer, 2008), whose API interface allows imple-mentation of different growth strategies based on the XL program-ming language. The XL programprogram-ming language implements relational growth grammars (Kurth, 1994) and can be used as a modeling lan-guage for specific data via a graph model interface (www.grogra.de). 2.3. Model Construction
In this article we present a simplified schematic model, which allows us to focus on functional structural growth development and associated characteristics. The model includes structural and functional elements. The structural, or 3-dimensional elements, are modeled according to geometric development, which can be described by breaking of buds (split), branch elongation, and bending or rotation of branches. As a rule, branching occurs where a bud will split into two side branches and one principal branch. Elongation is defined as a function of height
and branch order, based on our measurements:
[1] L = 15
o· (d + 1) · a
where L is the segment length, o is order (principal branches are signed order 1, branches originating from principal branches are as-signed order 2, and so on), d is the distance from the stem (an integer number that increases with each unit of measurement from the stem), and a is a coefficient.
Bending is defined as the angle at which a new branch bends from the direction of its predecessor. It is a function of both order (the side branches of n+1’s order bends under 30 degrees) and age (over time, the bending at each “junction point” generally increases downward). [2] Bi= (a +
1 t) · Bi−1
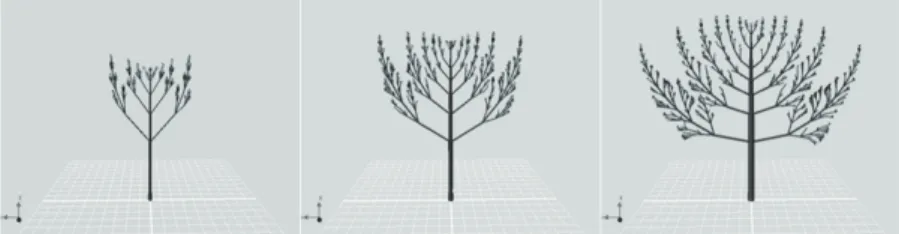
where Bi is the angle (bending) at age t, and Bi−1 is the bending at age t − 1 and a is a coefficient. The following functional characteristics have also been included in the model: 1) Bud mortality refers to the number of potential buds at the end of a branch that do not develop because of certain inhibiting factors, such as the presence of another branch in a space with shape of a cone with start in the branch’s end and rotation of the potential bud. 2) Branch competition impacts both bud development and branch elongation. If neighboring elements (i.e., two branches) are too close to each other, branch or bud development may be inhibited. The view of different age stages (5, 8 and 11 years) is show in Figure 1.
3. Results
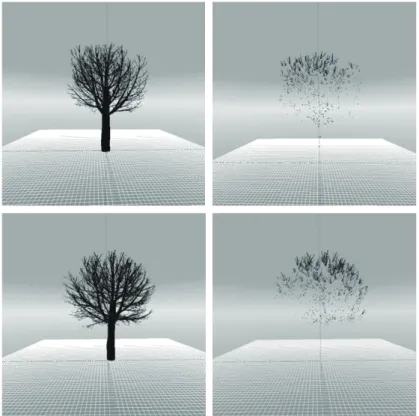
Figure 2 shows a digitized three-dimensional view of the trees (left side) and the incremental crown growth elongation recorded during the last year (right side). The final year’s growth is concentrated mostly in
Figure 1. Pine tree development after 5, 8, and 11 years (from left).
upper portions of the crown, though some growth can be observed in the lower reaches. The length of the final year’s growth, as well as the diameter and angle at which the branch developed from the bud, were observed and recorded for use in the structural model.
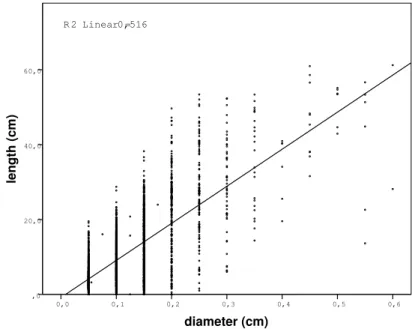
As shown in Figure 3, there is good correlation between branch di-ameter and the length of elongation, which has previously been doc-umented by other researchers (e.g., Mutke et al., 2005). That said, it could be difficult to determine which of these two variables is de-pendent. Furthermore, the small R2 value may be influenced by other factors that have bearing on this relationship, including competition status and site conditions (these observations are beyond the scope of this article, which focuses on the conceptual Functional Structural Plant Model).
For our model it is important to predict the length of elongation without depending on diameter because this measurement is unknown when the bud first begins to develop into a branch. The left side of Figure 4 shows the length of elongation depends on branch order, and that the relationship is clearly negative and nonlinear. The right side of the figure demonstrates the dependent relationship between elongation length and distance from the (0,0) point of origin (the point where the tree’s stem enters the soil). Once again, this relationship is clearly nonlinear, though it is positive, which suggests the more distant a bud
Figure 2. A digitized three-dimensional view of the trees (left) and the incremental crown growth recorded during the last year (right).
is from the tree base, the more the branch will grow. This observation underlines the fact that branches in outer portions of the crown tend to elongate more than those inside or near the bottom of the crown. Thus, it is important the conceptual model use the relative distance from the (0,0) point when distributing growth in each annual increment.
In this study we evaluate the feasibility of using an FSPM model to study the impact of different pruning regimes. For simplicity, we focus on removal of the bottom-most branches. Our goal is to demonstrate the impact timing of pruning can have on biomass production and
di-diameter (cm) 0,6 0,5 0,4 0,3 0,2 0,1 0,0 length (cm) 60,0 40,0 20,0 ,0 R 2 Linear = 0,516
Figure 3. Correlation between diameter and length of shoots.
ameter increment. We define biomass as the total length of all branch and stem segments on the tree. Potential diameter increment is deter-mined by the ratio of the total length of green branches to the total length of brown branches (branches with no foliage).
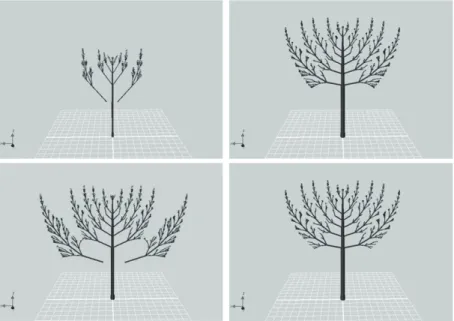
Figure 5 shows the visualized results from two different pruning sim-ulations. In the upper row, the lower branches were removed in the simulation’s 5th year and the tree was grown to the 12thand final year. In the bottom row, the lower branches were removed at age 10. This visualization demonstrates that the second case with later branch re-moval results in fewer buds on the lower branches when compared to the first case with earlier pruning. Thus, in the second case there is less biomass and lower potential diameter increment. All 15 possible scenarios are displayed in Figures 6 and 7.
order 5 4 3 2 1 Mean length (cm) 30,0 20,0 10,0 0,0 dist from 0 (cm) 500,0 400,0 300,0 200,0 100,0 length (cm) 60,0 40,0 20,0 ,0
Figure 4. The dependence between branch order and length of elongation (left), and between branch distance from the (0,0) point of
origin and elongation length (right).
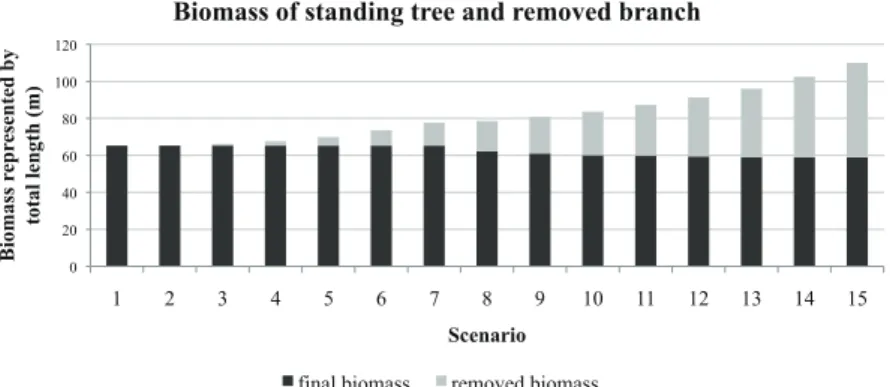
Figure 6 shows tree biomass in 15 different scenarios where the bot-tom branches are removed in the year displayed on the x-axis and total biomass after 15 years of growth is displayed on the y-axis (black is re-maining biomass and grey is biomass removed by pruning). The trend in Figure 6 suggests that pruning at a later period increases overall biomass.
Figure 7 shows potential diameter increment (ratio of the total length of green branches to the total length of brown branches, or branches with no foliage) under the 15 different scenarios. A scenario that results in more green branches than brown branches will have a higher poten-tial diameter increment than the opposite case where brown branches outnumber green branches. This graph shows branch removal in years 1-7 has no negative impact on potential diameter increment, though pruning the lower branches after year 7 clearly has a negative impact.
4. Conclusions
In this article we present a conceptual functional-structural plant model for Stone pine (Pinus pinea L.). This preliminary model is
Figure 5. Upper row: Bottom branches removed in year 5 (left) and the tree’s shape after 12 years (right); Bottom row: Bottom branches
removed in year 10 (left) and the tree’s shape after 12 years (right).
based on measurements taken from two complete trees, including ap-proximately 8,740 distinct branch segments, or shoots (some additional measurements were completed afterwards). We found significant cor-relation between branch diameter and the amount of branch growth (elongation) in a growing period, though the causality between these variables is unclear. We focused our efforts on modeling elongation in terms of the tree’s overall structural development. We found that branch elongation correlates most directly with branch order and dis-tance from the base of the stem. Disdis-tance from the base has a positive influence on elongation - more distant segments grow more in a given period. Branch order, on the other hand, has negative influence - lower order branches grow more in a given period.
0 20 40 60 80 100 120 1 2 3 4 5 6 7 8 9 10 11 12 13 14 15 Bi omas s re p re se n te d b y total l en gth (m) Scenario
Biomass of standing tree and removed branch
final biomass removed biomass
Figure 6. Evolution of tree biomass in 15 different scenarios (pruning occurs in year displayed on x-axis).
15 15.5 16 16.5 17 17.5 18 18.5 19 19.5 1 2 3 4 5 6 7 8 9 10 11 12 13 14 15 index gr ee n /b row n Scenario diameter growth
Figure 7. Index of potential diameter growth in 15 different scenarios (pruning occurs in year displayed on x-axis).
Our model uses the freely available GroIMP (Kniemeyer, 2008) plat-form and was written in the XL language, which enables implemen-tation of relational growth grammars (Kurth, 1994). We divide the growth process into structural and functional components, though both are applied simultaneously in each growth period. The key structural variables - branching and bending - are based on measured values. Functional variables include bud mortality (the number of potential
buds at the end of a branch that do not develop because of certain in-hibiting factors) and branch competition (branch or bud development that is inhibited by other branches).
We used the model to simulate 15 different pruning regimes to eval-uate its potential as a means of optimizing pruning regime. In each scenario the lower branches were removed at a different age (or growth period) and biomass development was evaluated. We also considered the ratio of green to brown (defoliated) branches in each tree at the end of the simulation period. This ratio was used to determine potential diameter increment. As Figures 6 and 7 demonstrate, these indicators showed opposite trends; however, potential diameter increment proved a useful measure for determining the optimal pruning regime.
Future work will include more precise measurement of light in-terception, which is possible using the “LightMode” class available in GroIMP. Light interception is important because shaded leaves contribute comparatively less to total photosynthetic production than leaves that receive full sun. The total biomass increment in a given period may be proportional not only to total leaf area, but also to the amount of light captured. Future work may also consider the relationship between branch bending, the position of a branch’s newest segment or growth, and space competition. Finally, development of a more flexible optimization algorithm may enable consideration of more complex pruning regimes that include selective removal of higher order branches.
Acknowledgements
The authors Peter Surov´y and Nuno de Almeida Ribeiro would like to acknowledge Institute of Statistical Mathematics and the Japanese Research Organization of Information and Systems for the scientific stay as invited professors and financial support. The first author would
like to acknowledge the financial support from the Japan Society for the Promotion of Science (JSPS).
References
Barth´el´emy, D. and Caraglio, Y. (2007) Plant architecture: A dynamic, multilevel and comprehensive approach to plant form, structure and ontogeny, Ann. Bot. 99: 375–407.
Courn´ede, P.H., Guyard, T., Bayol, B., Griffon, S., de Coligny, F., Bori-anne, P., Jaeger, M. and de Reffye, P. (2009) A forest growth simula-tor based on functional-structural modelling of individual trees, In: Third International Symposium on Plant Growth Modeling, Simu-lation, Visualization and Applications, p.34–41.
Dauzat, J., Clouvel, P., Luquet, D. and Martin, P. (2008) Using virtual plants to analyze the light-foraging efficiency of a low-density cotton crop, Ann. Bot. 101: 1153–1166.
Don´es, N., Adam, B. and Sinoquet, H. (2006) PiafDigit - software to drive a Polhemus FASTRAK 3 SPACE 3D digitizer and for the acquisition of plant architecture. Version 1.0 UMR PIAF INRA-UPB, Clermont-Ferrand, 15pp.
Fourcaud, T., Zhang, X., Stokes, A., Lambers, H. and K¨orner, C. (2008) Plant growth modeling and applications: The increasing importance of plant architecture in growth models, Ann. Bot-London. 101: 1053–1066.
Godin, C., Hanan, J., Kurth, W., Lacointe, A., Takenaka, A., Prusinkiewicz, P., et al. (2004) Proc. of the 4th International Workshop on Functional - Structural Plant Models. Montpellier, France: UMR AMAP.
Halle, F., Oldeman, R.A.A. and Thomlinson, P.B. (1978) Tropical trees and forests - an architectural analysis, Springer, Berlin, 441pp.
Hasenauer, H. (1994) Ein Einzelbaumsimulator fur ungleichaltrige Fichten-Kieferen- und Buchen-Fichtenmischbestande, Forstliche Schriftenreihe Universitat fur Bodenkultur, Wien, Band 8, 152pp. Hasenauer, H. (2006) Sustainable Forest Management. Growth Models
for Europe, Springer-Verlag Berlin Heidelberg, 398pp.
IFN (2011) Relatorio Final do 5.o Invent´ario Florestal Nacional, <http://www.afn.min-agricultura.pt/portal/ifn/relatorio-final-ifn5-florestat-1> (Accessed 1 January 2012)
Kniemeyer, O. (2008) Design and implementation of a graph grammar based language for functional-structural plant modelling. Disserta-tion work, Georg-Augustus-University, Goettingen, 425pp.
Kurth, W. (1994) Growth grammar interpreter GROGRA 2.4. Berichte des Forschungszentrums Wald¨okosysteme G¨ottingen, Ser.B 38, <http://www.uni-forst.gwdg.de/∼wkurth/public.html> Kurth, W. (1994b) Morphological models of plant growth: Possibilities
and ecological relevance, Ecol. Model. 75–76: 299–308.
Kurth, W. and Lanwert, D. (1995) Biometrische Grundlagen fuer ein dynamisches Architekturmodell der Fichte (Picea abies (L.) Karst.), Allg. Forst. Jagdztg. 166: 177–184.
Kurth, W., Anzola J¨urgenson, G.A.A. (1997) Triebwachstum und Verzweigung junger Fichten in Abh¨angigkeit von den beiden Ein-flussgr¨osen “Beschattung” und “Wuchsdichte”: Datenaufbereitung und -analyse mit GROGRA. In: Pelz, D. (Ed.), Deutscher Verband Forstlicher Forschungsanstalten, Sektion Forstl. Biometrie u. Informatik, 10. Tagung Freiburg i. Br. 1997, Ljubljana, Biotechn. Fakult¨at, p.89–108.
Lanner, M. (1989) An observation on apical dominance and the umbrella-crown of Italian Stone Pine (Pinus pinea, Pinaceae), Econ. Bot. 43: 128–130.
Mitchell, K.J. (1975) Dynamics and simulated yield of Douglas-fir, For-est. Sci. Monogr. 17: 1–39.
Mutke, S., Gordo, J., Climent, J. and Gil, L. (2003) Shoot growth and phenology modeling of grafted Stone pine (Pinus Pinea L.) in Inner Spain, Ann. Forest Sci. 60: 527–537.
Mutke, S. and Gil, L. (2004) An´alisis Y Modelizaci´on De La Arquitec-tura De Copa De Pinus Pinea L., Cuad. Soc. Esp. Cien. Forest 18: 71–76.
Mutke, S., Siev¨anen, R., Nikinmaa, E., Perttunen, J. and Gil, L. (2005) Crown architecture of grafted Stone pine (Pinus pinea L.): shoot growth and bud differentiation, Trees-Struct. Funct. 19: 15–25. Nagel, J. and Biging, G.S. (1995) Sch¨atzung der Parameter der
Weibullfunktion zur Generierung von Durchmesserverteilungen, Allg. Forst. Jagdztg. 166: 185–189.
Perttunen, J., Siev¨anen, R. and Nikinmaa, E. (1998) LIGNUM: A model combining the structure and the functioning of trees, Ecol. Model. 108: 189–198.
Pretzsch, H., Biber, P., ˇDursk´y, J., Von Gadow, K., Hasenauer, H., K¨andler, G., Kenk, G., Kublin, E., Nagel, J., Pukkala, T., Skovs-gaard, J.P., Sodtke, R. and Sterba, H. (2002) Recommendations for standardized documentation and further development of forest growth simulators, Forstw. Cbl. 121: 138–151.
Pretzsch, H. (2009) Forest Dynamics, Growth and Yield: From Mea-surement to Model, Springer-Verlag Berlin, Heidelberg, XIX, 664pp. Pretzsch, H. (1992) Konzeption und Konstruktion von Wuchsmod-ellen f¨ur Rein- und Mischbest¨ande, Forstliche Forschungsberichte M¨unchen 115: 332pp.
Prusinkiewicz, P., Hammel, M., Hanan, J. and Mech, R. (1996) Visual models of plant development. In: Rozenberg, G. and Salomaa, A. (Eds.) Handbook of Formal Languages, Vol. III: Beyond Words, p.535–597.
Prusinkiewicz, P. (2004) Modeling plant growth development, Curr. Opin. Plant. Biol. 7: 79–83.
Sellier, D. and Fourcaud, T. (2005) A mechanical analysis of the re-lationship between free oscillations of Pinus pinaster Ait. saplings and their aerial architecture, J. Exp. Bot. 56: 1563–1573.
Surov´a, D. and Pinto-Correia, T. (2008) Landscape preferences in the Cork Oak Montado in the region of Alentejo, Southern Portugal: searching for valuable landscape characteristics for different user groups, Landscape Res. 33: 311–330.
Surov´y, P., Ribeiro, N.A. and Pereira, J.S. (2011) Observations on 3-dimensional crown growth of Stone pine, Agroforest. Syst. 82: 105–110.
Vos, J., Marcelis, L.F.M. and Evers, J.B. (2007) Functional-structural plant modelling in crop production: adding a dimension. In: Vos, J., Marcelis, L.F.M., de Visser, P.H.B., Struik, P.C. and Evers, J.B. (Eds.) Functional-structural plant modelling in crop produc-tion, Dordrecht, Springer, p.1–12.