Comparative effects of nitrogen fertigation and granular
fertilizer application on growth and availability of soil
nitrogen during establishment of highbush blueberry
David R. Bryla1
* and Rui M. A. Machado2
1Horticultural Crops Research Unit, Agricultural Research Service, U.S. Department of Agriculture, Corvallis, OR, USA
2Departamento de Fitotecnia, Instituto de Ciências Agrárias e Ambientais Mediterrânicas, Universidade de Évora, Évora, Portugal
Edited by:
Sun Hee Woo, Chungbuk National University, South Korea
Reviewed by:
Md. Abdullahil Baque, Sher-e-Bangla Agricultural University, Bangladesh Mohammad Shameem Al Mamun, Bangladesh Tea Research Institute, Bangladesh
*Correspondence:
David R. Bryla, Horticultural Crops Research Unit, Agricultural Research Service, U.S. Department of Agriculture, 3420 NW Orchard Avenue, Corvallis, OR 97330, USA. e-mail: [email protected]
A 2-year study was done to compare the effects of nitrogen (N) fertigation and granular fertilizer application on growth and availability of soil N during establishment of highbush blueberry (Vaccinium corymbosum L. “Bluecrop”). Treatments included four methods of N application (weekly fertigation, split fertigation, and two non-fertigated controls) and four levels of N fertilizer (0, 50, 100, and 150 kg·ha−1N). Fertigation treatments were irri-gated by drip and injected with a liquid urea solution; weekly fertigation was applied once a week from leaf emergence to 60 d prior to the end of the season while split fertiga-tion was applied as a triple-split from April to June. Non-fertigated controls were fertilized with granular ammonium sulfate, also applied as a triple-split, and irrigated by drip or microsprinklers. Weekly fertigation produced the smallest plants among the four fertilizer application methods at 50 kg·ha−1N during the first year after planting but the largest plants at 150 kg·ha−1N in both the first and second year. The other application methods required less N to maximize growth but were less responsive than weekly fertigation to additional N fertilizer applications. In fact, 44–50% of the plants died when granular fertilizer was applied at 150 kg·ha−1N. By comparison, none of the plants died with weekly fertigation. Plant death with granular fertilizer was associated with high ammonium ion concentrations (up to 650 mg·L−1) and electrical conductivity (>3 dS·m−1) in the soil solution. Early results indicate that fertigation may be less efficient (i.e., less plant growth per unit of N applied) at lower N rates than granular fertilizer application but is also safer (i.e., less plant death) and promotes more growth when high amounts of N fertilizer is applied.
Keywords: Vaccinium corymbosum, ammonium-N, leaf nitrogen, mineral nutrition, nitrate-N, soil electrical conductivity, soil pH
INTRODUCTION
Most blueberry fields throughout the world are irrigated by sprin-klers or drip (Strik and Yarborough, 2005). While both irrigation methods are effective for commercial production of blueberry, a major advantage of drip is the capability of applying water-soluble fertilizers during irrigation. This procedure, otherwise known as fertigation, can apply fertilizer very uniformly throughout a field and directly to the roots in small and frequent amounts as needed, and it therefore has the potential to reduce total fertilizer applications, leaching, and runoff (Kafkafi and Tarchitzky, 2011). Numerous fertilizers are available for fertigation, but currently the most common products applied to blueberry include liquid urea [(NH2)2CO] and urea containing liquid fertilizers such as
urea ammonium nitrate, urea phosphate, and urea sulfuric acid. These products are considered well suited to blueberry because 1) the urea breaks down quickly to ammonium–N (NH4–N) and 2)
the fertilizers help acidify the soil; blueberry prefers NH4–N over
nitrate–N (NO3–N) and grows best when soil pH is between 4.2
and 5.5 (Eck, 1988;Korcak, 1988;Poonnachit and Darnell, 2004). The liquid fertilizers are usually injected throughout the growing season until 1–2 months prior to dormancy.
Granular urea or ammonium-based granular fertilizers, such as ammonium sulfate [(NH4)2SO4] or ammonium phosphate are
often used with sprinklers (or in rain-fed fields without irrigation). These products are typically applied in two or three split applica-tions in the spring when N uptake by the plant is considered most active (Hanson and Retamales, 1992;Throop and Hanson, 1997;
Bañados et al., 2006). Ammonium sulfate is the most acidifying of the group and is recommended when soil pH is above 5.0; urea or a blend of urea with (NH4)2SO4is recommended when pH is below
5.0 (Pritts and Hancock, 1992;Strik et al., 1993;Hart et al., 2006). Nitrogen recommendations for blueberry generally range from 20–140 kg·ha−1 per year, varying with plant age and vigor, soil type and fertility, and regional location (Hanson, 2006).Hart et al. (2006)updated the blueberry fertilizer guidelines for the north-western United States and recommend applying 17–26 g of N per plant per year during first 4 years after planting, 110–160 kg·ha−1 per year the following 3 years, and 160–180 kg·ha−1per year once the plants reach maturity (typically in 7–8 years). These rates assume that sawdust and ≈100 kg·ha−1 of N are incorporated in the soil prior to planting, and that sawdust mulch is applied to soil surface after planting and is replenished every few years
there afterward. The rates were developed for granular product applied as a broadcast band in the row (or under the drip line of young plants) but do not necessarily apply to fertigation with liquid fertilizers.
The objective of the present study was to compare the rela-tive effecrela-tiveness of fertigation with the standard application of granular fertilizer on plant growth and N uptake in a new plant-ing of highbush blueberry. Nitrogen rates were also evaluated to determine the optimum amount of fertilizer needed to maximize growth and production with each method. Nitrogen fertigation was applied by either split fertilizer injections or by weekly injec-tion. With split injections, fertilizer can be applied when most needed (e.g., during flowering, fruit set, and early shoot growth), but it may lead to root injury if the fertilizer becomes too con-centrated beneath the drip emitters. We hypothesized that weekly applications reduce the risk of root injury and encourage active uptake of nutrients throughout the growing season.
MATERIALS AND METHODS
A 0.24-ha field of “Bluecrop” highbush blueberry was planted at the Oregon State University Lewis-Brown Horticultural Research Farm in Corvallis, OR, USA in April 2006. Plants were obtained from a commercial nursery (as 2-year-old container stock) and spaced 0.76 m× 3.05 m apart on raised beds (0.4-m high and 0.9-m wide). Soil at the site was a Malabon silty clay loam (fine, mixed, superactive, mesic Pachic Ultic Argixerolls) adjusted to pH 5.5 with two applications of 670 kg·ha−1 of elemental S incor-porated 6 and 10 mos. prior to planting. A depth of 7.5 cm of Douglas-fir (Pseudotsuga menziesii Franco) sawdust was also incorporated within the plant row prior to planting, and 5 cm was applied on top of the beds immediately after planting. Grass alleyways (1.1-m wide) were planted and maintained between the beds.
An irrigation system was installed and designed with a manifold to accommodate 16 different fertilizer treatments. The treatments were arranged in a split-plot design and included four methods of fertilizer application (weekly fertigation, split fertigation, and
two non-fertigated controls) as main plots and four fertilizer rates (0, 50, 100, and 150 kg·ha−1N) as subplots. Each treatment plot consisted of one row of eight plants and was replicated six times. The two fertigation methods and one of the non-fertigated con-trols were irrigated by drip tubing (GeoFlow, Charlotte, NC, USA) placed along the top of the planting bed near the base of the plants. The tubing had 1.9 L h−1pressure-compensating, in-line emitters spaced 0.30-m apart and was covered with the sawdust applied after planting. The second non-fertigated control was irrigated with 22.7 L h−1 fan-jet microsprinklers (DC Series, Bowsmith, Exeter, CA, USA) located between each plant. The fan-jet emitters had a 2.7- to 3.0-m diameter, circular wetting pattern at operat-ing pressures of 100–140 kPa. Irrigation was controlled in each treatment by electric solenoid valves and an automatic timer set weekly.
Liquid urea (20N–0P–0K) was injected during weekly and split fertigations using Venturi-type injectors (Mazzei Model 584 Injec-tor, Mazzei Injector Corp., Bakersfield, CA, USA) installed at the inflow of each drip system. Weekly fertigation was applied once a week in 18 equal fertilizer applications from leaf emergence (mid April) to about 60 days prior to the end of the growing season (mid August), while split fertigation was applied once a month from April to June in three equal applications. Non-fertigated controls were fertilized with granular ammonium sulfate (21N-0P-0K-24S) and irrigated by drip or microsprinklers (simulates conventional overhead sprinkler irrigation). Granular fertilizer was also applied in three equal applications from April to June and was evenly spread around the base of the plants in 2006 (year 1) and banded on each side of the plants in 2007 (year 2). Since soil P and K levels were sufficient, no pre- or post-plant applications of P and K were added.
Irrigations were scheduled based on precipitation and estimates of crop evapotranspiration (ETc) obtained at least weekly from
a Pacific Northwest Cooperative Agricultural Weather Network AgriMet weather station (http://usbr.gov/pn/agrimet/) located
<0.25 km from the field site. Evapotranspiration estimates were
adjusted for plant size and irrigation system efficiency in each
FIGURE 1 | Canopy cover of “Bluecrop” blueberry fertilized by weekly fertigation, split fertigation, or granular fertilizer (irrigated by drip or
microsprinklers) applications at 0, 50, 100, and 150 kg·ha−1N. Each symbol
treatment following procedures outlined inHolzapfel et al. (2004). Water applications were measured using turbine water meters (Sensus Metering Systems, Uniontown, PA, USA) installed at the inflow of each irrigation system.
Canopy cover was estimated on August 30, 2006 and August 28, 2007 from digital images captured using an ADC multispectral camera (TetraCam Inc., Chatsworth, CA, USA). The camera was suspended from a marked trellis wire located≈2.5 m above the
FIGURE 2 | Proportion of dead “Bluecrop” blueberry plants fertilized by weekly fertigation, split fertigation, or granular fertilizer (irrigated by drip or microsprinklers) applications at 0, 50, 100, and 150 kg·ha−1N.
Dead plants were counted in October 2006. Each bar represents the mean of six plots and error bars represent±1 SE.
planting bed. Images were collected on each date from every other plant of the center six plants in each plot, for a total of 288 images per date. Percent live cover in each image was determined using software (Pixelwrench and Briv32) provided by the camera manu-facturer. Care was taken to ensure that image area always exceeded canopy width of each image. Any cover by weeds or the grass alley-way was cleaned from the images using Adobe Photoshop v. 5.0 (Adobe Systems Inc., San Jose, CA, USA) prior to analysis. Live cover was converted to total percent canopy cover based on the proportion of the field covered by each image.
Soil solution was extracted from the soil using hydrophilic porous polymer soil moisture samplers (Eijkelkamp Agrisearch Equipment, Giesbeek, The Netherlands), according to procedures described bySpangenberg et al. (1997). Nine 10-cm long samplers were installed near one of the two center plants of each plot on April 2007; one sampler was located near the base of the plant and two each were located at 10-cm increments from the plant in both directions along the drip lateral and in both directions perpendicular to the row. Ten ml of soil solution was collected periodically from each sampler, pooled in each replicate, and ana-lyzed for NH4–N and NO3–N using a rapid flow analyzer (Alpkem
Flow Solution III, OI Analytical, College Station, TX, USA) and for electrical conductivity using a calibrated conductivity meter (Omega Engineering, Inc., Stamford, CT, USA). Leaf samples (six leaves from the center six plants in each plot) were also collected July 28, 2006 and July 29, 2007, oven-dried at 70˚C, ground, and analyzed for total N using a combustion analyzer (model CNS-2000, LECO Corporation, St. Joseph, MI, USA), and soil samples (2 cm× 10 cm cores) were collected from the center of each plot on May 23, July 27, and September 27, 2007 and analyzed for soil pH [1 soil: 1 water (by volume)].
FIGURE 3 | Leaf N concentration of “Bluecrop” blueberry fertilized by weekly fertigation, split fertigation, or granular fertilizer (irrigated by drip
or microsprinklers) applications at 0, 50, 100, and 150 kg·ha−1N. Each
Data were analyzed by split-plot analysis of variance using SAS v. 9.1 (SAS Institute, Cary, NC, USA) with application method treated as the main plot effect and fertilizer level treated as the subplot effect. Comparisons among application methods were performed at the 0.05 level using Fisher’s protected least signif-icance difference (LSD0.05) test and response to fertilizer levels
was determined using orthogonal polynomials.
RESULTS AND DISCUSSION YEAR 1
Canopy cover (which indicates the relative size of young plants) was significantly affected by the rate of N fertilizer application (P< 0.0001) during the first year after planting (2006). However, the interaction between N application method and level was also significant (P< 0.01), which indicates that the response of canopy cover to N application differed among the fertilizer application methods (Figure 1). In general, weekly fertigation produced the
lowest canopy cover at 50 kg·ha−1N and the highest canopy cover at 150 kg·ha−1N in year 1. Apparently, plants fertilized by the other methods required less N to produce their canopy but were less responsive than those fertigated weekly to additional N fertil-izer applications. In fact, as many as half the plants died when they were fertilized at 150 kg·ha−1N with granular fertilizer (Figure 2). This occurred whether plants were irrigated by microsprinklers or drip. Alternatively, none of the plants died when they were fertigated weekly.
Leaf N concentration was highest in year 1 when plants were fertilized with granular fertilizer and irrigated by microsprinklers and lower when plants were fertigated, especially when split fer-tigated (Figure 3). However, despite the difference, leaf N was sufficient (>15 g·kg−1) when plants were weekly fertigated at 100–150 kg·ha−1N. Leaf N concentrations<15 g·kg−1are often considered deficient in blueberry (mature plants) while those
>20 g·kg−1 are usually considered above normal (Hart et al.,
2006).
The first year results indicated that fertigation was actually less efficient (i.e., less plant growth per unit of N applied) than gran-ular fertilizer application but is also safer (i.e., less plant death) when high amounts of fertilizer is applied. This may have occurred because granular fertilizer was applied around the base of the plants directly to the roots while fertigation was applied along the entire length of the plant row. Results may have been more com-parable among treatments if the granular fertilizer was banded along the row beginning the first year after planting rather than the second year.
YEAR 2
By year 2, weekly fertigation no longer produced the lowest canopy cover at 50 kg·ha−1N and produced the highest canopy cover at both 100 and 150 kg·ha−1N (Figure 1). In fact, canopy cover continued to increase with higher N application when plants were fertigated weekly (and may have even continued to do so at higher rates of N application) but reached a maximum at 50–100 kg·ha−1 when N fertilizer was applied by the other application methods.
Bañados et al. (2006)also found that granular ammonium sulfate fertilizer was optimum for blueberry growth at 50–100 kg·ha−1N and reduced growth at 200 kg·ha−1N.
Leaf N also increased with N application in year 2 but was similar between the weekly fertigation and the granular tilizer treatment with microsprinklers (Figure 3). Plants fer-tilized by split fertigation or with granular fertilizer and drip tended to be N deficient, with leaf N concentrations<15 g·kg−1 (Figure 3).
Soil pH declined in the root zone the second year as more N fertilizer was applied (Figure 4). Ammonium-N applica-tion often reduces soil pH (Marschner, 1995). In sand culture,
FIGURE 4 | Soil pH in plots of “Bluecrop” blueberry fertilized by weekly fertigation, split fertigation, or granular fertilizer (irrigated by drip or microsprinklers) applications at 0, 50, 100, and
150 kg·ha−1N. Soil samples were collected and analyzed for pH during the
second growing season (2007). Each symbol represents the mean of three pooled plots and error bars represent±1 SE.
Merhaut and Darnell (1995)found that pH decreased from about 4.5 to 3.0 when blueberries were fed only NH4–N for 140 days
but increased to 6.0 when the plants were fed only NO3–N.
Bac-terial nitrification of NH4 to NO3 may further reduce soil pH,
although this process is somewhat limited under the acidic con-ditions of most blueberry fields (Schmidt, 1982;Paul and Clark, 1989).
Soil pH was also generally lower with microsprinklers than with drip – even when no fertilizer was applied (Figure 4). With-out N, pH averaged 5.6 with microsprinklers and 6.1–6.3 with drip. Wetting more soil with microsprinklers probably increased the activity of sulfur-oxidizing bacteria such as Thiobacillus spp. These bacteria readily reduce soil pH by oxidizing elemental S (applied before planting) to H2SO4(sulfuric acid) (Germida and
Janzen, 1993;Tisdale et al., 1993). Microsprinklers may also leach higher amounts of cations, such as Ca2+ and Mg2+, driving soil pH even lower (Stevenson and Cole, 1999).
As mentioned earlier, ammonium sulfate is often recom-mended when soil pH is above 5.0 while urea is recomrecom-mended below 5.0 (Pritts and Hancock, 1992;Strik et al., 1993;Hart et al.,
2006). However, soil pH did not appear affected by fertilizer type in the present study. Plots fertilized with ammonium sulfate and irrigated by microsprinklers had almost the same pH as those fer-tigated each week with liquid urea at 150 kg·ha−1N, while plots fertilized with ammonium sulfate and irrigated by drip at 100– 150 kg·ha−1N actually had higher pH than those fertigated with liquid urea either weekly or in a triple-split application (Figure 4). Ammonium-containing fertilizers lower soil pH gradually, and therefore, fertilizer effects on pH may not have been detectable during the short duration of the study.Horneck (1995)found that pH decreased by only 0.1 unit per year for every 110 kg·ha−1of NH4–N applied to four grass seed (Lolium perenne L. and Festuca
arundinacea Schreb.) fields in Oregon.
Whether irrigated by microsprinklers or drip, granular N appli-cation maintained much higher concentrations of NH4–N in
the soil than either of the two fertigation methods (Figure 5). With granular ammonium sulfate, NH4–N averaged 5–31 mg·L−1
with drip and 55–318 mg·L−1with microsprinklers; peak concen-trations occurred immediately after application, reaching levels as high as 121–138 mg·L−1with drip and 223–662 mg·L−1with
FIGURE 5 | Ammonium–nitrogen (NH4–N) concentrations in soil solution
samples collected from “Bluecrop” blueberry fertilized by weekly fertigation, split fertigation, or granular fertilizer (irrigated by drip or
microsprinklers) applications at 0, 50, 100, and 150 kg·ha−1N. Solution
was collected periodically from the root zone during the second growing season (2007). Each symbol represents the pooled average of six plots.
microsprinklers when 100–150 kg·ha−1N was applied. Fertigation treatments, by comparison, averaged<3 mg·L−1over the season and never exceeded 9 mg·L−1at any time during the season, even when plants were split fertigated.
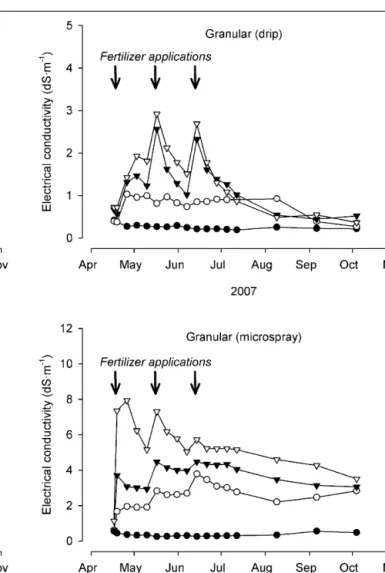
Electrical conductivity in the soil solution (ECw) was much
higher with granular fertilizer applications, especially when plants were irrigated by microsprinklers (Figure 6). Electrical conduc-tivity is a good indicator of soil salinity and salt stress. It tends to increase rapidly with high concentrations of ammonium sul-fate (Bunt, 1988), potentially leading plants to salinity problems when too much of the fertilizer is applied (Caruso and Ramsdell, 1995). In a preliminary study, we found that ECwincreased
lin-early at a rate of 2 dS·m−1for each gram of ammonium sulfate fertilizer dissolved per liter of distilled water (Machado and Bryla, unpublished results). Blueberry is considered sensitive to soil EC levels>1.5–2.0 dS·m−1(Patten et al., 1989;Muralitharan et al., 1992). Electrical conductivity was often>2 dS·m−1when granu-lar fertilizer was applied but always<1.5 dS·m−1with fertigation.
Plants fertilized with the highest rates of ammonium sulfate suf-fered from apparent salt stress (leaf necrosis and, in severe cases, plant death) during the first summer after planting. As mentioned above, 44–50% died and had to be replaced when granular ammo-nium sulfate was applied at a rate of 150 kg·ha−1N (Figure 2). By comparison,<6% of the plants died at that same N level when urea was applied by split fertigation, and no plants showed any sign of salt stress with weekly fertigation. Ammonium toxicity has also been suggested as a problem when too much NH4fertilizer is
applied (Britto and Kronzucker, 2002); however, a typical symp-tom is leaf chlorosis, which was not observed in any of the fertilized plants in the present study.
Granular fertilizer and microsprinklers also resulted in the highest concentrations of NO3–N in soil solution (Figure 7). On
average over the season, NO3–N generally increased with the rate
of N application and ranged from 125–180 mg·L−1in the granu-lar (microsprinkler) treatment, compared to only 22–67 mg·L−1 with granular (drip) or weekly fertigation and only 15–39 mg·L−1
FIGURE 6 | Electrical conductivity of soil solution samples collected from “Bluecrop” blueberry fertilized by weekly fertigation, split fertigation, or granular fertilizer (irrigated by drip or microsprinklers) applications at 0,
50, 100, and 150 kg·ha−1N. Solution was collected periodically from the root
zone during the second growing season (2007). Each symbol represents the mean of three pooled plots.
FIGURE 7 | Nitrate–nitrogen (NO3–N) concentrations in soil solution
samples collected from “Bluecrop” blueberry fertilized by weekly fertigation, split fertigation, or granular fertilizer (irrigated by drip or
microsprinklers) applications at 0, 50, 100, and 150 kg·ha−1N. Solution
was collected periodically from the root zone during the second growing season (2007). Each symbol represents the pooled average of six plots.
with split fertigation. By September, NO3–N in the granular
(microsprinkler) treatment reached as high as 323–417 mg·L−1 when 100–150 kg·ha−1N was applied. The highest levels reached in the other treatments were 157 mg·L−1 (13 July) with weekly fertigation and 102–114 mg·L−1(May–June) with granular (drip) and split fertigation. Since the ability of blueberry to acquire NO3–
N is uncertain, high concentrations of NO3–N may lead to N
leaching, especially when levels are high late in the year and plants become dormant.
CONCLUSION
Overall, during establishment, applying adequate N through the drip irrigation system enhanced early growth of blueberry when compared to N applied as granular fertilizer.Finn and Warmund (1997)found a similar result and reasoned that N placed above the sawdust mulch may have been partially immobilized by the organic mulch as soil microorganisms used some of the available N to break down the mulch. In fact,Gough (1994)recommended that the normal amount of N fertilizer be doubled when applied
on the mulch surface.Still et al. (1972)found that N was the most important factor limiting plant growth when sawdust was used as a soil amendment. However, the present results showed that plant N levels were actually higher with granular fertilizer applica-tion than with fertigaapplica-tion. Fertigaapplica-tion more likely increased plant growth over granular fertilizer by reducing salt stress and main-taining safe and optimum levels of NH4–N within the root zone
throughout the season. Later work will examine the effects of each treatment on fruit production.
ACKNOWLEDGMENTS
We thank Will Fummerton, Hannah Rempel, and Rick Moes for technical assistance. Research was funded in part by the Northwest Center for Small Fruits Research and the Oregon Blueberry Com-mission. Mention of trademark, proprietary product, or vendor does not constitute a guarantee or warranty of the product by the U.S. Department of Agriculture and does not imply its approval to the exclusion of other products or vendors that also may be suitable.
REFERENCES
Bañados, P., Strik, B., and Righetti, T. (2006). The uptake and use of 15N-nitrogen in young and mature field-grown highbush blueberries. Acta
Hortic. 715, 357–364.
Britto, D. T., and Kronzucker, H. J. (2002). NH4+ toxicity in higher plants: a critical review. J. Plant
Physiol. 159, 567–584.
Bunt, A. C. (1988). Media and Mixes
for Container Grown Plants. London:
Unwin Hyman Ltd.
Caruso, F. L., and Ramsdell, D. C. (1995). Compendium of Blueberry
and Cranberry Diseases. St. Paul,
MN: APS Press.
Eck, P. (1988). Blueberry Science. New Brunswick, NJ: Rutgers University Press.
Finn, C. E., and Warmund, M. R. (1997). Fertigation vs. surface appli-cation of nitrogen during blueberry plant establishment. Acta Hortic. 446, 397–401.
Germida, J. J., and Janzen, H. H. (1993). Factors affecting the oxidation of elemental sulfur in soils. Nutr. Cycl.
Agroecosys. 35, 101–114.
Gough, R. E. (1994). The Highbush
Blue-berry and its Management. New York,
NY: Food Products Press. Hanson, E. J. (2006). Nitrogen
fertil-ization of highbush blueberry. Acta
Hortic. 715, 347–351.
Hanson, E. J., and Retamales, J. B. (1992). Effect of nitrogen source and timing on highbush blue-berry performance. HortScience 27, 1265–1267.
Hart, J., Strik, B., White, L., and Yang, W. (2006). Nutrient management for blueberries in Oregon. Oregon
State University Extension Service, Corvallis, OR [EM8918]. Holzapfel, E. A., Hepp, R. F., and
Marino, M. A. (2004). Effect of irrigation on fruit production in blueberry. Agric. Water Manag. 67, 173–184.
Horneck, D. A. (1995). Nutrient
Man-agement and Cycling in Grass Seed Crops. Ph.D. Dissertation, Oregon
State University, Corvallis, OR. Kafkafi, U., and Tarchitzky, J. (2011).
Fertigation: A Tool for Efficient Fertilizer and Water Management.
Paris: International Fertilizer Indus-try Association.
Korcak, R. F. (1988). Nutrition of blue-berries and other calcifuges. Hortic.
Rev. 10, 183–227.
Marschner, M. (1995). Mineral
Nutri-tion of Higher Plants, 2nd Edn. San
Diego, CA Academic Press. Merhaut, D. J., and Darnell, R. L. (1995).
Ammonium and nitrate accumula-tion in containerized southern high-bush blueberry plants. HortScience 30, 1378–1381.
Muralitharan, M. S., Chandler, S. F., and Van-Steveninck, R. F. M. (1992). Effects of sodium chloride and sodium sulphate on growth and solute composition of highbush blueberry (Vaccinium corymbosum).
Aust. J. Plant Physiol. 19, 155–164.
Patten, K., Neuendorff, E., Nimr, G., Haby, V., and Wright, G. (1989). Cultural practices to reduce salin-ity/sodium damage of rabbiteye blueberry plants (Vaccinium ashei Reade). Acta Hortic. 241, 207–212. Paul, E. A., and Clark, F. E. (1989). Soil
Microbiology and Biochemistry. San
Diego, CA: Academic Press.
Poonnachit, U., and Darnell, R. (2004). Effect of ammonium and nitrate on ferric chelate reductase and nitrate reductase in Vaccinium species. Ann.
Bot. 93, 399–405.
Pritts, M. P., and Hancock, E. J. (1992).
Highbush blueberry production guide, NRAES-55. Ithaca, NY: NRAES.
Schmidt, E. L. (1982). “Nitrification in soil,” in Nitrogen in Agricultural Soils, ed. F. J. Stevenson (Madison, WI: American Society of Agronomy), 253–288.
Spangenberg, A., Gecchini, G., and Lamersdorf, N. (1997). Analyz-ing the performance of a micro soil solution sampling device in a laboratory examination and a field experiment. Plant Soil 196, 59–70.
Stevenson, F. J., and Cole, M. A. (1999).
Cycles of Soil Carbon, Nitrogen, Phos-phorus, Sulfur, Micronutrients. New
York, NY: John Wiley & Sons. Still, S., Gartner, J. B., and Hughes,
T. D. (1972). Effect of sawdust age and nitrogen application on chrysanthemums grown in white oak sawdust media. For. Prod. J. 22, 25–28.
Strik, B., Brun, C., Ahmedullah, M., Antonelli, A., Askam, L., Bar-ney, D., Bristow, P., Fisher, G., Hart, J., Havens, D., Ingham, R., Kaufman, D., Penhalgon, R., Pscheidt, J., Scheer, B., Shanks, C., and William, R. (1993).
High-bush Blueberry Production.
Ore-gon State University Extension Ser-vice Publication, Corvallis, OR [PNW 215].
Strik, B. C., and Yarborough, D. (2005). Blueberry production trends
in North America, 1992 to 2003 and predictions for growth.
Horttechnol-ogy 15, 391–398.
Throop, P. A., and Hanson, E. J. (1997). Effect of application date on absorp-tion of15Nitrogen by highbush
blue-berry. J. Am. Soc. Hortic. Sci. 122, 422–426.
Tisdale, S. L., Nelson, W. L., Beaton, J. D., and Havlin, U. (1993). Soil Fertility
and Fertilizers. Upper Saddle River,
NJ: Prentice Hall.
Conflict of Interest Statement: The authors declare that the research was conducted in the absence of any commercial or financial relationships that could be construed as a potential conflict of interest.
Received: 06 August 2011; paper pend-ing published: 19 August 2011; accepted: 19 August 2011; published online: 19 September 2011.
Citation: Bryla DR and Machado RMA (2011) Comparative effects of nitrogen fertigation and granular fertilizer appli-cation on growth and availability of soil nitrogen during establishment of high-bush blueberry. Front. Plant Sci. 2:46. doi: 10.3389/fpls.2011.00046
This article was submitted to Frontiers in Crop Science and Horticulture, a specialty of Frontiers in Plant Science.
Copyright © 2011 Bryla and Machado. This is an open-access article subject to a non-exclusive license between the authors and Frontiers Media SA, which permits use, distribution and reproduc-tion in other forums, provided the original authors and source are credited and other Frontiers conditions are complied with.